

Abstract
Audible frequencies of sound are encoded in a continuous manner along the length of the cochlea, and frequency is transmitted to the brain as a representation of place on the basilar membrane. The resulting tonotopic map has been assumed to be a continuous smooth progression from low to high frequency throughout the central auditory system. Here, physiological and anatomical data show that best frequency is represented in a discontinuous manner in the inferior colliculus, the major auditory structure of the midbrain. Multiunit maps demonstrate a distinct stepwise organization in the order of best frequency progression. Furthermore, independent data from single neurons show that best frequencies at octave intervals of approximately one-third are more prevalent than others. These data suggest that, in the inferior colliculus, there is a defined space of tissue devoted to a given frequency, and input within this frequency band may be pooled for higher-level processing.
- auditory
- inferior colliculus
- tonotopic organization
- laminar organization
- 3-D reconstruction
- critical bands
Introduction
A distinct feature of sensory systems is the topographical representation of the sensory epithelium in the CNS. In the auditory system, the sensory epithelium in the cochlea is organized according to frequency. Receptor cells are maximally stimulated by different frequencies of sound depending on their position along the basilar membrane. The resulting gradient in frequency tuning gives rise to a topographic representation of sound frequency, or tonotopic organization, a representation that is maintained in a point-to-point manner from the first auditory relay center, the cochlear nucleus, up to the cortex (Ehret and Schreiner, 2005).
The inferior colliculus (IC) is the major processing center in the auditory midbrain (Irvine, 1992). Anatomically, the central nucleus of the IC (CNIC) is composed of fibrodendritic laminae (Oliver and Morest, 1984; Malmierca et al., 1993). This laminar organization is made up of flat, disk-shaped neurons and axonal afferents that originate in lower auditory centers (Malmierca et al., 2005). The afferent axons parallel the dendritic fields of the disk-shaped neurons (Semple and Aitkin, 1979; Oliver and Morest, 1984; Malmierca et al., 1993, 1995). These anatomical laminae are thought to be the morphological substrate for the tonotopic organization described in electrophysiological studies (Rose et al., 1966; Clopton and Winfield, 1973; Merzenich and Reid, 1974), but the relationship between frequency representation and laminar structure is not fully understood.
The tonotopic organization in the CNIC is often assumed to be a continuous progression from low to high frequency (Rose et al., 1966; Clopton and Winfield, 1973; Merzenich and Reid, 1974). However, multiunit recordings of best frequency (BF) at threshold from the CNIC in the cat have described a stepwise progression in the tonotopic organization of the IC (Schreiner and Langner, 1997). These findings are consistent with a fine structure in which each anatomical lamina also represents a functional module in which a specific frequency range is represented. It is not known how this tonotopic pattern corresponds with the BF of single neurons, nor is it known how the stepwise progression seen by Schreiner and Langner (1997) relates to the anatomical laminae within the IC. These details are important because they can provide insights into how the auditory system extracts and transmits spectral information from the cochlea to higher centers. Furthermore, understanding this spectral coding will help to further develop promising new auditory prosthetic devices that use electrodes implanted in the IC and are now in clinical trials (Lenarz et al., 2006; Lim and Anderson, 2006, 2007; Lim et al., 2007).
To investigate this relationship, we conducted three series of complementary experiments in anesthetized rats to obtain details about the fine-grained tonotopic progression in the CNIC. We used multiunit recordings to demonstrate that the rat IC shows a stepwise progression of BF, and single-unit recordings of frequency response areas (FRAs) to determine whether the BF of individual neurons in the IC is correlated with the frequency steps seen in the multiunit mapping. Finally, we used computer-assisted three-dimensional (3-D) reconstructions to show the relationship between anatomical and physiologically defined laminae.
Materials and Methods
This study is based on three sets of complementary experiments that included (1) multiunit tonotopic mapping, (2) single-unit recording and measurement of FRAs, and (3) anatomical tracing combined with computer-assisted 3-D reconstructions. The procedures for the physiological and morphological experiments are described separately.
The use of experimental animals in this study followed the National Institutes of Health Guidelines and the Society for Neuroscience Policy on the Use of Animals in Neuroscience Research under the supervision of the Institutional Animal Care and Use Committee. All experiments were conducted in Salamanca, and procedures were approved by The University of Salamanca Animal Care Committee and were in accord with National Institutes of Health guidelines.
Anesthesia and surgical preparation for single-unit and multiunit recording.
Extracellular single-unit or multiunit activity was recorded from the IC in 137 pigmented rats (Rattus norvergicus, Rj:Long–Evans; body weight, 109–420 g) of both sexes. The methods have been described in previous studies (Hernández et al., 2005; Pérez-González et al., 2005, 2006), so only the essential details are given here. Animals were anesthetized with urethane (1.5 g/kg, 20% solution, i.p.), and anesthesia was maintained with supplementary doses of urethane (0.5 g/kg, i.p.) to preserve an areflexive state.
The trachea was cannulated, and atropine sulfate (0.05 mg/kg, s.c.) was used to reduce bronchial secretions. The animal was placed inside a double-walled sound attenuation room. A local anesthetic (lidocaine) was applied to the ears, and the rat's head was immobilized and placed in a stereotaxic frame with the ear bars replaced by hollow specula that accommodated a sound delivery system (Rees et al., 1997; Hernández et al., 2005). The animal's body temperature was monitored with a rectal probe and maintained at 38°C by a thermostatically controlled electric blanket. A midsagittal scalp incision was made, the muscle and underlying periosteum were scraped away, and a small hole was made in the skull over the occipital cortex. The dura was reflected, and the exposed cortex was covered with 2% agar to prevent desiccation. Neuronal responses were recorded in the IC contralateral to the stimulated ear using tungsten-in-glass electrodes (Merryll and Ainswoth, 1972). The electrode depth was remotely controlled using a microdrive (Burleigh 6000; Burleigh Instruments, Fishers, NY) with a resolution of 1 μm.
Stimulus presentation, electrophysiological recording of single units, and FRA generation.
A total of 604 FRAs were obtained from 125 rats. Some (n = 400) of the units were used for other studies (n = 237 from Hernández et al., 2005; n = 163 from Pérez-González et al., 2005, 2006). Of the 604, 237 units were recorded from 67 rats in a laboratory where stimuli were generated with a waveform generator (8904A multifunction synthesizer; Hewlett Packard, Palo Alto, CA) controlled by a computer (Hernández et al., 2005). Stimuli were delivered monaurally through a closed acoustic system based on Sony (Tokyo, Japan) MDR 868 earphones. The output of the system at each ear was calibrated in situ using a ¼ inch condenser microphone (model 4136; Brüel and Kjær, Nærum, Denmark) and a DI-2200 spectrum analyzer (Diagnostic Instruments, Livingston, Scotland, UK). The maximum output was flat from 0.3 to 8 kHz [≈100 ± 5 dB sound pressure level (SPL)] and then fell off with a slope of ∼10 dB/octave. The highest frequency produced by this system was limited to 25 kHz. Extracellularly recorded action potentials were amplified (10,000×; BAK MDA-4I; BAK Electronics, Germantown, MD), filtered (0.3–3 kHz), discriminated (BAK DIS-I; BAK Electronics), and time-stamped with an accuracy of 10 μs by a CED-1401plus Laboratory Interface (Cambridge Electronic Design, Cambridge, UK).
Complete excitatory FRAs were obtained using contralateral monaural stimulation in an automated procedure according to the method of Evans (1979). This method has been widely used in other studies (Sutter and Schreiner, 1991; Snyder et al., 2000; LeBeau et al., 2001; Snyder and Sinex, 2002). Stimuli were 969 presentations of 50 ms pure tones (5 ms rise/fall time) at a rate of 4/s. Sound level was varied between 0 and 90 dB of attenuation in 5 dB steps, and frequency was changed in 51 logarithmically spaced steps, 2 octaves around the BF of the unit. Stimuli were presented in a random sequence. FRA plots show response magnitude as a grid of vertical bars positioned at the frequency/intensity coordinates of the stimuli eliciting the responses. Bar length is proportional to the spike count for each set of stimulus conditions (Hernández et al., 2005). Threshold was identified as the lowest sound level to elicit a response, and BF was defined as the frequency with the lowest threshold.
The remaining 367 single units (from 58 rats) were recorded using stimuli synthesized on a System II workstation [Tucker-Davis Technologies (TDT), Gainesville, FL] using custom software and delivered by two electrostatic speakers (TDT EC1) controlled by an electrostatic speaker driver (TDT ED1). Action potentials were amplified (10,000×) with a Bioamp amplifier (TDT) and filtered (0.5–3 kHz; TDT DB4) before being processed in a spike discriminator (TDT SD1). The spike times were then stored on a computer. The maximum output of the TDT system was flat from 0.3 to 5 kHz (≈100 ± 7 dB SPL) and from 5 to 40 kHz (90 ± 5 dB SPL). The highest frequency produced by this system was limited to 40 kHz. In this and the above system, the second and third harmonic components in the signal were 40 dB or more below the level of the fundamental at the highest output level. The monaural stimuli used to generate FRAs in single units were pure tones with a duration of 75 ms. Frequency and intensity of the stimulus were varied randomly (0–100 dB attenuation and 2 octaves above and below the BF). Each stimulus was presented two to five times.
The FRA data were analyzed and plotted using commercial software [Excel (Microsoft, Redmond, WA), Quattro Pro (Corel, Ottawa, Ontario, Canada), SigmaPlot (SPSS, Chicago, IL), Matlab (MathWorks, Natick, MA), Origin (OriginLab, Northampton, MA), and SPSS]. Log histograms were generated with Excel and plotted with Origin. The latter program was used to smooth and pick the peaks.
Multiunit mapping of tonotopic organization.
For the mapping studies, we used 16 rats. These recordings were made using the TDT lab configuration. The anesthesia and surgical preparation was similar to that described above for the single-unit recordings. Penetrations were from anterodorsal to posteroventral through the IC at an angle 10° from the frontal plane (see Fig. 8C). This angle is approximately orthogonal to the predominant orientation of isofrequency laminae (Malmierca et al., 1993). The electrode was advanced in steps of 25 or 50 μm, and recordings were made at each site. At most recording sites, multiunit activity was observed, but less frequently the responses of well isolated single neurons could be studied. Entry of the microelectrode into the CNIC was established by the presence of a robust response to low-frequency tones. Moreover, there was a low-to-high progression of BF as the electrode traversed a dorsoventral direction. At each recording site, the multiunit responses were monitored on the oscilloscope and with an acoustic monitor while we varied the frequency and sound level for contralateral monaural stimulation by manually sweeping a mouse-driven cursor over a two-dimensional matrix in our custom software. This process quickly determines the point on the matrix with a response at the lowest sound level, and we defined the frequency of this point as BF and the level as the threshold. It is unlikely that experimenter expectations could have compromised the data obtained in these experiments, because the experiments were conducted by six different experimenters in the same and different animals. Furthermore, in selected cases, complete automatic multiunit FRAs were also recorded (see Fig. 2).
The BF distribution was analyzed as a function of depth along the electrode track using an automated Microsoft Excel spread sheet. The distance in micrometers and frequency change in octaves was calculated for any change in BF with respect to the previous BF recorded and for any change in BF >0.1 octaves.
Histological verification.
At the end of each experiment, electrolytic lesions (5 μA, 5 s) were made with the tungsten recording electrode, and the animal was given a lethal dose of sodium pentobarbitone (Nembutal) (for details, see Malmierca et al., 1993; LeBeau et al., 2001; Hernández et al., 2005). Animals were perfused intracardially with Ringer's solution, followed by fixative (1% paraformaldehyde and 1% glutaraldehyde in 0.1 m phosphate buffer, pH 7.4). The brains were immersed in a 30% sucrose solution for 2–3 d. Transverse sections (40 μm thick) were cut on a freezing microtome and stained with cresyl violet. The majority of units were localized within the CNIC.
3-D reconstructions of IC laminae.
In multiunit recording cases, we reconstructed eight electrode tracks with electrolytic lesions from two cases (cases 259 and 260) using Neurolucida (MicroBrightField, Colchester, VT). Recordings were done as described above, while the electrode was advanced along a track, with BFs being determined at 50 μm intervals. Then, while the electrode was retracted, the BFs were recorded again and lesions were made at selected frequencies. The lesions were ∼100 μm in diameter, so we used the center of the lesion as a reference. The laminae were visualized in 3-D after connecting lesions or points along the track with identical BFs.
Three-dimensional reconstructions of IC laminae were also made after injections of anatomical tracers in physiologically defined regions in the dorsal cochlear nucleus (DCN) in eight additional cases used previously (Oliver et al., 1997; Malmierca et al., 2002). These provided information on the relationship of the thickness of the axonal laminae in the IC to the size of the injection site in the DCN. These methods have been published previously and are summarized below. For these experiments, an areflexive, anesthetic state was induced by intramuscular administration of ketamine (57 mg/kg) and xylazine (8.6 mg/kg) and maintained with the same compounds. The acoustic and experimental systems were the same as described above. Extracellular recordings in response to acoustic stimulation allowed the determination of BF at the injection sites in the right DCN. Recordings were made with glass micropipettes (tips, 10–40 μm) filled with injection solutions for anterograde transport. The injection electrode contained either 10% tetramethylrhodamine dextran (TDR; D-1817; Invitrogen, Carlsbad, CA) dissolved in saline or a mixture of 10% biotinylated dextran amine (BDA; D-1956; Invitrogen) and 10% FITC–dextran (FD; D-1820; Invitrogen) in saline. Once the desired site was found, the dextrans were injected by iontophoresis (2–6 μA for 5–24 min). Seven to 10 d after the injections, the animals were perfused transcardially under deep surgical anesthesia to fix the brain tissue with a buffered washout solution (2% sucrose in 0.12 m phosphate buffer, pH 7.4, containing 0.05% lidocaine and 0.004% CaCl2) and then a buffered (0.12 m phosphate buffer, pH 7.4) 4% paraformaldehyde fixative solution. After fixation, decapitation, and dissection, the brain tissue was cryoprotected in 30% sucrose and sectioned in the transverse plane into 40-μm-thick slices on a freezing microtome. Adjacent sections underwent avidin–biotin complex histochemistry for BDA (black reaction), followed by immunohistochemistry with antisera to rhodamine, biotinylated secondary antisera, and avidin–biotin histochemistry (red reaction). Every third or fourth section was used for Nissl counterstain.
Data analysis.
Terminal fields in the IC were observed with a Leica DMRB microscope and digitized with Neurolucida software (MicroBrightField). Axonal laminae were measured in a random sample of sections that consisted of evenly spaced sections in each case (every third or fourth 40-μm-thick section). The labeled laminar axonal plexus was plotted in five to eight sections per case (Malmierca et al., 2005) with a Neurolucida system (MBF Bioscience, Burlington, VT). The width of the plexus in each section was defined as the narrowest dimension of the lamina, usually perpendicular to the long axis of the lamina that runs from ventrolateral to dorsomedial. Each plexus was measured at five to six sites in each section of the eight cases. Measurements are presented without correction for shrinkage. In a previous study (Malmierca et al., 1998), we found that histological processing resulted in up to 12% shrinkage.
Results
Mapping of tonotopic organization
To study the fine-grained tonotopic progression in the CNIC, we systematically mapped the BF of neuronal clusters along dorsoventrally oriented microelectrode penetrations. Recorded tracks had an average length of 2180 ± 460 μm (mean ± SD), which corresponds well with the dimensions of the IC in the rat (Faye-Lund and Osen, 1985; Malmierca, 2003). When multiunit clusters were mapped in steps of 100 μm, the BF increased monotonically and smoothly as a function of depth (Fig. 1). However, when the BF was recorded every 25–50 μm (Fig. 2), we found a distinct stair-step pattern in every penetration (n = 16 animals, 45 penetrations). In 12 penetrations, no clear tonotopic organization was found (Fig. 2C, black symbols) or the tonotopic progression was incomplete. Histological location of these tracks showed that they were outside the central nucleus. These penetrations were excluded from subsequent analysis.

BFs of multiunit clusters measured in 100–150 μm steps along the main dorsoventral axis of the inferior colliculus. Note that case 031 does not show a stepwise progression because the mapping resolution was >100 μm. BF is shown by the open circles and the left y-axis. The continuous line shows threshold measurements at the same location. Data were obtained from multiunit clusters.

A–C, BF of multiunit clusters measured in 25–50 μm steps along the main dorsoventral axis of the inferior colliculus in four tracks (B) and five tracks (A, C). All cases show a stepwise progression. C, Track 5 in case 143 was found outside the CNIC and shows no clear tonotopic organization. D, Details, in a logarithmic scale, of the low-frequency steps for four tracks from three animals. Data were obtained from multiunit clusters. TR, Track.
For the 33 penetrations that were considered complete and located within the central nucleus, we plotted BF versus recording depth. The frequency of these penetrations ranged from 0.5 to 40 kHz. Each showed a distinct staircase pattern (Fig. 2). The BF remained nearly constant (changing <0.1 octaves) for an average of 151 ± 41 μm (mean ± SD) and then jumped 0.34 ± 0.11 octaves (n = 460 steps). On average, there were 14 ± 3.7 steps per track.
At any one recording site, the BF remained virtually constant over time. We repeatedly recorded the FRA of a single unit three to seven times (n = 21) without moving the electrode to check the variability of the BF over 23–80 min. BF changed 0.006 ± 0.0002 octaves on average. This is 50 times smaller than the jump in frequency at a staircase step.
Along a step, the frequency changed little between recording sites. Figure 3 illustrates four representative steps and multiunit FRAs recorded every 50 μm along the track. The recordings were first made as the electrode moved downward along the track (Fig. 4A, circles) and were repeated as it was retracted from the IC (Fig. 3A, inverted triangles). At steps B–D, the BF changed from 0 to 0.05 octaves; however, at step A, the BFs changed 0.13 octaves. To take this variability into account, we set the threshold for our analysis of the step change in BF to be changes of 0.1 octaves or more.

A, A single electrode penetration downward (blue trace) and upward (red trace) along the same electrode track (Tr) in which we recorded FRA at every 50 μm. B, FRAs recorded at every 50 μm at four different steps (step A–step D) along the downward penetration through ICC. Data were obtained from multiunit clusters. D, Depth.

Examples of several electrode penetrations downward (circles) and upward (inverted triangles) along the same electrode track (Tr). Note that there is virtually no difference between the BF recorded downward and upward. Data were obtained from multiunit clusters.
Along a penetration, similar steps were obtained regardless of whether the recording electrode was being advanced into the IC or retracted as illustrated in Figures 3 and 4. The eight tracks in Figure 4 are from three different animals (circles show downward tracks, and inverted triangles show the corresponding upward tracks). A fourth animal is shown in Figure 3. The overlap of the symbols in Figures 3A and 4 show that the same frequency was recorded at the same depth in most cases, regardless of whether it was an upward or downward penetration.
We also performed a step analysis separately for the low- and high-frequency regions (multiunit clusters). In low-frequency regions (defined as <4 kHz, average of 2.05 kHz), the BF steps were on average 142 ± 69 μm thick. BF jumps were 0.27 ± 0.15 octaves, with 4.7 steps per track on average (n = 143). In high-frequency regions (defined as 8 kHz < BF < 35 kHz; average of 21.1 kHz), the BF steps were 140 ± 48 μm and jumped by 0.26 ± 0.06 octaves with an average of 7.4 steps per track (n = 236). When we compared low-frequency versus high-frequency regions, neither the thickness of the constant pattern nor the change in BF at the steps were significantly different (Mann–Whitney tests, p > 0.05). This finding suggests that the laminae are similar in thickness and in the frequency range represented regardless of their location within the central nucleus.
Single-unit frequency response areas
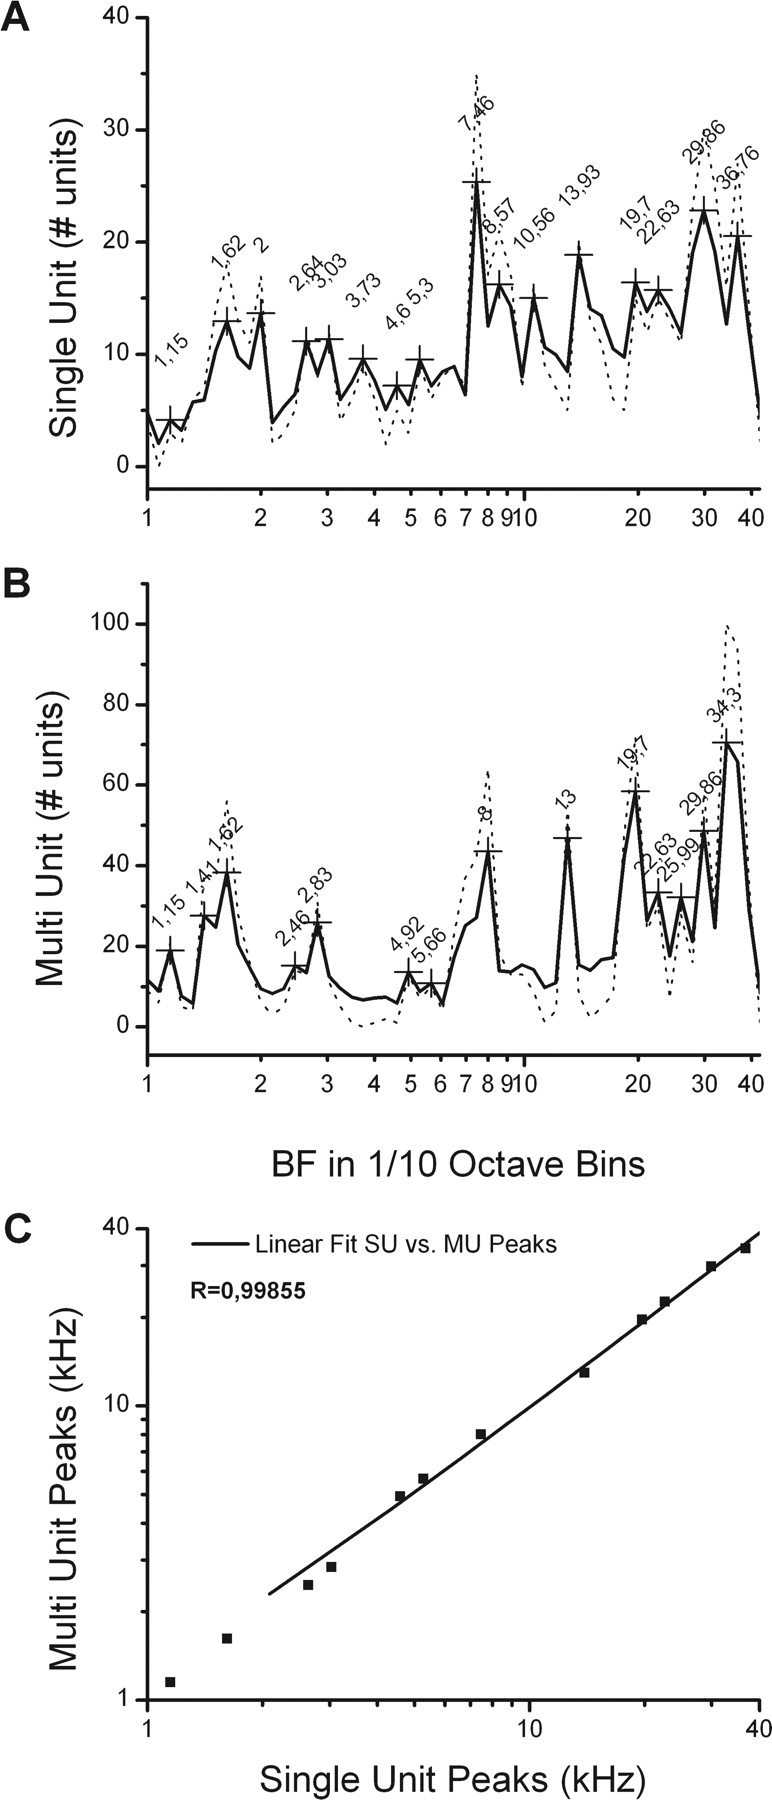
In a separate set of experiments, we collected 604 FRAs from well isolated single units using automated software and pseudorandom presentations of pure tones (Hernández et al., 2005; Pérez-González et al., 2006). The BFs and thresholds of the neurons in this sample cover the audible frequency range of the rat up to 40 kHz. Figure 5 illustrates a track through the center of the CNIC in which we recorded six FRAs. The BF of the individual FRAs increased with depth. When the BFs of all 604 units in this sample were pooled and displayed as a histogram with 0.1 octave bins, we observed a multimodal distribution with 16 peaks occurring at 0.32 ± 0.11 octave intervals (Fig. 6A). In the distribution of the multiunit recordings, 14 peaks match 12 of the single-unit peaks (Fig. 6B). The 12 matched peaks from these two independent datasets are strongly correlated (r = 0.99855) in a linear regression analysis (Fig. 6C). The combined sequence of peaks from the two distributions suggests that there are 18 peaks that occur at 0.29 ± 0.1 octave intervals. Thus, the two samples collected from the CNIC with very different methodologies suggest an increased representation of BFs at octave intervals of approximately one-third.

Six FRAs from single-unit recordings obtained from a single track through the CNIC. Note the increase of BF of the FRAs as a function of the depth in the CNIC.

Logarithmic histogram of the pooled BF data (discontinuous line) with fast Fourier transform smoothing (continuous line) in
 octave bins. A, BFs of single-unit sample show a multimodal distribution with 10–12 peaks occurring at 0.32 ± 0.11 octave intervals. B, BFs of multiunit clusters (n = 16) sample also show a multimodal distribution at 0.34 ± 0.11 and matches similar peaks (n = 14) seen in the distribution of the BFs of the single unit. C, The two independent datasets [single unit (SU) and multiunit (MU)] are strongly correlated (r = 0.99855).
3-D organization of the physiological and anatomical laminae
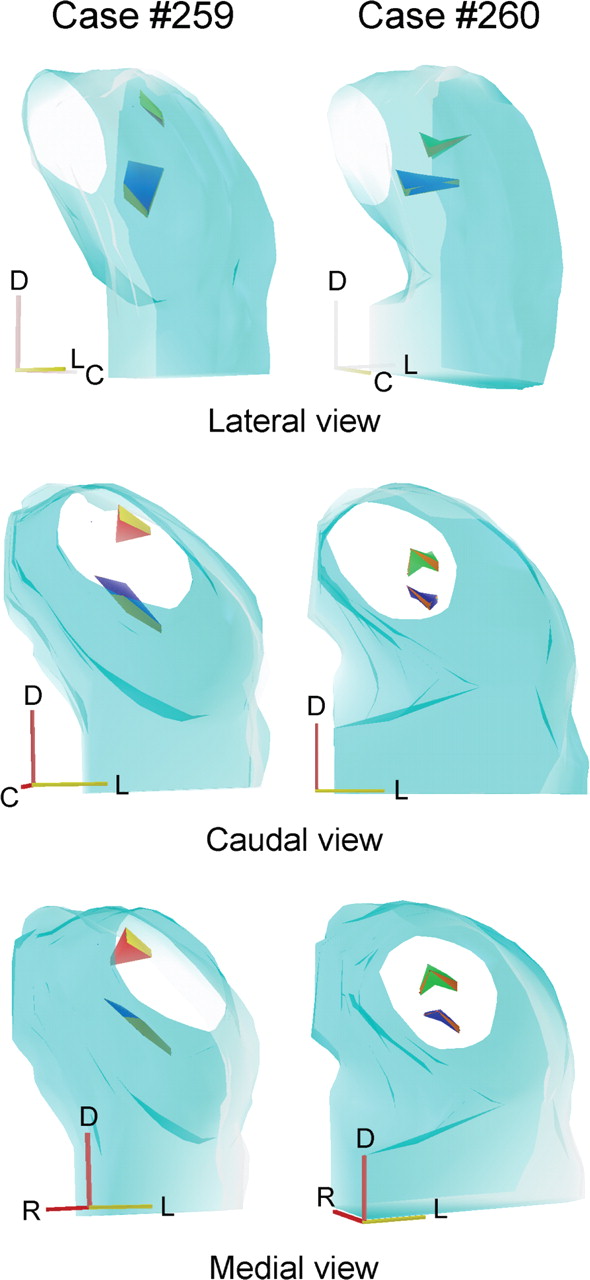
The orientation of the frequency-band laminae is shown in two of the cases (cases 259 and 260) used for multiunit mapping. After recording along four tracks, the locations with the same BFs were connected. Case 260 (Fig. 7, right column) shows isofrequency bands at 8 and 30 kHz, whereas case 259 (Fig. 7, left column) shows isofrequency bands at 3 and 30 kHz. In both, the 30 kHz laminae were more oblique to the frontal and sagittal planes and seen on edge from a caudal and medial view when rotated 26° from caudal. The lower-frequency laminae were oriented more in the horizontal plane and seen on edge for a lateral view rotated 60° from caudal.

3-D reconstructions to show the mutual relationship and orientation of the 3 kHz (red), 8 kHz (green), and 30 kHz (blue) laminae based on the tracks and lesions (dots) shown on the corresponding cases. Each lamina was reconstructed from four lesions equally spaced. R, Rostral; D, dorsal; L, lateral, C; caudal.
For comparison, we examined the axonal lamina in CNIC that resulted from injections of anatomical tracers in the DCN. Two adjacent laminae are seen in the CNIC (Fig. 8A) after injections in DCN at 1.7 kHz using TDR (red) and at 1.8 kHz using FD-BDA (black) (Fig. 8A, inset). A second case (Fig. 8B) shows two different laminae, in which the injections in DCN were 3 octaves apart (6.3 and 29 kHz). A 3-D reconstruction (Fig. 8C) shows the full extent of three axonal laminae in the CNIC at 1.7, 1.8 (same as Fig. 8A), and 4.5 kHz and their relationship to the angle of the recording electrode in the tonotopic mapping experiments, nearly orthogonal to the laminae. The higher-frequency laminae are somewhat more oblique to the angle of the electrode than the lower-frequency ones. The orientation of these anatomical laminae is similar to the segments of the frequency-band laminae shown in Figure 7.

A, Axonal laminae in IC (case 121) after two injections in DCN (see inset in A at the bottom of the IC with injection sites) at 1.7 and 1.8 kHz (BDA, black–yellow arrow; TDR, red arrow). Arrows indicate injection in DCN. Note, BDA labeled two laminae. B, Case 231 shows widely spaced laminae (3 octaves) in IC from a BDA (black axons) injection in DCN at 6.3 kHz and a TDR (red axons) injection at 29 kHz in DCN. C, 3-D reconstruction of IC shows the full extent of the axonal bands in the CNIC and their relationship to the angle of the recording electrode. Note that higher-frequency laminae are more oblique to the angle of the electrode. Laminae after 4.5 and 1.8–1.7 kHz injections. Case 117 (green lamina, 4.5); case 121 (red and yellow laminae, 1.7–1.8). D, The size of the band of axons is related to the size of the injection site, and the mean width of the lamina is ∼100 μm in diameter. D, Dorsal; L; lateral; M, medial.
We estimated the minimum cross-sectional diameter of the anatomical laminae in eight cases in which tracers had been injected into the DCN. To do this, we had to take into account the size of the injection site. Larger injections result in more extensive labeling in CNIC presumably because multiple laminae are labeled. The relationship between the thickness of the axonal laminae and the size of the injection site in DCN was estimated as shown in Figure 8D. The injection size was measured using the outer diameter of the center and the outer perimeter of the injection site. The cross-sectional diameter was measured at multiple sites in each section as published previously (Malmierca et al., 2005). This diameter is perpendicular to the longest axis of the laminae running ventrolateral to dorsomedial in the sections. The relationship between injection size and laminar width is described by a sigmoidal function (Fig. 8D) that is similar regardless of whether the center or the outer diameter of the injection is used. In either case, these data suggest that the minimum thickness of the axonal laminae approaches 100 μm after the smallest injections.
The thinnest axonal laminae are presumed to represent single fibrodendritic laminae. Seven axonal laminae from the four cases with the thinnest laminae have a mean diameter of 104 ± 21 μm (Table 1). In one case, the two laminae in the low-frequency CNIC were narrower, 55–84 μm in diameter, but most laminae ranged from 100 to 134 μm in diameter. After an adjustment for 10–12% shrinkage during histology, these measurements match the 140–150 μm mean step size, resulting in a stair-step jump in BF during multiunit mapping.
Summary of laminar measurements in four cases after seven injections in cochlear nucleus
Discussion
The present study shows a discontinuous tonotopic organization in the CNIC. Multiunit mapping reveals that the rat IC possesses a distinct stepwise organization in the order in frequency representation. Data from single units reinforces the idea that the BFs of neurons in the IC are distributed in a discontinuous manner. Together, both types of data argue against the general view that the tonotopic organization in the CNIC forms a continuous frequency gradient. Rather, it seems that there is a defined space of collicular tissue devoted to a given frequency bandwidth.
A key methodological issue is whether or not the stepwise progression of BF that we observed could be an artifact of methodology. We think not because it was observed in all penetrations through the CNIC with electrode steps as small as 25 μm and regardless of whether the recordings were performed while advancing the electrode downward or upward along the same track (Figs. 3, 4). Electrode steps of 50 μm or less were necessary to observe the stepwise organization because the changes in frequency occurred at ∼150 μm. Previous studies (Rose et al., 1966; Clopton and Winfield, 1973; Merzenich and Reid, 1974) used larger steps in their electrode mapping and thus are likely to have sampled across the stepwise organization. Another important question is whether or not the recorded BF remains constant over time for both single-unit and multiunit recordings. We recorded up to 21 different single-unit FRAs repeatedly (three to seven repeated FRAs) to check the variability of their BF over time for 23 min up to 80 min. We found that BF remains virtually constant, changing on average 0.006 octaves (i.e., 50 times smaller than the jumps of BF, 0.34), with a variance of 0.0002.
Our observations are based on two independent datasets that yielded very similar results, one from multiunit mapping and the other from single units. The multiunit mapping of the tonotopic organization was specifically collected for this study, but the single-unit data were collected in previous experiments with different aims unrelated to tonotopic organization (Hernández et al., 2005; Pérez-González et al., 2005, 2006). Moreover, the single-unit data were collected in two different laboratories with different sound equipment and loudspeakers. The finding of stepwise tonotopic organization using different methods suggests a robust organizational principle.
Previous tonotopic mapping studies
A single previous study with multiunit recordings has shown a similar stepwise tonotopic organization in the CNIC of the cat (Schreiner and Langner, 1997). They demonstrated that frequency organization is characterized by constant-frequency ratios (on average, 0.278 octaves per frequency step) corresponding to a spatial distance of 175 μm within the IC. These steps were larger than those found in the present study of the rat, and the size differences may be related to species differences and the larger brain of the cat.
Tonotopic maps are found throughout the auditory system from cochlear nucleus to auditory cortex (Ryan et al., 1988; Kaltenbach and Lazor, 1991; Friauf, 1992; Spirou et al., 1993; Malmierca et al., 1998; Bajo et al., 1999; Doron et al., 2002). Some appear to be continuous, whereas others are stepwise. For example, in the dorsal cochlear nucleus of the cat, Spirou et al. (1993) found a continuous tonotopic progression despite the complex FRAs with multiple, discontinuous islands of excitation surrounded by inhibition (Young and Voigt, 1982; Young, 2008). In contrast, Cetas et al. (2001) reported a distinct stepwise progression in the tonotopic organization of the ventral division of the auditory thalamus (MGV) in the rabbit.
In most studies of single units, it is not clear whether there is a discontinuous distribution of best frequency. To determine whether the BFs of single units in the primary auditory cortex of the rat follow a stepwise progression, we analyzed the BF of 198 cortical single units from a previous study (Doron et al., 2002, their Fig. 2) using the same approach that we used for our 604 IC single units. The cortical units showed a similar multipeaked distribution (Fig. 9B), with the peaks occurring at 0.31 ± 0.10 octave intervals. The frequency distribution in the cortex is very similar to that of the distribution in the IC (Fig. 9B) (r = 0.99841). These findings suggest that there is a discontinuous tonotopic organization that begins in the IC and continues through the cortex.

BFs of single-unit sample from auditory cortex. A, Logarithmic histogram of the pooled BF data (discontinuous line) from rat auditory cortex [Doron et al. (2002), their Fig. 2] shows a multimodal distribution with 10–12 peaks occurring at 0.31 ± 0.10 octave intervals. Fast Fourier transform smoothing (continuous line) in
 octave bins. B, BFs of single-unit data from the CNIC and AC matches similar single-unit peak sets are strongly correlated (r = 0.99841). SU, Single unit; AI, primary auditory cortex.
Relationship of tonotopic organization to anatomy
There may be a relationship between tonotopic organization and dendritic morphology. Cetas et al. (2001) found a distinct stepwise progression in the tonotopic organization of the MGV in the rabbit. The steps in the rabbit MGV (∼1 octave) were larger than those reported in the IC of the cat [∼0.28 octaves (Schreiner and Langner, 1997)] or rat [∼ 0.29 octaves (present data)]. Besides possible species differences, this discrepancy might be attributable to different organizations in MGV and IC. A comparison of dendritic fields suggests that the larger step size is positively correlated with a larger dendritic field width (Cetas et al., 2003).
Previous anatomical studies in the rat have shown that high-frequency laminae in IC contain flat disk-shaped neurons separated by interlaminar compartments made of less flat neurons (Malmierca et al., 1993, 1995). The intralaminar compartments are absent in the low-frequency region. Our data in the rat show that the axonal laminar thickness and the frequency step changes are similar across frequency (140–150 μm). The dendritic arbors of flat cells are ∼50 μm thick and less flat cells are ∼100 μm thick on average (Malmierca et al., 1993, 1995), suggesting that two to three flat neurons organized side-by-side may form a functional unit in low-frequency regions (Fig. 8) (Malmierca et al., 2005). At the high-frequency region, a lamina might include a flat neuron and a less flat neuron side-by-side (Malmierca et al., 1993, 1995).
Functional significance
How does the discontinuous distribution of the single-unit data relate to the physical–anatomical laminae? The data in the IC and cortex suggest groupings of neurons in units of ∼0.3 octaves. At the IC level, best frequencies may be organized as partially overlapping bandpass filters with a center-to-center separation of one-third octave. Thus, near threshold, frequencies at the center of the filters are favored over those at the overlapping regions, and it results in the multi-modal, saw-toothed pattern of frequency distribution. These midbrain bandpass filters have broader bandwidth than those conceived at the periphery to model the output of the cochlea (Moore, 1986; Moore et al., 1999; Moore and Glasberg, 2007). The auditory filters are usually estimated to be 10–17% of the center frequency in human studies, a bandwidth of 0.14–0.23 octaves. If the auditory filters in the rat are similar, the midbrain filters may be approximately double those at the periphery.
Critical band filters have been postulated to originate at the midbrain level (Ehret and Merzenich, 1985; Ehret and Merzenich, 1988; Ehret and Schreiner, 2005) in which inhibitory processing produces level-tolerant neurons (narrow FRA types) (LeBeau et al., 2001; Hernández et al., 2005). Schreiner and Langner (1997) suggested that the IC consists of a stack of 30–40 critical bands, each equal in size to the frequency-band laminae defined by the changing steps in the tonotopic map. The number of critical bands in the rat is not known, but a rough estimate can be based on two assumptions: (1) the basilar membranes of mammals are scale models of each other and critical bands cover equal distances on the basilar membrane (Greenwood, 1990); and (2) one critical band is thought to cover ∼1 mm (0.7–1.3 mm) on the basilar membrane. Based on the 8 mm length of the rat's basilar membrane, rats have ∼8–12 critical bands (Ehret and Schreiner, 2005). Interestingly, our data in the IC suggest that there may be 8–12 laminae, each covering 0.29–0.36 octaves. This separation is similar to critical bands of 0.333–0.375 octaves suggested for the mouse (Egorova et al., 2006). Moreover, this grouping is also compatible with studies on the frequency separation needed to activate independent neuronal populations in the IC (Yang et al., 2003, 2004; Oliver, 2005). Two pure tones 0.5 octaves apart activate two laminae in the IC, whereas tones 0.25 octaves apart activate a single lamina.
Thus, our anatomical and physiological data suggest that the tonotopic map in the CNIC in the rat is composed of discrete physiological laminae that correspond to the anatomical fibrodendritic laminae of the CNIC. The groupings of neurons with ∼0.3 octaves separation represent separate arrays of neurons with a discontinuous frequency representation near threshold. Such a discontinuous frequency representation has interesting functional implications for hearing because it implies unequal thresholds for closely adjacent frequencies.
Footnotes
-
This work was supported by Spanish Ministerio de Educación y Ciencia (MEC) Grant BFU2006-00572 and Junta de Castilla y León (JCYL) Grant SA 007C05 (M.S.M.), MEC Grant SAB2004-0076 (M.S.M., D.L.O.), and National Institutes of Health Grants R01 DC00189 (D.L.O.) and DC-00607 and DC-00287 (E.C.). O.H. was supported by MEC Postdoctoral Contract BFU2006-00572. M.A.I. was supported by a JCYL fellowship and S.C. by MEC Fellowship AP2005-5166. We thank Dr. Mal Semple for sharing his single-unit data from the auditory cortex in the study by Doron et al. (2002). We also thank three anonymous reviewers and Drs. Shig Kuwada, Alan Palmer, and Adrian Rees for their critical comments and suggestions on a previous version of this manuscript.
- Correspondence should be addressed to Dr. Manuel S. Malmierca, Auditory Neurophysiology Unit, Laboratory for the Neurobiology of Hearing, Faculty of Medicine, University of Salamanca, Campus Miguel Unamuno, Alfonso X el Sabio s/n, 37007 Salamanca, Spain. msm{at}usal.es


