

Article Figures & Data
Figures
- Figure 1.
Exaggerated beta oscillations are present in the cortex and subthalamic nucleus of 6-OHDA-lesioned anesthetized rats. A, Frontal ECoGs and time-evolving power spectrogram of ECoG activity. Exaggerated beta oscillations emerge during spontaneous activation (2) but not SWA (1). Calibration: 0.2 mV, 500 ms. a.u., Arbitrary units. B, Spectrograms of simultaneously recorded activity in cortex (ECoG) and subthalamic nucleus (STN-LFP) during spontaneous activation. Weak power at 50 Hz is line noise. C, Power spectra (Power) of ECoGs, as well as LFPs simultaneously recorded from within, immediately above and below the STN, in a representative lesioned and control animal during activation. Gray boxes indicate the classic beta band (15–30 Hz). D, E, Beta oscillations are evident in the discharges of single STN units, as shown in autocorrelograms (AC) and periodograms (Lomb). The dashed line in periodogram indicates p = 0.05. STN neurons fire either spike bursts or single spikes in time with most (but not all; arrowhead in E) beta cycles in oscillatory LFPs, as shown in spike-triggered LFP averages (STAv). Power spectra of ECoG and STN-LFP simultaneously recorded with neuron in D are also shown. Calibration: D, 0.2 mV (ECoG), 0.5 mV (unit), 0.1 mV (LFP), 100 ms; E, 0.125 mV, 100 ms. F, Beta oscillations are also reflected in rhythmic multiunit activity in STN (contacts 2–4), but not immediately above or below (contacts 1 and 5). Traces 1–5 of units and LFPs were recorded simultaneously. Calibration: 0.1 mV, 100 ms. G, Plot of STN neurons with significant oscillations in their spike trains (those recorded with silicon probes or glass electrodes are represented by diamonds and circles, respectively). H, Coherence (left) and total beta coherence at 17–23 Hz (right) between single units and LFPs in the STN as recorded with probes (n = 14 and 8 unit/LFP pairs in lesioned and control, respectively). The dashed line is the 95% confidence limit. Data are means ±1 SEM. *p = 0.005. I, Mean firing rates of STN neurons during activated brain state. Data are means ±1 SEM. *p < 0.001. Data in A–F are from different lesioned animals.
- Figure 2.
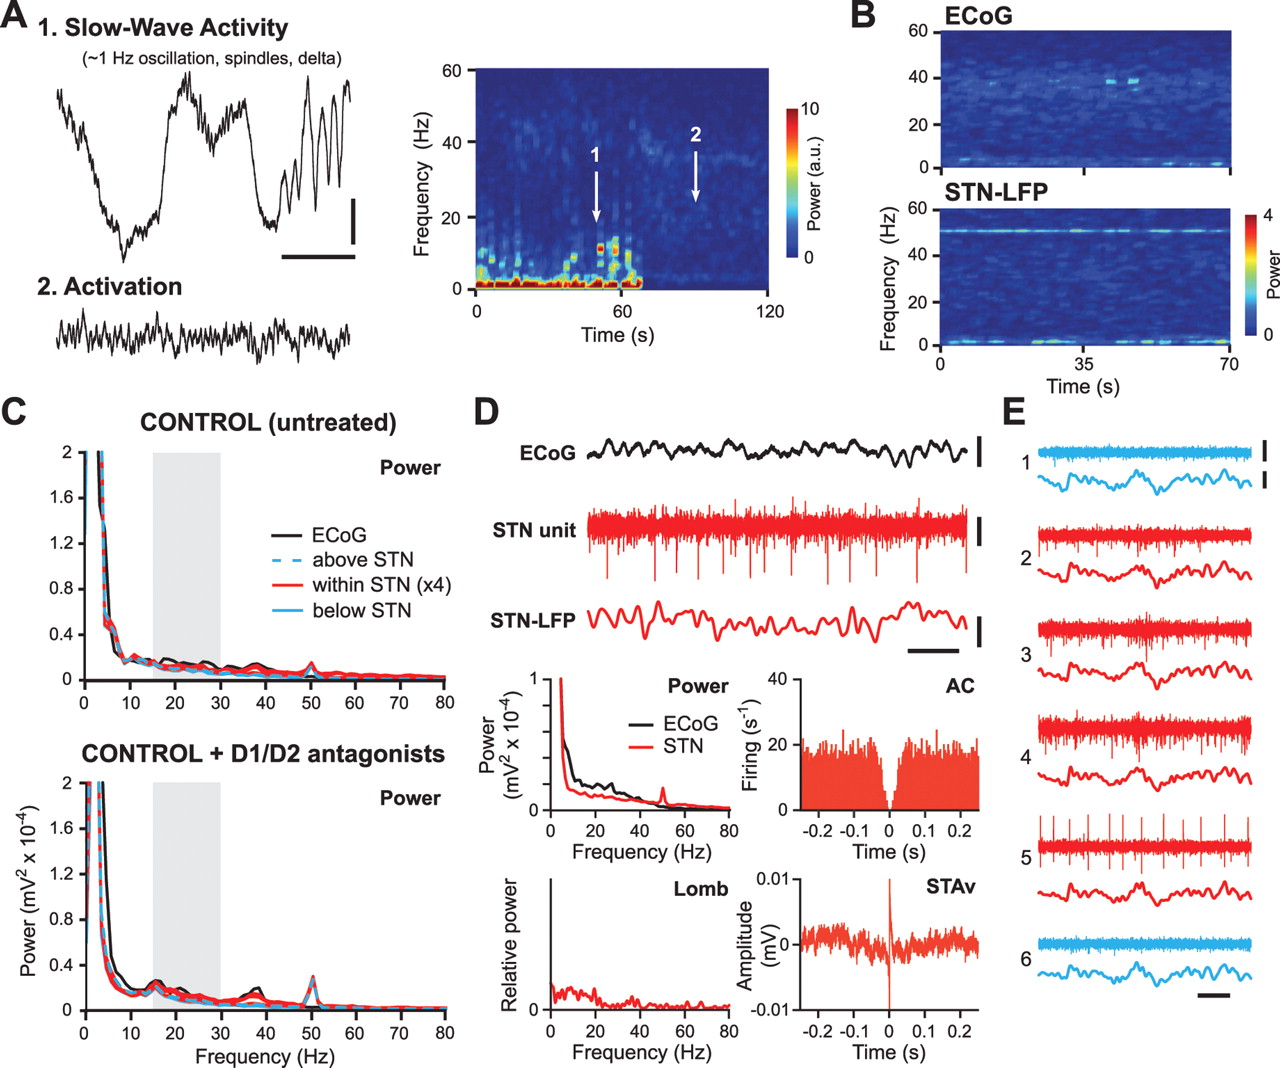
Beta oscillations are not prevalent in the cortex and subthalamic nucleus of dopamine-intact anesthetized rats. A, Frontal ECoGs and time-evolving power spectrogram of ECoG activity in a control animal. Neither global activation (2) nor SWA (1) brain states were associated with prominent beta oscillations. B, Spectrograms of simultaneously recorded activity in the cortex (ECoG) and subthalamic nucleus (STN-LFP) during spontaneous activation. Weak power at 50 Hz is line noise. C, Power spectra (Power) of ECoGs as well as LFPs simultaneously recorded from within, immediately above, and below STN, in a representative control animal before and after systemic treatment with D1 and D2 receptor antagonists (SCH-23390 at 0.5 mg/kg and raclopride at 2 mg/kg). Gray boxes indicate the classic beta band (15–30 Hz). D, During activation in control animals, the discharges of single STN units were not clearly periodic, as shown by flat autocorrelograms (AC) and periodograms (Lomb). Spike-triggered LFP averages (STAv) were correspondingly flat. The power spectra of ECoG and STN-LFP simultaneously recorded with the neuron in D are also shown. E, Simultaneous recordings of multiunit activity and LFPs in the STN (contacts 2–5), as well as immediately above and below the STN (contacts 1 and 6, respectively) of a control rat. Calibrations are the same as in Figure 1, except in D: 0.1 mV (unit).
- Figure 3.
Temporal coupling and mutual information of multiunit activities in the subthalamic nucleus increase after 6-OHDA lesions. A, Average coherence spectra of STN multiunit activities recorded in untreated control animals (n = 21 contact pairs), controls after acute antagonist treatment (n = 21 contact pairs, “treated controls”), and chronically lesioned animals (n = 23 contact pairs). The gray box indicates the beta band (17–23 Hz) used in quantitative analyses. B, Average coherence of STN activities at beta frequencies (17–23 Hz) across experimental groups. Data are means ±1 SEM. *p < 0.05. C, Mutual information between sites within the STN. Data are means ±1 SEM. *p < 0.05.
- Figure 4.
Chronic 6-OHDA lesions, but not acute antagonist treatment, exaggerate beta oscillations in the subthalamic nucleus. A, Average power spectra of STN-LFPs recorded in untreated control animals (n = 8), controls after acute antagonist treatment (n = 8, “treated controls”), and chronically lesioned animals (n = 9) during the activated brain state. The gray boxes indicate the peak beta band (17–23 Hz) used in quantitative analyses in C and D. Spectral power at ∼50 Hz (line noise) was removed for clarity. a.u., Arbitrary units. B, Average power spectra of STN-LFPs recorded in the same animals during slow-wave activity. There are no distinct peaks in power at beta frequencies. C, D, Average log power of peak beta oscillations (17–23 Hz) in STN-LFPs across experimental groups and brain states. Power values in A and B were normalized by logarithmic transformation before statistical testing. Data are means ±1 SEM. *p < 0.01. Note the small error bars (SEM) indicating limited variability between beta oscillations in different animals.
- Figure 5.
Chronic 6-OHDA lesions, but not acute antagonist treatment, exaggerate beta oscillations in the cerebral cortex. A, Average power spectra of ECoGs recorded in untreated control animals (n = 8), controls after acute antagonist treatment (n = 8, “treated controls”), and chronically lesioned animals (n = 9) during the activated brain state. The gray boxes indicate the peak beta band (17–23 Hz) used in quantitative analyses in C and D. Spectral power at ∼50 Hz (line noise) was removed for clarity. a.u., Arbitrary units. B, Average power spectra of ECoGs recorded in same animals during slow-wave activity. C, D, Average log power of peak beta oscillations (17–23 Hz) in ECoGs across experimental groups and brain states. The power values in A and B were normalized by logarithmic transformation before statistical testing. Data are means ±1 SEM. *p < 0.01. Note the small error bars (SEM) indicating limited variability between beta oscillations in different animals.
- Figure 6.
Cortical beta oscillations are not augmented by acute antagonist treatments in behaving control animals, and pathological beta oscillations are delayed after 6-OHDA injections in lesioned animals. A, Right frontal ECoGs recorded in a representative dopamine-intact rat before (control) and after systemic administration of vehicle (saline) or a combination of selective D1 and D2 receptor antagonists (SCH-23390 at 0.5 mg/kg and raclopride at 2 mg/kg). Recording times after injections are indicated. Calibration: 0.5 mV, 250 ms. B, Power spectra of ECoGs recorded from the single animal in A, and average power spectra for the group of dopamine-intact rats (n = 5). Recording times after injections are indicated in parentheses (in minutes). The gray boxes and dashed lines indicate the peak beta band (22–28 Hz) and wider beta band (19–31 Hz), respectively, as used in quantitative analyses in C and D. Note that antagonist treatment did not augment beta oscillations. C, Total power of peak beta oscillations (22–28 Hz, gray) and wider beta oscillations (19–31 Hz, black) averaged across all dopamine-intact rats and treatments. Data are means ±1 SEM. Animals were fully cataleptic 10–15 min after administration of D1/D2 antagonists. D, Left, Average power spectra of ECoGs recorded ipsilateral to 6-OHDA lesions in behaving rats (n = 5) on postoperative days 1, 4, and 15. Right, Comparison of peak beta power (22–28 Hz) in ECoGs recorded from lesioned, behaving rats. Data are medians (black lines) and 25th/75th percentiles (boxes). *p < 0.05. E, Peak beta power (22–28 Hz) in ECoGs recorded from control behaving rats.


Additional Files
Supplemental Data
Files in this Data Supplement:
- supplemental material - Supplemental Material
- supplemental material - Supplemental Figure


