

Article Figures & Data
Figures
- Figure 1.
Identification of three RGC types in adult RD retina (mean age ± SD, P44 ± 4). A, Cross sections of fixed tissue show gross structural differences of WT and RD retinas. Note the lack of outer plexiform layer (OPL), outer nuclear layer (ONL), and photoreceptor outer segments (OS) in RD retina. GCL, Ganglion cell layer; INL, inner nuclear layer. B, Two-photon z-projections (larger top images) and side projections (below) of three identified types of WT (left) and RD (right) RGCs. Cells were filled with 125 μm OGB-1 during patch-clamp recordings. C, Dendritic stratification within the IPL for populations of ON (n = 7 WT, 9 RD), OFF-T (n = 12 WT, 12 RD), and OFF-S (n = 5 WT, 6 RD) RGCs from WT (filled symbols) and RD (open symbols) retina. See Results for statistical comparisons. The WT data in C is from Margolis and Detwiler (2007). Scale bars, 50 μm. Error bars indicate SEM.
- Figure 2.
Rhythmic resting spike activity in identified RD RGCs. A, Whole-cell current-clamp recordings from ON, OFF-T, and OFF-S RGCs in RD retina. B, Activity on an expanded time scale. Note the underlying oscillatory membrane depolarizations present in RD (left, black) but not WT (right, gray) cells. C, Interspike interval histograms from cells in B. Solid line, RD; dotted line, WT. Insets show the power spectra for RD RGCs (same cells as in B). Note the clear presence of peak frequencies at 12–14 Hz in these cells.
- Figure 3.
Rhythmic resting synaptic currents in identified RD RGCs. A, Whole-cell voltage-clamp recordings of resting synaptic currents in ON, OFF-T, and OFF-S RGCs from WT (left, gray) and RD (right, black) retinas (Vhold = −70 mV). B, Currents on an expanded time scale. Note the strong periodicity in RD currents from all three cell types and different dynamics of currents in ON and OFF cells. C, Power spectra of RD (black) and WT (gray) currents (the same cells as in B). The multiple peaks in RD spectra reflect harmonics of the fundamental beating frequency of ∼10 Hz.
- Figure 4.
Correlation between spiking and synaptic currents in individual RD RGCs. A, Whole-cell voltage-clamp (top; Vhold = −70 mV) and current-clamp (bottom) recordings from individual ON (above) and OFF-T (below) cells. B, Power spectra of current (dotted line) and voltage (solid line) from the cells in A. The inset shows Gaussian fits to spectra in the range of 3–20 Hz. C, Correlation of peak frequencies of spiking and synaptic currents in individual cells (n = 18), as measured from power spectra.
- Figure 5.
Distinct balance of excitatory and inhibitory synaptic currents in ON and OFF RD RGCs. A, Comparison of excitatory (Vhold = −70 mV; black, bottom traces) and inhibitory (Vhold = 0 mV; gray, top traces) synaptic currents from individual cells. B, Power spectra of excitatory (solid line) and inhibitory (dotted line) currents from the cells in A. C, Top, Correlation between frequency of inhibitory and excitatory currents from individual ON, OFF-T, and OFF-S cells (n = 12). Frequency measured from power spectra as in Figure 4. Bottom, Ratio of inhibitory to excitatory power for ON, OFF-T, and OFF-S cells. Note that the ratio is low for ON cells and high for OFF cells, reflecting a distinct balance of excitatory and inhibitory synaptic currents. Recordings were made with CsMeSO4 internal solution (see Materials and Methods). Error bars indicate SEM.
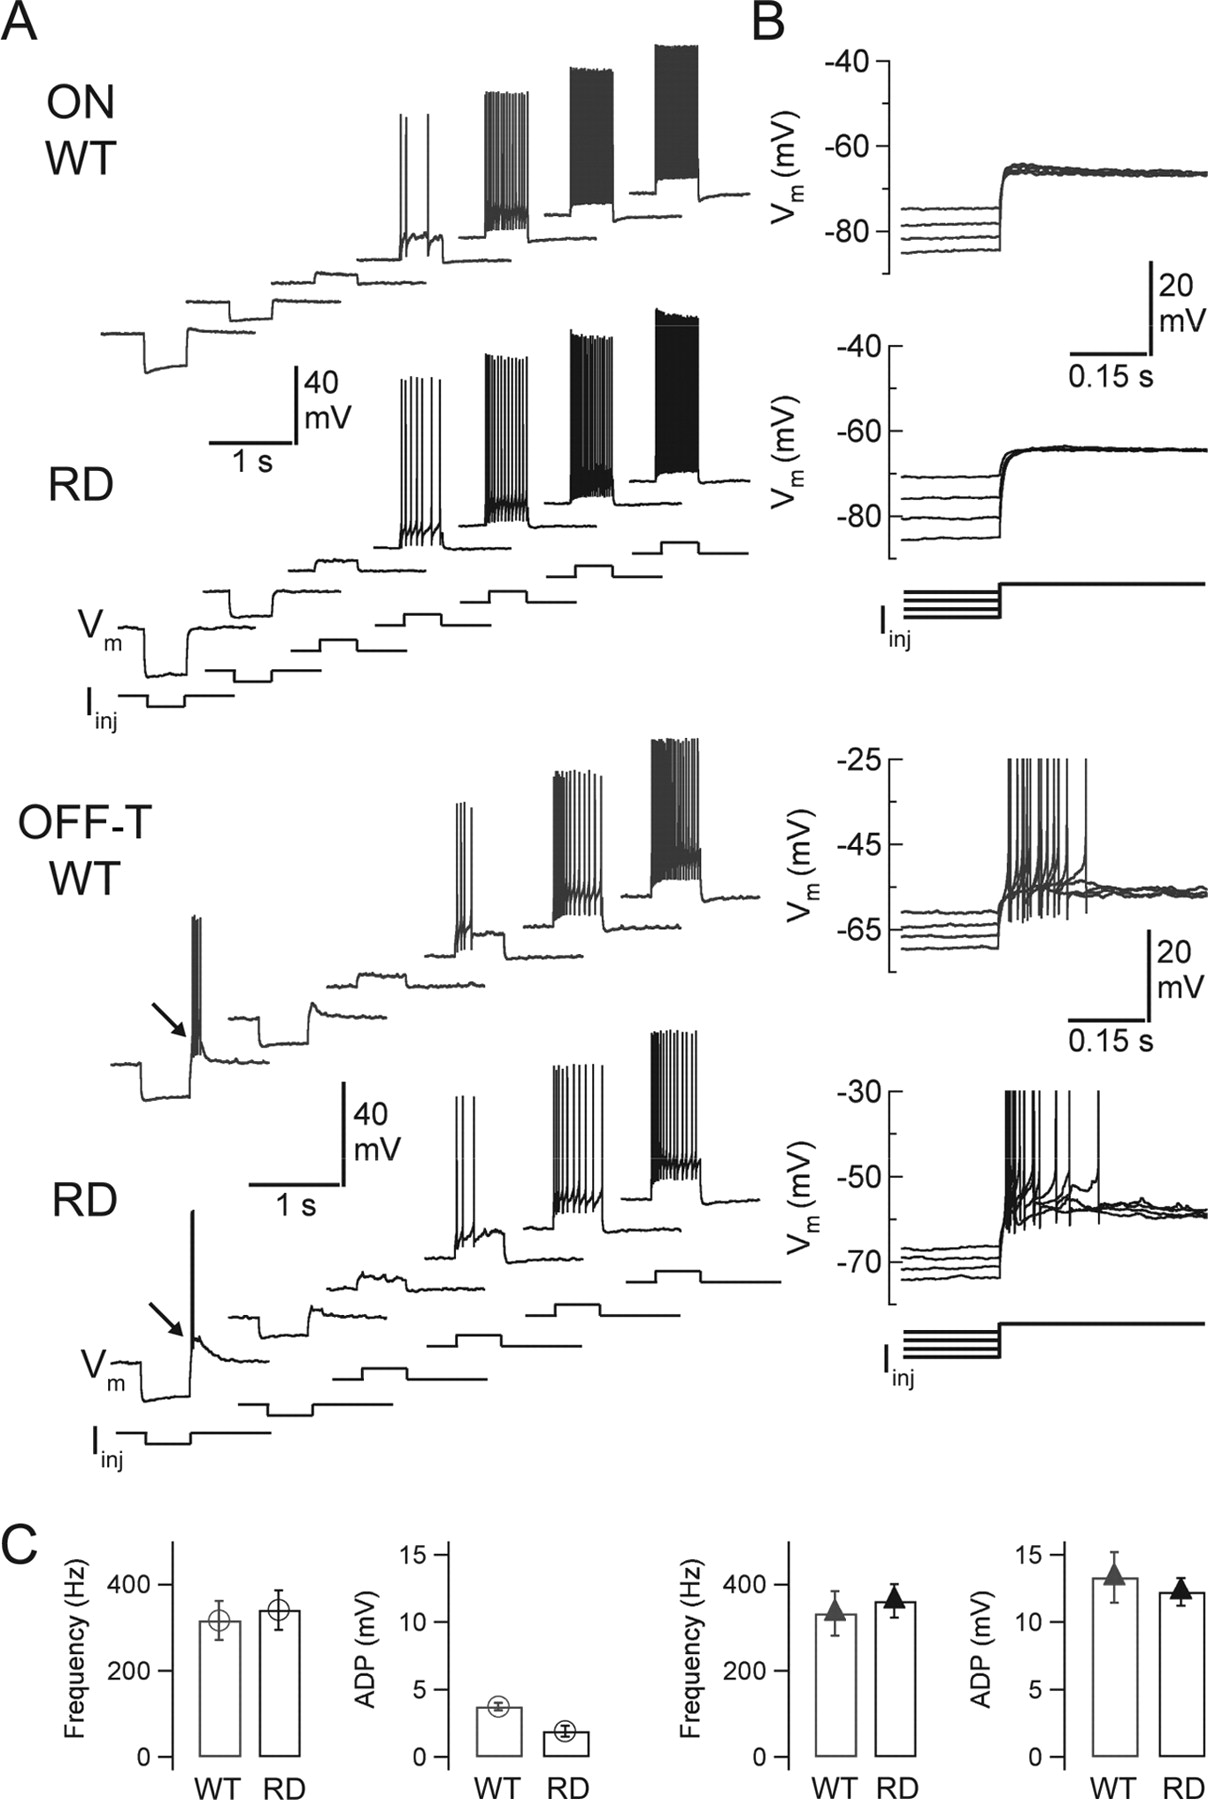
- Figure 6.
Similarity of intrinsic electrical properties in WT and RD RGCs. A, Voltage (Vm) responses to injected current (Iinj) for ON (top) and OFF-T (bottom) cells recorded in whole-cell current-clamp mode in the presence of synaptic blockers (in μm: 50 l-APB, 20 CNQX, 50 APV, 1 strychnine, and 50 picrotoxin). Arrows indicate presence of rebound firing in both WT and RD OFF-T cells. B, Four superimposed responses to negative current injection. The strength of the responses is proportional to the level of hyperpolarization. C, Average maximum firing frequency and ADP strength for ON (left; n = 6 and 3) and OFF-T cells (right; n = 5 and 4, respectively).
- Figure 7.
Similarity of spike- and rebound-evoked Ca2+ signals in WT and RD RGCs. A, Ca2+ signals (Ca2+) recorded from proximal dendrites during voltage responses (Vm) to injected current (Iinj) in ON WT (top) and RD (bottom) RGCs. B, Same as A for OFF-T RGCs. Recordings were made in whole-cell current clamp in the presence of synaptic blockers (in μm: 50 l-APB, 20 CNQX, 50 APV, 1 strychnine, and 50 picrotoxin). Arrows indicate the presence of rebound firing. C, Mean Ca2+ signal amplitude per spike (ΔF/F per spike) for ON (top; WT, n = 4; RD, n = 3) and OFF-T (bottom; WT, n = 4[5]; RD, n = 3) RGCs. Note that WT and RD cells display similar Ca2+ signaling profiles for both spiking and rebound firing. Error bars indicate SEM.
- Figure 8.
Calcium dynamics during resting activity in RD RGCs. A, Simultaneously recorded calcium indicator fluorescence (Ca2+, red) and membrane potential (Vm, black) from cells show at left. Red boxes on proximal dendrites indicate scanned regions. B, Ca2+ signals (red) and spike rate (black; bin width, 150 ms) during resting activity [injected current (Iinj) = 0] from two different cells than in A. Note the longer time scale. In the ON cell (left), Iinj reduced spike rate and resting Ca2+. Baseline membrane potentials for the ON cell at rest (during pulse) were −71, −70 (−94), and −70 (−108) mV for top, middle, and bottom panels, respectively. Baseline membrane potentials for the OFF-T cell at rest during pulse were −70, −70 (−87), −70 (−95) mV for top, middle, and bottom panels, respectively. C, Blow-ups of regions corresponding to bars in B (middle, ∼t = 9 s for ON cell; bottom, ∼t = 7 s for OFF-T cell). Note that both spikes and subthreshold regenerative-like events are associated with Ca2+ signals during hyperpolarization in OFF-T cell (arrows). The bottom right plot shows rebound-evoked Ca2+ signal during resting activity (Iinj = −400 pA for 0.5 s). The superimposed gray trace is the mean of three responses to −550, −400, and −300 pA. The hyperpolarizing portion of the mean response is shown in the inset on the right to emphasize Ca2+ decrease. Scale bars: A, 25 μm; C, inset, 10% ΔF/F.


Tables
- Table 1.
Properties of resting spiking and synaptic currents in identified ganglion cell types in RD retina
Spike rate (Hz) CV of ISI Fund. freq. (Hz) Peak EPSC (pA) ON 22.0 ± 4.6 (11) 1.2 ± 0.1 (11) 9.2 ± 0.7 (13) −294 ± 53 (11) OFF-T 25.1 ± 6.6 (10) 1.1 ± 0.2 (10) 8.9 ± 0.8 (15) −189 ± 42 (10) OFF-S 32.7 ± 7.0 (4) 1.1 ± 0.1 (4) 8.5 ± 1.0 (7) −137 ± 34 (5) -
Data are shown as mean ± SEM. The number of cells (n) is shown in parentheses. ISI, Interspike interval; Fund. freq., fundamental frequency. Vhold = −70 mV.
-
Supplemental Data
Files in this Data Supplement:
- supplemental material - Supplemental material


