

Article Figures & Data
Figures
- Figure 1.
Active Akt is overexpressed in oligodendrocytes in Plp-Akt-DD mice. A, Cerebrum samples from littermate WT and Plp-Akt-DD9 mice were analyzed for Akt expression by Western blot at P10, P14, P21, and P30, and a representative blot is presented. The number of pairs of animals analyzed at each age varied from 5 to 21. B, Akt was overexpressed in oligodendrocytes of Plp-Akt-DD9 mice (DD) as shown by representative immunostained sections for Akt at P14, P21, and P30. The number of pairs of animals analyzed at each age varied from 6 to 32. Scale bars, 200 μm. C, Akt kinase assay (using GSK-3 as substrate) was used to confirm that the overexpressed Akt was active.
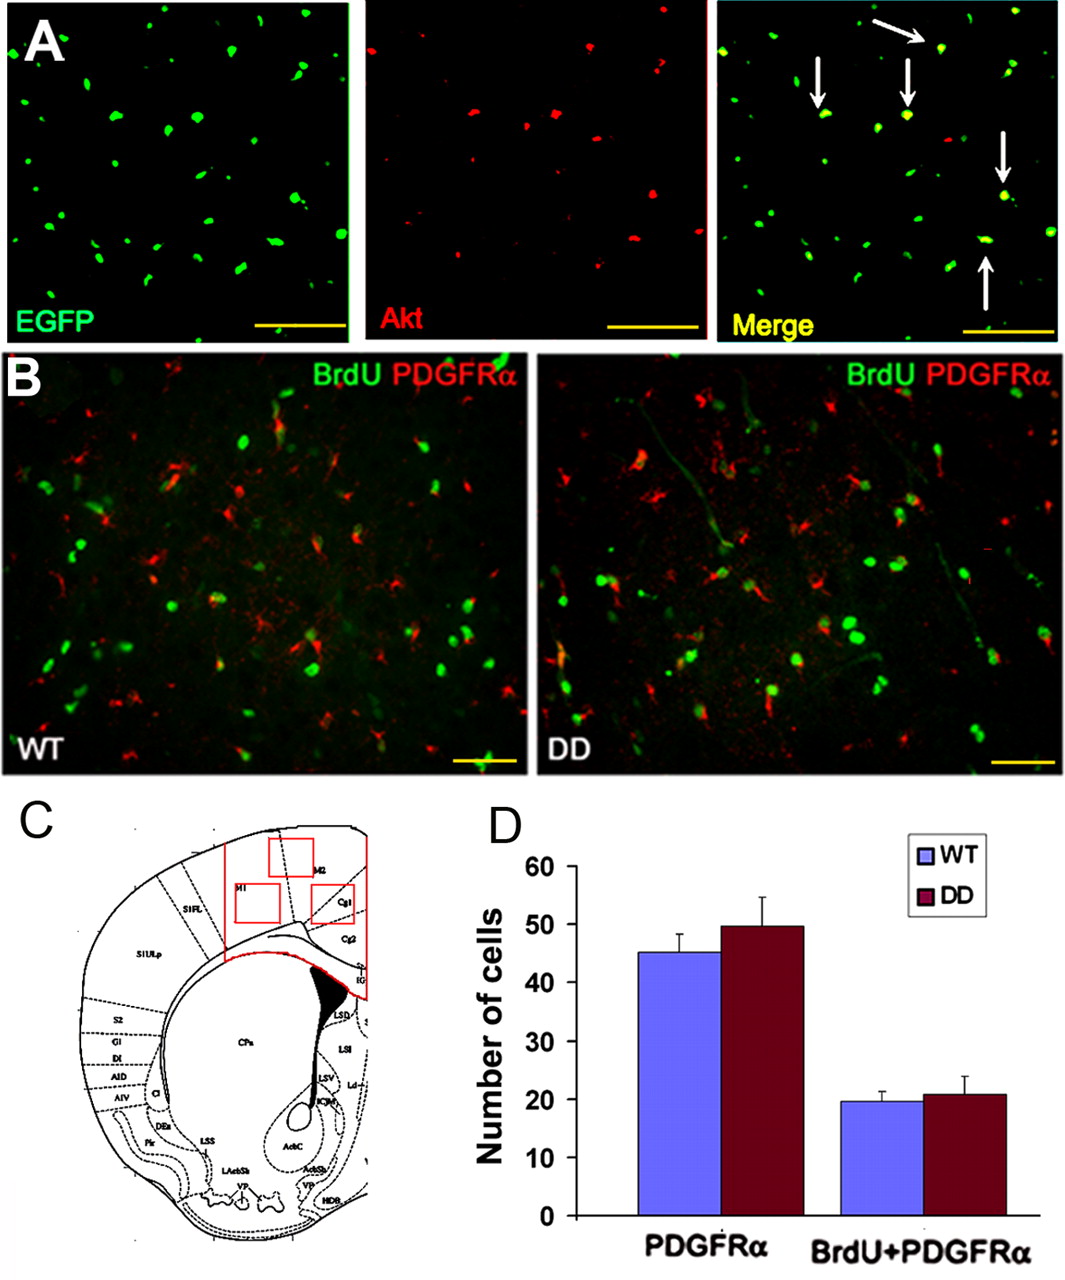
- Figure 2.
Oligodendrocyte progenitor cell number, proliferation, and survival are unaffected in Plp-Akt-DD mice. A, Plp-Akt-DD9/Plp-EGFP littermate cerebrum samples were analyzed at P6 for expression of Akt. Akt overexpression was observed only in EGFP-positive cells (arrows) in these samples, which, as shown by Mallon et al. (2002), are oligodendrocyte progenitors. n = 4. B, Plp-Akt-DD9 and WT littermates were injected with BrdU on P5 and analyzed on P6 for PDGFRα-positive or BrdU/PDGFRα-positive cells. n = 3. C, The three areas in motor cortex (M1, primary motor cortex; M2, secondary motor cortex) and cingulate cortex (Cg1, cingulate cortex area 1; Cg2, cingulate cortex area 2) that were studied to quantify progenitors undergoing cell proliferation are boxed [Franklin and Paxinos (2008), their Fig. 24, modified with permission]. D, The number of PDGFRα cells and the number of BrdU-positive PDGFRα cells were quantified in cortical areas as shown in C. The total number of cells for the three combined areas was obtained from one slide each from three animals per genotype. The average of the three samples per genotype is presented. There was no difference in either the number of progenitors or the number of proliferating cells. Scale bars: A, 25 μm; B, 50 μm. Error bars represent SEM.
- Figure 3.
Myelination was early and enhanced in Plp-Akt-DD mice with no increase in oligodendrocyte cell number. A, Cerebrum samples from WT and Plp-Akt-DD9 littermates were immunostained for PLP/DM20 at P14, P21, and P30, and enhanced myelination was seen at all ages in Plp-Akt-DD9 compared with WT. Note increased premyelinating oligodendrocytes at P14 and increased myelinated areas at older ages. This image is representative of different experiments, in which between 3 and 10 pairs of animals were analyzed per age. Scale bars, 100 μm. B, Samples were analyzed for PLP and DM20 by Western blot, at P10, P14, P21, and P30. This is a representative image of blots of between three and five pairs of animals per age. PLP/DM20 expression was increased as early as P10, compared with WT. C, RNA was prepared from cerebrum samples at P10, P21, and P30, and quantified for PLP, MOG, and MBP by real-time PCR. Samples were quantified, relative to a standard RNA, GAPDH, and expressed relative to WT samples at P21, which were given an arbitrary value of 1.0. Thus, changes in WT RNA levels were analyzed over time, along with differences between WT and transgenic samples. n = 3. *p ≤ 0.05; **p < 0.005. D, To quantify the number of oligodendrocytes, the Plp-Akt-DD9 transgene was crossed into Plp-EGFP mice. Coronal sections were imaged for EGFP-expressing oligodendrocytes in cortical areas of WT/Plp-EGFP and Plp-Akt-DD9/Plp-EGFP littermates at P14, P21, and P30. Scale bars, 100 μm. E, The area of motor and cingulate cortex analyzed for quantifying oligodendrocytes in WT/Plp-EGFP and Plp-Akt-DD9/Plp-EGFP littermates is boxed [Franklin and Paxinos (2008), their Fig. 24, modified with permission]. It includes part of M1 (primary motor cortex), M2 (secondary motor cortex), Cg1 (cingulate cortex area 1), Cg2 (cingulate cortex area 2), and the associated subcortical white matter. F, Quantification of oligodendrocytes at P14, P21, and P30, in the area outlined in E, showed no difference in the number of oligodendrocytes between WT and Plp-Akt-DD9 mice at all ages studied. n = 3 per age per genotype. Error bars represent SEM.
- Figure 4.
Optic nerves from Plp-Akt-DD mice were larger and had increased myelin, relative to WT mice. A, Optic nerves from WT and Plp-Akt-DD9 mice at 2 months of age were imaged (n = 15 per genotype), and Plp-Akt-DD9 nerves were dramatically larger than WT. B, Electron micrographs of WT and Plp-Akt-DD9 optic nerves at 2 months of age. Relatively circular axons, such as those labeled with asterisks, were used for calculating g ratio, whereas those with irregular shape, e.g., those labeled with x, were excluded from the analysis. Three samples were analyzed per genotype, and representative images are shown. Magnification, 6300×. C, Scatter diagram showing the distribution of the g ratio as a function of axon diameter in WT and Plp-Akt-DD9 optic nerve at 2 months of age. g ratios and axon diameters were plotted for individual axons. WT data points are in black; Plp-Akt-DD data points are in gray. D, Quantification of the number of axons in different size distribution for the two genotypes. Three pairs of optic nerves per genotype were used for calculation of g ratio and axon diameter.
- Figure 5.
Enhanced myelination continued as Plp-Akt-DD mice aged. A, Cerebrum samples were analyzed for PLP/DM20 expression by Western blot at 3, 6, and 10 months of age (n = 3–5 samples per age per genotype), and both were upregulated in Plp-Akt-DD9 at all ages. B, Cerebrum samples were analyzed for PLP/DM20, MAG, MBP, and MOG mRNA expression by real-time PCR at 2, 5, and 8 months of age, and all were upregulated in Plp-Akt-DD9 at all ages. Samples were quantified, relative to a standard RNA, GAPDH, and then expressed relative to WT samples at 2 months of age, which were given an arbitrary value of 1.0. Thus, changes in WT RNA levels with age are presented, as well as changes in transgenic RNA levels, relative to WT. n = 3. *p ≤ 0.05; **p < 0.005. Error bars represent SEM. C, Tissue sections were analyzed for MBP expression by immunohistochemistry at 5 months of age, which was significantly increased. In addition, enlargement of the corpus callosum (arrows) was noted (n = 16 animals per genotype at 5–6 months of age). Scale bars, 200 μm. Representative images of the immunocytochemistry are shown. D, WT (circles) and Plp-Akt-DD9 (triangles) samples were analyzed for myelin content by x-ray diffraction at 2 (open symbols) and 6 (closed symbols) months of age. At 2 months of age, four optic nerves were analyzed for WT mice and three for Plp-Akt-DD9 mice; at 6 months of age, two nerves each were analyzed. Individual data points are presented. Inset, Raw diffraction spectra used to obtain quantitative data of the relative amount of myelin. No data points are obscured beneath this inset. E, Electron micrographs of WT and Plp-Akt-DD9 optic nerves at 6 months of age. Magnification, 10,000×. At least three samples were analyzed per genotype, and a representative image is shown.
- Figure 6.
Enlarged area and reduced oligodendrocyte density in 6-month-old Plp-Akt-DD corpus callosum. A, B, Confocal images showing corpus callosum per hemisphere in WT and Plp-Akt-DD9 mice. The area occupied by corpus callosum in Plp-Akt-DD9 (B) appeared larger than that in WT (A). Scale bars, 500 μm. C, D, Representative confocal images taken at the central corpus callosum used for quantifying oligodendrocytes in WT (C) and Plp-Akt-DD9 (D) samples. Scale bars, 50 μm. E, F, Higher-magnification images showing that the number of oligodendrocytes per field of view is more in WT (E) than in Plp-Akt-DD9 (F) samples. Scale bars, 25 μm. Quantification of oligodendrocyte density (expressed as cells per cubic millimeter) at the central corpus callosum and the total number of oligodendrocytes in the corpus callosum are described in Table 1. n = 3 per genotype.
- Figure 7.
PNS myelination was not impacted by Akt-DD overexpression. A, Sciatic nerves from WT and Plp-Akt-DD9 mice were analyzed for Akt (top), P0 (middle), and actin (bottom) by Western blotting. Despite Akt overexpression in sciatic nerve, no increase in P0 was detected in Plp-Akt-DD9 mice. At least three samples were analyzed per age per genotype. B, Sciatic nerves from WT (circles) and Plp-Akt-DD9 (triangles) were analyzed by x-ray diffraction and showed no difference in myelination. Four nerves from each genotype were analyzed at 2 (open symbols) or 6 (closed symbols) months of age. C, Epon sections (1 μm) of WT and Plp-Akt-DD9 ventral roots at 2 months of age. Scale bars, 20 μm.


Tables
WT Plp-Akt-DD C. area (mm2) 0.948 ± 0.06 1.363 ± 0.05* OL density (cells/mm3) 269.84 ± 25.2 × 10³ 193.17 ± 21.8 × 10³ Number of OLs quantified at central CC 308.70 ± 61.3 286.46 ± 87.2 Number of OLs calculated in entire CC 16.89 ± 1.1 × 10³ 17.72 ± 1.3 × 10³ -
Corpus callosum area was significantly greater in Plp-Akt-DD brain than WT (Fig. 6A,B) (n = 6 per genotype; *p < 0.00005). Oligodendrocyte density (expressed as cells per cubic millimeter) at the central corpus callosum was quantified, and the cell density was lower in Plp-Akt-DD9 samples than in WT (Fig. 6C,D). The total number of oligodendrocytes in the central corpus callosum (the area in the yellow boxes in Fig. 6A,B, which are of identical width and span the entire height of the corpus callosum) was quantified in 15 μm sections from Plp-Akt-DD and WT brains, and there was no statistically significant difference (n = 3 per genotype). The total number of oligodendrocytes in the corpus callosum per hemisphere was derived by multiplying the area calculated for each section used by the respective density, and there was no statistically significant difference. This calculation was done for a thickness of 1 μm, because this was the most accurate representation of corpus callosum area, which was measured directly in a single z-stack image. These data demonstrated that the total number of oligodendrocytes in the corpus callosum remained the same in WT and Plp- Akt-DD9 samples. CC, Corpus callosum; OL, oligodendrocyte.
-
Supplemental Data
Files in this Data Supplement:
- supplemental material - Supplemental Legend
- supplemental material - Supplemental Figure 1
- supplemental material - Supplemental Figure 2
- supplemental material - Supplemental Figure 3
- supplemental material - Supplemental Figure 4
- supplemental material - Supplemental Figure 5


