

Abstract
The psychological refractory period (PRP) refers to the fact that humans typically cannot perform two tasks at once. Behavioral experiments have led to the proposal that, in fact, peripheral perceptual and motor stages continue to operate in parallel, and that only a central decision stage imposes a serial bottleneck. We tested this model using neuroimaging methods combined with innovative time-sensitive analysis tools. Subjects performed a dual-task visual–auditory paradigm in which a delay of 300 ms was injected into the auditory task either within or outside of the dual-task interference period. Event-related potentials indicated that the first ∼250 ms of processing were insensitive to dual-task interference, and that the PRP was mainly reflected in a delayed global component. By a clustering analysis based on time-resolved functional magnetic resonance imaging, we identified networks with qualitatively different timing properties: sensory areas tracked the objective time of stimulus presentation, a bilateral parietoprefrontal network correlated with the PRP delay, and an extended bilateral network that included bilateral posterior parietal cortex, premotor cortex, supplementary motor area, anterior part of the insula, and cerebellum was shared by both tasks during the extent of dual-task performance. The results provide physiological evidence for the coexistence of serial and parallel processes within a cognitive task.
Introduction
When two targets are presented at a short interval, processing the first target delays the processing of the second, a psychological phenomenon classically termed the “psychological refractory period” (PRP). According to a prominent theory, which emerged from numerous behavioral experiments, perceptual and response operations occur in parallel, and only a central decision stage, involved in coordinating sensory and motor operations, is delayed (Pashler, 1994). The aim of the present study is to analyze the neurophysiology of dual-task performance into its component stages and clearly separate its parallel and serial steps, achieving a full decomposition of the dual task.
Several previous studies have investigated the cerebral basis of processing bottlenecks. Using event-related potentials (ERPs), some components such as the N2PC, P3, and lateralized readiness potentials were found to be reduced and/or delayed during the PRP (Osman and Moore, 1993; Luck, 1998; Arnell and Duncan, 2002; Arnell et al., 2004; Dell'acqua et al., 2005; Brisson and Jolicoeur, 2007; Sessa et al., 2007). Using time-resolved functional magnetic resonance imaging (fMRI) (Kim et al., 1997; Menon et al., 1998; Formisano and Goebel, 2003), Dux et al. (2006) showed delayed activity in prefrontal cortex (PFC) in a PRP paradigm, implying that a frontal network was one of the fundamental nodes responsible for the central bottleneck of information processing.
Achieving a more exhaustive decomposition of the dual-task situation into its processing stages to understand their parallel or serial nature requires the following: (1) estimating timing information invariantly across different brain regions, distinguishing changes in onset latency and in duration (Bellgowan et al., 2003); and (2) clustering the timing information into distinct stages based on a precise model of task sequencing. In recent work, we showed how fMRI could be used to recover the precise timing of all the stages in a complex composite task (Sigman et al., 2007). Here we conducted a PRP experiment using both time-resolved fMRI and high-density ERP recordings. The timing information from both imaging techniques was clustered into components, guided by a simple psychological model of the task sequence. This allowed us to parse the execution of the two tasks into a series of processing stages with different timing properties, to understand which nodes were involved in one or both tasks or in coordinating dual-task execution, and which stages proceeded in parallel with each other or imposed a serial bottleneck.
Materials and Methods
Participants.
Twenty-one right-handed native French speakers took part in the ERP experiment (10 women and 11 men; mean age, 24, ranging from 20 to 33), and an additional 16 in the fMRI experiment (7 women, 9 men; mean age, 23, ranging from 20 to 28). All had normal or corrected-to-normal vision. All participants provided informed written consent to take part in the experiment. This study was included into a larger neuroimaging research program headed by Denis Le Bihan and approved by the Comité Consultatif pour la Protection des Personnes dans la Recherche Biomédicale, Hôpital de Bicêtre (Le Kremlin-Bicêtre, France).
Design and procedure.
Participants were asked to perform two tasks, with the clear instruction that they had to respond accurately and as fast as possible to each of them. The stimulus types and conditions were identical for the EEG and fMRI experiments. The stimulus onset asynchrony (SOA), i.e., the delay in the onset of the two tasks, changed randomly from trial to trial among four possible values: 0, 300, 900, and 1200 ms. The logic of this design was to have to SOA values separated at 300 ms within an interference regime and within a noninterference regime in which execution of both tasks does not overlap in time. Subjects responded to both tasks with key presses, with the right hand for the number-comparison task and with the left hand for the tone task. In the number-comparison task, a number, which varied randomly among four different values (28, 37, 53, and 62), was flashed in the center of the screen for 150 ms, and subjects had to respond whether the number was larger or smaller than 45. In the auditory task, subjects had to respond whether the tone was high (880 Hz) or low (440 Hz) frequency. Stimuli were shown on a black-and-white display on a 17 inch monitor with a refresh rate of 60 Hz. Subjects sat 1 m from the screen. Stimuli were always presented in the fovea, and their size was 1°. Auditory stimuli were pure tones of 150 ms duration and 440 or 880 Hz frequency. Auditory stimulation was provided through headphones.
Subjects were trained in the task before beginning the EEG recordings. During this practice period, response times were monitored on-line, and subjects did not start the imaging session until they completed 10 consecutive trials with both response times <1000 ms. During the EEG recording, intertrial intervals (ITIs) were jittered in the range from 3 to 4.2 s (mean ITI, 3.6 s). Subjects performed a total of 960 trials (240 for each SOA value), which were divided into five identical blocks of 192 trials. Subjects had a variable rest (maximum of 5 min between blocks).
Subjects were trained in the task before beginning the fMRI. The training criterion was identical to that in the EEG recordings. Three subjects participated in both experiments. During the fMRI recording, subjects performed one single-task block and five dual-task blocks.
The single-task block comprised 180 trials. Before the beginning of each trial, the fixation cross dimmed to subjects. Number (72 trials) and pitch (72 trials) were intermixed. Thirty-six trials were blanks, in which the fixation cross dim was followed by a blank. Intertrial intervals were jittered between 2.5 and 3 s (mean, 2.75 s). The entire block lasted 440 s (∼7 min).
In the dual-task condition, subjects performed a total of 160 trials (40 of each SOA value) divided into five identical blocks. Because our phase analysis is optimal for slow event-related designs (Sigman et al., 2007), intertrial intervals were 12 s. Each block lasted 384 s, ∼6 min.
ERP methods.
ERPs were sampled at 250 Hz with a 128-electrode geodesic sensor net referenced to the vertex. We rejected voltage exceeding 200 μV, transients exceeding 100 μV, or electrooculogram activity exceeding 70 μV. The remaining trials were averaged in synchrony with T1 onset, digitally transformed to an average reference, bandpass filtered (0.3–30 Hz), and corrected for baseline over a 1000 ms window during fixation before the onset of T1.
ERP component analysis.
Response components (R̄c) are vectors of 128 coordinates, corresponding to a specific pattern of activity across all the electrodes determined by the voltage in each electrode at four different time points of the ERPs. These time points were obtained as the maxima of the sum of the absolute value of the activity across all electrodes in the ERPs (see Fig. 2a). Because the data had been previously referenced to the mean, the mean of each response component is zero. All projections were based on a linear regression (one for each time point) of the data to these four components. For any data D(i,t) (these data can correspond to an individual subject, or grouped data, or even a single trial), where i denotes the electrodes (1–128) and t denotes time, the projection of the data to the four response components was estimated by performing, at each time point (i.e., for each value of t), a linear regression of the resulting data point to the four response components · R̄c1 … R̄c4. Thus, for each value of t, we solved, using minimal mean squares, the following model:
 where D̄t corresponds to D(i,t) for a fixed t, and all vectors have lengths corresponding to the number of electrodes (128).
fMRI methods.
The experiments were performed on a 3T fMRI system (Bruker). Functional images sensitive to blood oxygenation level-dependent (BOLD) contrast were obtained with a T2*-weighted gradient echoplanar imaging sequence [repetition time (TR) = 1.5 s; echo time = 40 ms; angle = 90°; field of view (FOV) = 192 × 256 mm; matrix = 64 × 64]. The whole brain was acquired in 24 slices with a slice thickness of 5 mm. High-resolution images (three-dimensional gradient echo inversion-recovery sequence, inversion time = 700 mm; FOV = 192 × 256 × 256 mm; matrix = 256 × 128 × 256; slice thickness = 1 mm) were also acquired.
fMRI statistical analysis.
Data were analyzed with SPM2. To estimate the periodicity and phase of the event-related BOLD response, the data from each subject were submitted to a first-level model in which the signal from each trial (8 TRs of 1.5 s) was fitted with three regressors: a constant, a sine, and a cosine function at the above period. To facilitate intersubject averaging across possible differences in anatomical localization, the regression weights of the sines and cosines were smoothed (7 mm full-width at half-maximum). They were then transformed with the inverse tangent function to yield, for each trial, a phase lag expressed in seconds. As in Sigman et al. (2007), phase and amplitude were calculated as φj = arctan(Ajy/Ajx) and Aj =
To restrict our analysis to the network of voxels engaged in the task, we used phase information and estimated the fraction of measurements of the phase that lay within the expected response range (ERR). A total of 64 mean phase measurements were obtained corresponding to four conditions, each repeated for 16 subjects. The ERR was set to the interval from 2 to 10 s, based on previous characterizations of the hemodynamic response function and allowing a margin to account for region-to-region variability and changes across conditions. The probability that x out of 64 measurements lie within the ERR can be calculated following the binomial distribution (Sigman et al., 2007). We kept for analysis only voxels with >48 measurements within the ERR, corresponding to a binomial p < 0.05. The corresponding network can be seen in Figure 5, and corresponds to 27.9% of the whole brain.
Within this mask, the significance of the variations in phase with delay were assessed with a second-level SPM model that included all the single-trial phase measurements. Four regressors of interest modeled the four possible values of delays (0, 300, 900, and 1200 ms). Eight other regressors of no interest captured variations induced by the two response times (RT1 and RT2) within each of these delay conditions. For these variables, the mean RT within a given subject and delay was subtracted from the RT observed on each trial. Finally, 16 additional variables captured the within-subject changes in phase, reflecting the fact that the delay variable was a within-subject variable.
Two statistical tests were performed. First, we looked for linearly increasing phases as a function of delay (contrast −2 −1 1 2, taking into account the irregular spacing of the delays). Second, we searched for regions with a delay by regime type interaction (contrast 1 −1 −1 1), corresponding to a PRP effect. The same SPM model was also applied to measurements of single-trial response amplitude. All results are reported at voxel p < 0.001 and cluster-level p < 0.05 corrected for multiple comparisons across the brain volume.
Results
Behavioral results and theoretical predictions
In the main dual-task blocks, subjects performed a sequence of two tasks: first a visual task of comparing an arabic numeral (target T1) to a fixed reference, with a right-hand response (response time 1 or RT1), and second an auditory task of judging the pitch of an auditory tone (target T2) with a left-hand response (response time 2 or RT2). The SOA between T1 and T2 was varied between 0, 300, 900, and 1200 ms.
Our analysis will be guided by precise quantitative behavioral dependences between the mean of RT1, RT2, and SOA. Thus, we first set to analyze critical aspects of these dependencies and test the hypotheses of the classical PRP model (Pashler, 1984, 1994; Pashler and Johnston, 1989; Pashler et al., 2001; Sigman and Dehaene, 2005) as illustrated in Figure 1.

Model of the psychological refractory period and main predictions. A, Model. The vertical axis indexes processing time. The column on the left indicates the first task, and each colored box within the column represents a different stage of processing: P component (blue), C component (green), and M component (black). The series of columns on the right indicate the processing time for task 2 at different SOAs (labeled on the x-axis). For each column, the three different boxes represent the three different stages of task 2: P component (red), C component (cyan), and M component (gray). As SOA progresses, the P component starts later. All components can be performed in parallel with task 1 components, except for the C component, which imposes a bottleneck. Seriality at the C level only results in the following predictions: (1) processing of the first task is independent of SOA; (2) RT2, measured from trial onset and represented by the black line, is unchanged for small SOA (within the interference regime) but increases linearly with a slope of 1 with SOA at long T1–T2 delays (noninterference regime). B, Predicted RT1 and RT2 (from trial onset) as a function of SOA, separately within and outside the interference regime. C, Observed average RT2 and RT1 as a function of SOA. D, The model also makes predictions concerning the activation delay of processes within each task. (1) All processes of task 1 should be unaffected by SOA; (2) P processes of task 2 should increase linearly with SOA in both regimes, whereas C processes should be independent of SOA within the interference regime and increase linearly with SOA outside the interference regime.
In most PRP studies, response times are usually measured from the onset of the corresponding stimulus (T1 or T2). The PRP effect is manifested as a linear decrease (with a slope close to −1) of RT2 with SOA for short SOA values. For long SOA values, when the two tasks are independent, RT2 is independent of SOA. Here, and throughout the paper, we follow a different convention in which response times to both tasks are reported from trial onset (i.e., onset of T1). The logic for such a choice is that, throughout the paper, we will seek to understand the dependence of different cerebral responses (of fMRI voxels or of components of the EEG response) with SOA. In this context, it is helpful to relate this timing to a single common onset for task 1 and task 2, hence we locked all measures to the beginning of the trial. When RTs are measured from trial onset, as we do here, the main PRP effect results in the following: (1) invariance of RT1 with SOA for all SOA values, (2) invariance of RT2 with SOA for short SOA values (intuitively this can be understood as a queuing process, whereby the second task cannot be completed until the first task is over, thus making the response to task 2 independent of the presentation time of the corresponding target T2), and (3) linear increase of RT2 with SOA for large SOA values. Note that changing from one representation to the other simply involves subtracting SOA to RT2. For consistency, in Table 1, we report all RT values in both notations.
RT1 and RT2 during the fMRI and ERP experiments
The experimental design was chosen so as to have two different SOA values within the interference regime (SOA = 0 or 300 ms), in which execution of both tasks overlaps in time, and two SOA values in the noninterference regime (SOA = 900 or 1200 ms), in which the onset of the second stimulus comes after the first task has been completed. The logic of the experimental design is to understand the effect of injecting a 300 ms delay in task 2 either within the interference or within the noninterference regime. Theoretical models of dual-task interference (Pashler, 1984; Pashler and Johnston, 1998) based on behavioral results predict that whereas certain processes of a task can be performed in parallel with concurrent processes of another task, other processes can be only executed serially and thus establish a processing bottleneck (Fig. 1a). The model predicts that RT1 should be unaffected by SOA manipulations. On the other hand, manipulations of SOA affect RT2 distinctively depending on whether this manipulation is done within the interference regime or not. Within the noninterference regime, increasing SOA should result in a direct proportional increase of RT2 (which by convention is taken from trial onset, i.e., the onset of the first stimulus T1). On the contrary, within the interference regime, increasing SOA should result in little or no change of RT2, because this response is no longer locked to T2 onset, but rather to the completion of the serial process of task 1 (Fig. 1b).
The response times measured during ERP recordings followed this prediction (Fig. 1c, Table 1), thus replicating our previous results (Sigman and Dehaene, 2005). To quantify this observation, we performed an ANOVA with two factors: regime type (interference or noninterference) and delay manipulation (short or long SOA within each regime) (Table 2). As predicted by the model, we did not find any effect of SOA manipulations on RT1. Furthermore, we found a significant effect of both factors and of their interaction on RT2. Indeed, within the interference regime, there was only a moderate increase of RT2 with the 300 ms delay manipulation (RT2SOA=0 = 990 ± 20 and RT2SOA=300 = 1042 ± 19). This difference (54 ms) is small compared with the change observed in the noninterference regime (RT2SOA=900 = 1420 ± 14 and RT2SOA=1200 = 1680 ± 12), thus indicating the presence of a dual-task bottleneck at short but not long SOA. The fact that there was a residual nonzero difference merely indicates that for some trials in which the first task was responded fast, the second task may not have suffered from a full 300 ms bottleneck delay.
Statistical effects of SOA manipulations on response times and ERP component delays
In dual-task experiments, response grouping is sometimes reported. Grouping may indicate that the dual task is treated as a single compound stimulus S1 + S2 with a corresponding compound response R1 + R2 (Welford, 1967). Alternatively, the first response may be deferred until the second response has been selected, so that the two responses are emitted simultaneously or in close succession (Borger, 1963). Grouping would be problematic for present purposes, because it would imply that all of the processing stages of both tasks are performed before the execution of the first response, thus yielding predictions qualitatively distinct from what is expected in the sequential bottleneck model. It is therefore important to verify that subjects were not grouping responses in the present experiment. To this aim, we conducted two analyses on the response time data. First, experiments in which responses were voluntarily grouped have observed a very short delay between responses, typically <100 ms (Pashler and Johnston, 1989; De Jong, 1993). In contrast, in our experiment, both in the fMRI and in the EEG data, <0.7% of the trials show a difference of 100 ms or less. Second, in grouped trials, the response to the first task is not executed until the second task is performed, which implies that RT1 should increase monotonically with SOA. In our data, we do not observe this behavior as indicated in Table 1, in which no effect of SOA is observed on RT1.
Beyond the predictions for response time data, our simple theoretical model makes predictions concerning the dynamics of the different processes, depending on whether they can be carried in parallel with concurrent processes of another task or rather establish a serial bottleneck. The predictions are summarized in Figure 1d. Here we draw attention to the main points. First, SOA should have no effect on any process of task 1. Second, the SOA manipulation is expected to separate, within task 2, two different types of cerebral processes. Processes locked to the onset of the second stimulus (parallel) should exhibit additive effects of regime and delay, but no interaction should be found. Processes that track the dual-task bottleneck and its consequences should reflect an effect of regime and of delay as well as, crucially, an interaction between these two factors. In what follows, to test these predictions, we will decompose the ERP data into distinct response components and study their latency as a function of SOA.
Decomposing the ERP data
To understand the dynamics of different brain processes involved in the dual-task condition, we first decomposed the ERP data using scalp templates identified from the ERP recorded at the largest SOA (SOA = 1200), in which the execution of both tasks does not overlap in time. To identify the main ERP components involved in each task at the group level, we integrated the absolute value of the voltages recorded over all electrodes from the grouped data at SOA = 1200. This simple measure resulted in two clearly distinguishable peaks (Fig. 2a) after the presentation of each stimulus. The topographic distribution at the time of each maximum could easily be identified as the N1 and P3 components corresponding to each task. The peak latencies of the selected components were as follows: visual N1, 180 ms; visual P3, 340 ms; auditory N1, 110 ms; and auditory P3, 370 ms. Although more components could potentially have been identified by a more sophisticated analysis, our aim was not to identify all the independent processes within a task, but rather to understand the dynamics of these basic response components within the interference and noninterference regimes.

Decomposing the ERP data into four scalp templates. A, Integrated absolute value of voltages recorded over all electrodes from the grouped ERP data at the SOA = 1200 condition. After the presentation of the first (visual) stimulus (red bar) and the second (auditory) stimulus (blue bar), two peaks are clearly noticeable. At the latency of each peak, we estimated the voltage topography, which corresponds to well known N1 and P3 components. The P3 component of task 1 is lateralized to the right, and the P3 component of task 2 is lateralized to the left. This may result from motor preparation or setting of the stimulus response, because responses to the first task were made with the right hand and responses to the second task with the left hand. B, A histogram, across subjects, of the time at which the projection of the data from SOA = 1200 onto each component reached its maximum. The timing of N1 components is significantly more reliable across subjects than the timing of the P3 components. Colors correspond to a rainbow color scale between −4 and 4 μV.
To obtain response templates for each individual subject, and therefore estimate the components and their latencies at the individual level, we used multiple linear regression to project, for each individual subject and each time point, the ERP at SOA = 1200 (in the noninterference regime) to the four previously identified group scalp templates. We observed that on a subject-by-subject basis, the maximum of this projection did not coincide precisely with the timing of each group component. Thus, within a window of 400 ms centered in the timing of the group template, we searched for the maximum of this projection. For both tasks, N1 components were considerably more reliable in time than P3 components (Fig. 2b). The scalp template of each individual subject was then estimated as the ERP map at the time point at which the projection to the group template was maximal.
Understanding the temporal dispersion of different components across subjects is informative, and, moreover, it allows a more appropriate definition of individual ERP components. However, it is important to note that no significant departures from the results reported here were observed when individual templates were defined at the same time point, based solely on the group timing. Indeed, very similar results were obtained even when the group templates were used as templates for the regressions of individual subjects.
Analyzing the latencies of the response components
To understand the dynamics of each scalp component as a function of the different SOA values, we used linear regression to decompose each ERP, at each SOA and each time point, into a linear combination of the four scalp templates. Thus, for each subject, we obtained a time course of the projection of the data onto each of the four ERP components (for simplicity, we refer to this simply as the “time course of the ERP component”). It is important to emphasize that the same four templates were used for all SOA values: this allowed us to understand how the dynamics of the corresponding brain processes changed in the different regimes. We observed that the time course of the components (Fig. 3) fitted with predictions derived from our sequential model, if one supposes that the N1 components map onto perceptual processes and the P3 components onto central processes. The temporal course of the components of the first task (T1_N1 and T1_P3) was utterly unaffected by changes in SOA values (Fig. 3, first and second rows). This observation testifies to the efficiency of the decomposition procedure, which was able to identify the visual components of the T1 task even when they were superimposed with simultaneously occurring auditory components.

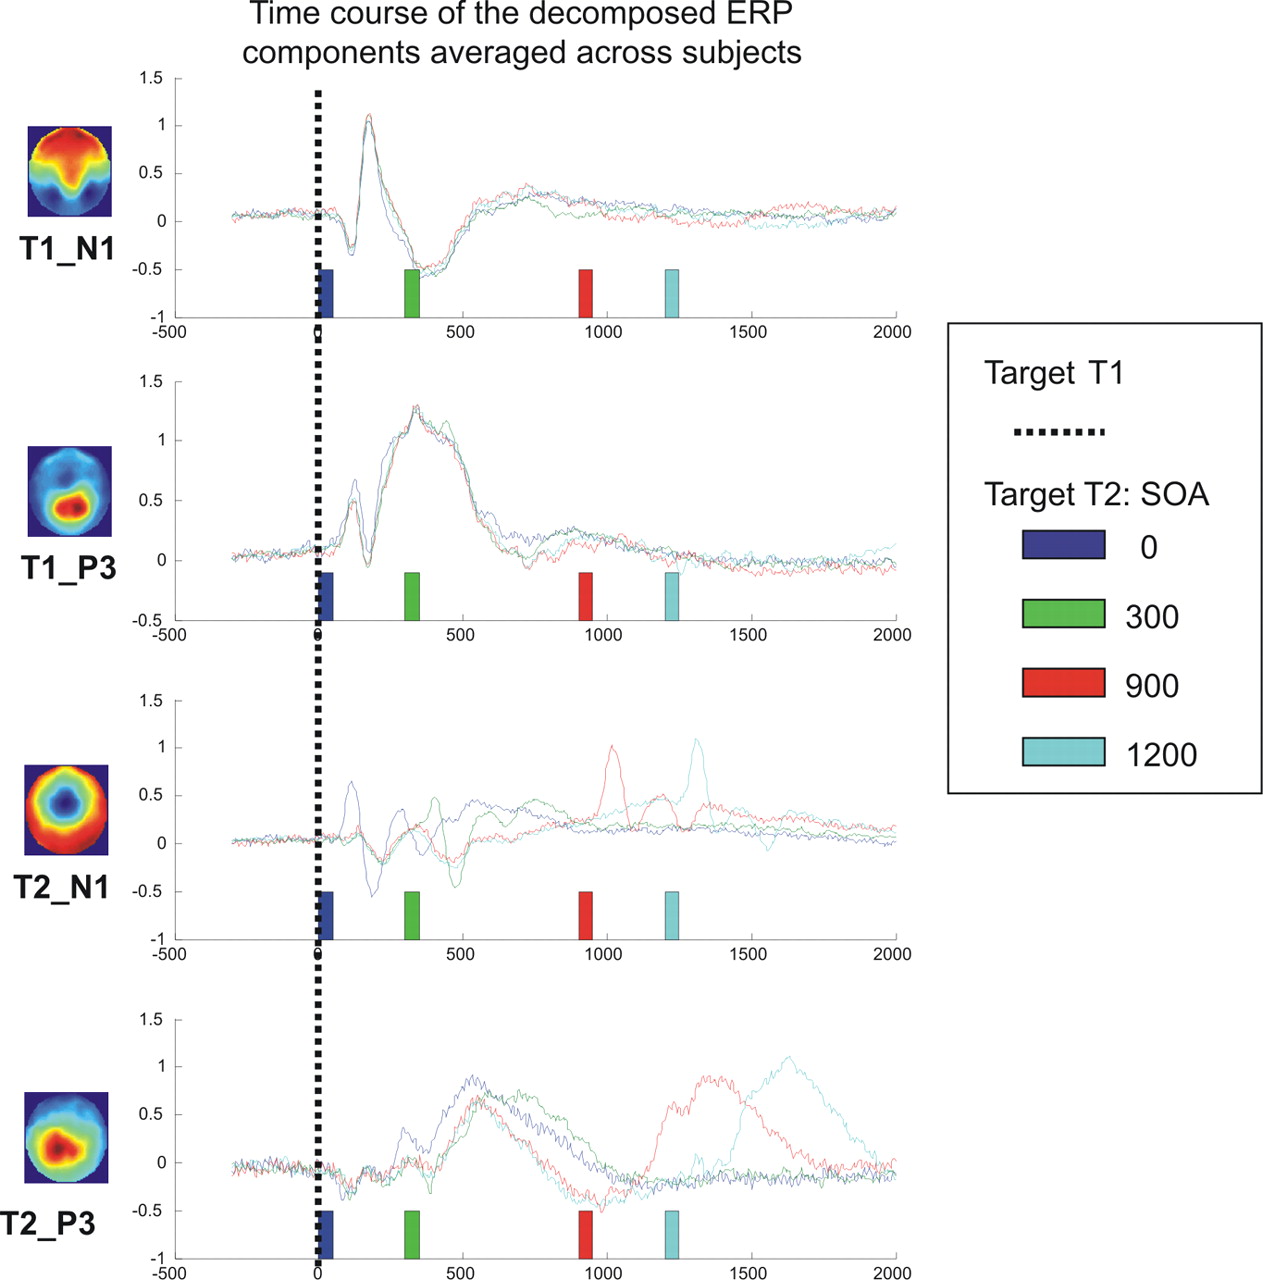
Time course of the four ERP components. Each row corresponds to the regression of the data onto one of the four ERP scalp templates (respectively, the N1 and P3 of task 1, then of task 2). Within each row, the different colors indicate the time course for a given SOA value. Components of the first task (first two rows) are unaffected by SOA. The N1 component of task 2 has a maximum at a fixed latency after target T2, both within and outside the interference regime. The P3 component of task 2 shows a minor effect of SOA within the interference regime and a shift proportional to the SOA change in the independent regime. Colors correspond to a rainbow color scale between −4 and 4 μV.
On the contrary, the temporal course of the components of the second task showed a very distinct pattern. The temporal course of the T2_N1 component was strictly time locked to T2 onset, as expected for a perceptual component of task 2. It had a maximum at a fixed latency after T2 presentation, both within and outside the interference regime, and thus increased linearly with SOA. The temporal course of the T2_P3 component of task 2, on the other hand, showed a minor effect of SOA within the interference regime and a shift proportional to the change in SOA in the noninterference regime, as expected for a central component of task 2.
To quantify these observations, we used the individual response components (Fig. 4a). For each individual subject and SOA condition, we estimated the delay in the onset of a component as the time at which the projection of the data onto this component reached its maximum (within an interval of 1000 ms after stimulus presentation). We then estimated the mean for each component and condition by averaging the results across subjects (Fig. 4c). The obtained results showed the pattern expected by the sequential model (Fig. 4b). To test the significance of this observation, these values were submitted to the same ANOVA as response times, again with factors of regime type (interference or noninterference) and delay manipulation (short or long SOA within each regime) (Table 2). As predicted, no effects were found for the components of task 1. Also, as predicted, we observed a main effect on both components of task 2 but an interaction only for the T2_P3 component.

Analyzing the latencies of the ERP components. A, Each of the four panels shows the time course of individual subjects' ERP components (first row, task 1; second row, task 2; first column, N1; second column, P3). Within each panel, the data are divided into four images corresponding to different SOA values. Within each image, each line corresponds to the time course for an individual subject, with amplitude coded by color. In the top panels, it can be seen that the projection is not sensitive to SOA, whereas in the bottom panels, it changes with SOA. Colors correspond to a rainbow color scale between −4 and 4. B, C, Predicted and observed mean latency of each component (averaged across subjects) as a function of SOA, within and outside the interference regime. As predicted by the model, task 1 components are independent of SOA. The N1 component of task 2 increases with SOA within both regimes, as predicted by a P component. The P3 component increases with SOA in the independent regime but not in the interference regime as predicted by a C component.
Summary of inferences from ERP recordings
Overall, the ERP results appear highly compatible with the proposed parallel–serial model. The fact that the T1 task components are entirely unchanged by the simultaneous presentation of a second auditory target T2 at various SOAs provides strong support for the serial hypothesis that subjects concentrate entirely on performing task 1 first. Contrary to response times, which only index task completion, ERPs track the complete time course of task 1 processing and suggest that task 1 is entirely unaffected by whether a second target is or is not waiting to be processed. This observation conflicts with an alternative model that postulates central capacity sharing during dual-task performance (Tombu and Jolicoeur, 2005). At least in our specific experimental set up, with a fixed task order and with instructions to respond as fast and as accurate as possible to both tasks, we found no evidence for central time sharing between the T1 and T2 tasks.
As for task 2, we found that a perceptual stage, indexed by the N1, unfolded immediately after T2 presentation (and thus in parallel with the ongoing task 1), whereas a later stage, indexed by the P3, was systematically delayed in tight parallel to the dual-task processing delay inferred from response times (Fig. 4c). The data suggest that the perceptual component unfolds as a series of damped oscillations over a period of ∼300 ms after T2 onset (Fig. 3, third row), whereas the central component starts ∼250 ms after T2 onset and peaks at 380 ms. This temporal decomposition fits well with a previous ERP-based decomposition of processing in related attentional-blink and masking experiments (Sergent et al., 2005; Del Cul et al., 2007), in which the first ∼270 ms were attributed to perceptual processing and were followed by conscious access to a central distributed workspace involving prefrontal cortex as a central node.
Some details of the ERP analysis do suggest departure from the simple model proposed. Crucially, the N1 component of task 2 does not appear strictly invariant as a function of SOA. First, some amplitude attenuation is visible in Figure 3, especially at the SOA of 300 ms (when T2 is presented while the subject is most fully engaged in task 1 processing). To test this quantitatively, we measured the amplitude of the peak of the N1 component of task 2 for the different SOA values, for each individual subject and then averaged across subjects. The peak amplitudes for the SOA values of 0, 300, 900, and 1200 ms were respectively 0.87 ± 0.05, 0.82 ± 0.07, 1.01 ± 0.08 μV, and 1.11 ± 0.07 μV. An ANOVA on peak amplitude showed a significant effect of regime type (F = 66.1; p < 0.001; df = 1) and of delay manipulation (F = 16.0; p < 0.001; df = 1), with no significant interaction. Second, for the largest SOA values, the temporal course of the N1 component ramps before stimulus presentation, probably reflecting task expectation and preparation (Fig. 3, third panel, especially for SOA = 1200 ms). Both the shifting baseline and increased auditory N1 for late SOA suggest that, contrary to the simple model, perceptual auditory processing was slightly modulated by task 1 engagement. This modulation probably reflected a change in attention (and the well known fact that attentional engagement in a visual task can lead to reduced auditory processing). Once subjects completed the visual task 1, which always came first, they were able to deploy auditory attention more fully, thus explaining the enhanced auditory N1 at long SOAs.
Indeed, the auditory P3 component provided direct evidence for a process of auditory anticipation. As seen in Figure 3 (fourth panel), an auditory P3 component emerged at long SOAs even before any auditory stimulus was presented. This anticipatory component peaked at ∼500 ms, thus coinciding nicely with the end of the visual P3 evoked by task 1. This ERP sequence is compatible with the hypothesis that as soon as they completed task 1, subjects reoriented their attention to prepare for task 2, thus enabling them to respond faster to T2 at long SOAs (Fig. 4c, lag between RT2 and T2_P3). That task 2 preparation contributes to the PRP phenomenon has often been postulated in previous behavioral work. For instance, it can account for the fact that task 2 is often completed faster than task 1 at long SOAs (Logan and Gordon, 2001), or that a PRP cost is found even on trials in which RT1 is shorter than the SOA (Jentzsch et al., 2007). The time course of the P3 component of task T2 clearly indicates the presence of an executive component of task 2 engaging, even before target 2 presentation, in agreement with a considerable amount of previous behavioral work (De Jong, 1993, 1995; Allport et al., 1994; Meiran et al., 2000; Logan and Gordon, 2001; Ruthruff et al., 2001; Sigman and Dehaene, 2006; Jentzsch et al., 2007).
fMRI experiment
To further our understanding of dual-task interference, it is essential to understand the cerebral underpinning of the central P3 component observed at the scalp level. Unfortunately, ERPs provide high temporal resolution, but they are notoriously imprecise for localization. Although distributed dipole models can be used to reconstruct an estimated time course of activation at each cortical location (Sergent et al., 2005; Del Cul et al., 2007), this reconstruction is only approximate. Here, we took advantage of the fact that the PRP phenomenon induces large delays of several hundred milliseconds, which are measurable with fMRI. We recently described a Fourier-based method that results in a temporal resolution of ∼100–200 ms with whole-brain fMRI (Sigman et al., 2007). The method is based on (1) a slow event-related design with long intertrial intervals, permitting measurement of the entire rise and fall of the hemodynamic response on each trial; (2) fitting of this response with sine and cosine functions, allowing estimation of its phase and amplitude; and (3) examination of how the phase and amplitude vary as a function of experimental parameters (here the injected SOA delay between T1 and T2). For a change in the onset of neural activation, only the phase of the hemodynamic response should vary, not the amplitude. For a change in duration of activation, both phase and amplitude should increase, with the slope of the phase change reflecting one-half of the actual change in the duration of neuronal activation (Sigman et al., 2007).
We therefore recorded whole-brain fMRI images (TR = 1.5 s) while subjects performed, in the main blocks, 160 trials of the dual-task paradigm, spaced by 12 s, with the same four levels of SOA as above (0, 300, 900, or 1200 ms). The standard PRP model makes simple predictions about the impact of this delay on activation. As with the ERPs, these predictions will determine the analytic strategy to understand the fMRI data. For regions involved exclusively in task 1, activation should be identical and not delayed, hence the phase should be constant. For regions involved in the perceptual component of task 2, activation should be linearly delayed, and hence the phase should increase in direct proportion to the SOA. Finally, for regions involved in the central and motor components of task 2, activation should be delayed by the PRP bottleneck. Hence, a nonlinear phase change should be seen: the phase should be constant in the interference regime, but affected by SOA in the noninterference, thus resulting in an interaction of delay and regime type. For all these regions, if the effect of SOA is simply to alter the onset time of distinct processes, the amplitude of the fMRI activation should remain constant.
To test these predictions, we computed the phase and amplitude of the hemodynamic response on each trial, each subject, and each voxel, and submitted the resulting images to an ANOVA with delay as the main within-subject factor (see Materials and Methods). As shown in Figure 5, a large network of brain areas exhibited phases consistently falling within the expected response latency for a task-induced activation (a liberal interval of 2–10 s). As expected for a complex dual-task experiment with visual and auditory stimuli, these regions included bilateral visual occipitotemporal cortices, bilateral superior temporal auditory cortices, motor, premotor, and cerebellar cortices, and a large-scale bilateral parietofrontal network (Fig. 5).

Active network during dual-task performance. A, Fraction of measurements (a total of 64, corresponding to 16 subjects × 4 conditions) in which the mean phase value lies within the expected response range (set to a liberal interval of 2–10 s). Brain regions that show phases consistently within the expected regions (active regions) are shown in red, and brain regions whose phase is consistently out of the expected range (inactive regions) are shown in blue. As expected for a complex dual-task experiment with visual and auditory stimuli, active regions included bilateral visual occipitotemporal cortices, bilateral superior temporal auditory cortices, motor, premotor, and cerebellar cortices, and a large-scale bilateral parietofrontal network. Inactive regions involve a network that has been systematically shown to inactivate during task execution (Raichle et al., 2001). B, Only a subset of the active network showed a significant increase in phase with SOA. C, A bilateral frontoparietal network showed a significant nonlinear effect (i.e., the effect of injecting a delay on the phase is distinct during the interference and noninterference regimes). L, Left; R, right.
Linear contrast for phase increase
We then examined which brain areas showed a significant increase in phase with SOA, using a linear contrast. Only a subset of the active network showed a significant phase increase (Fig. 5). In particular, although the bilateral lateral occipitotemporal cortices, expected to contribute exclusively to task 1 (visual comparison), were highly active, their phase was essentially unaffected by delay (Fig. 6). As could be predicted from the fact that task 2 involved an auditory decision, the most significant phase increase was seen in a large extent of bilateral auditory cortices, extending from Heschl's gyrus to the lateral superior temporal gyrus and surrounding lower bank of the supramarginal gyrus (peak Montreal Neurological Institute coordinates, −52, −28, 4; t = 11.0; and 54, −18, 6; t = 10.6). In these auditory areas, the extracted phase varied almost strictly linearly with the injected delay, and with a slope not significantly different from 1 (Fig. 6). The linear effect was also significant in right midline precentral cortex at the level of the supplementary motor area (SMA; 10, −10, 59; t = 9.07), right motor cortex (26, −30, 54; t = 8.76), right central gyrus (44, −20, 44; t = 8.68), and left cerebellum (−20, −56, −20; t = 7.12) corresponding to the left hand used to respond to task 2.

Evidence for delayed activation in fMRI. A, Axial slices showing some of the brain areas in which the phase of activation increased with SOA. Only voxels with a highly significant linear contrast (voxel p < 0.05, familywise-error correction for multiple comparisons across the brain volume) are shown here for visualization purposes. Color encodes the value of the slope relating phase to SOA (a slope close to 1 is expected for regions in which activation is delayed in direct proportion to T2 presentation). B, Insets show the measured phase for each of the four SOAs (0, 300, 900, and 1200) and the 90% confidence interval as estimated by SPM2. For reference, two dotted lines are provided: slope of 0 (no variation in phase) and slope of 1 (pure delay). Phase dependencies with SOA are highly bilaterally symmetric and show very distinct profiles in active regions. For instance, the auditory cortex (middle row insets, z = 6 axial slice) shows a slope value very close to 1, whereas the extrastriate visual cortex (lateral occipital), although highly activated, has a phase value insensitive to SOA manipulations. L, Left; R, right.
Note that an effect of SOA on the phase was also seen in the left motor cortex (−60, −20, 46; t = 7.19) and right cerebellum (30, −58, −28; t = 6.51), perhaps corresponding to partial bilateral motor control. More surprisingly, phase also increased with delay in bilateral posterior lingual gyrus and cuneus (peaks at 10, −76, 0; t = 7.50; 0, −82, 18; t = 7.43). Additional smaller peaks were seen in bilateral thalami (8, −28, −2; t = 7.03; −14, −26, −2; t = 6.80), bilateral dorsolateral PFC (−42, 40, 28; t = 4.56; 48, 38, 26; t = 4.42), and bilateral inferior temporal cortex (−52, −64, 0; t = 4.41).
In sharp contrast with this major effect of delay on the measured phases, not a single brain region showed a significant linear increase in amplitude of the BOLD signal with delay, even when the threshold was lowered to a liberal voxelwise p < 0.01, uncorrected. This finding is important, because it indicates that dual-task interference corresponds to a pure delay effect: the lengthening of RT2 for short T1–T2 delays occurs without a change in the duration or the amplitude of the neural activation anywhere in the brain. This result, which replicates previous findings (Jiang et al., 2004), argues in favor of the present queuing model (Pashler, 1994; Sigman and Dehaene, 2005) and against models that attribute dual-task interference to a deployment of additional effort, resources, or central executive monitoring (Meyer and Kieras, 1997).
Nonlinear profiles of phase
As seen in Figure 6, within the areas selected for their significant increase in phase with delay, distinct temporal patterns were in fact observed. In auditory cortex, a purely linear variation was observed, whereas in right motor cortex, there seemed to be no increase of phase within the interference regime, reflecting the PRP effect.
To identify regions reflecting a phase dependence characteristic of the PRP effect, we searched for regions with a significant interaction between delay and regime type, as observed in RTs and in the P3 component of event-related potentials. The overall network of regions showing a significant nonlinear effect is shown in Figure 5c. A bilateral parietofrontal network was seen, with its largest peak in right intraparietal and superior parietal cortex (36, −44, 40; t = 4.55; and 40, −48, 54; t = 4.42) and smaller clusters in left parietal cortex (−42, −48, 56; t = 4.44; −60, −38, 46; t = 4.09) and left dorsolateral PFC (−40, 44, 16; t = 4.38) (Fig. 7). A symmetrical right dorsolateral PFC cluster showed a strong effect (40, 32, 32; t = 4.17), but its extent of 22 voxels was too small to reach significance (Fig. 7). Finally, the right precentral gyrus also showed a nonlinear phase (34, −2, 66; t = 4.03). Again, all of these temporal effects occurred without any corresponding nonlinear change in BOLD signal amplitude, even at a relaxed p < 0.01.
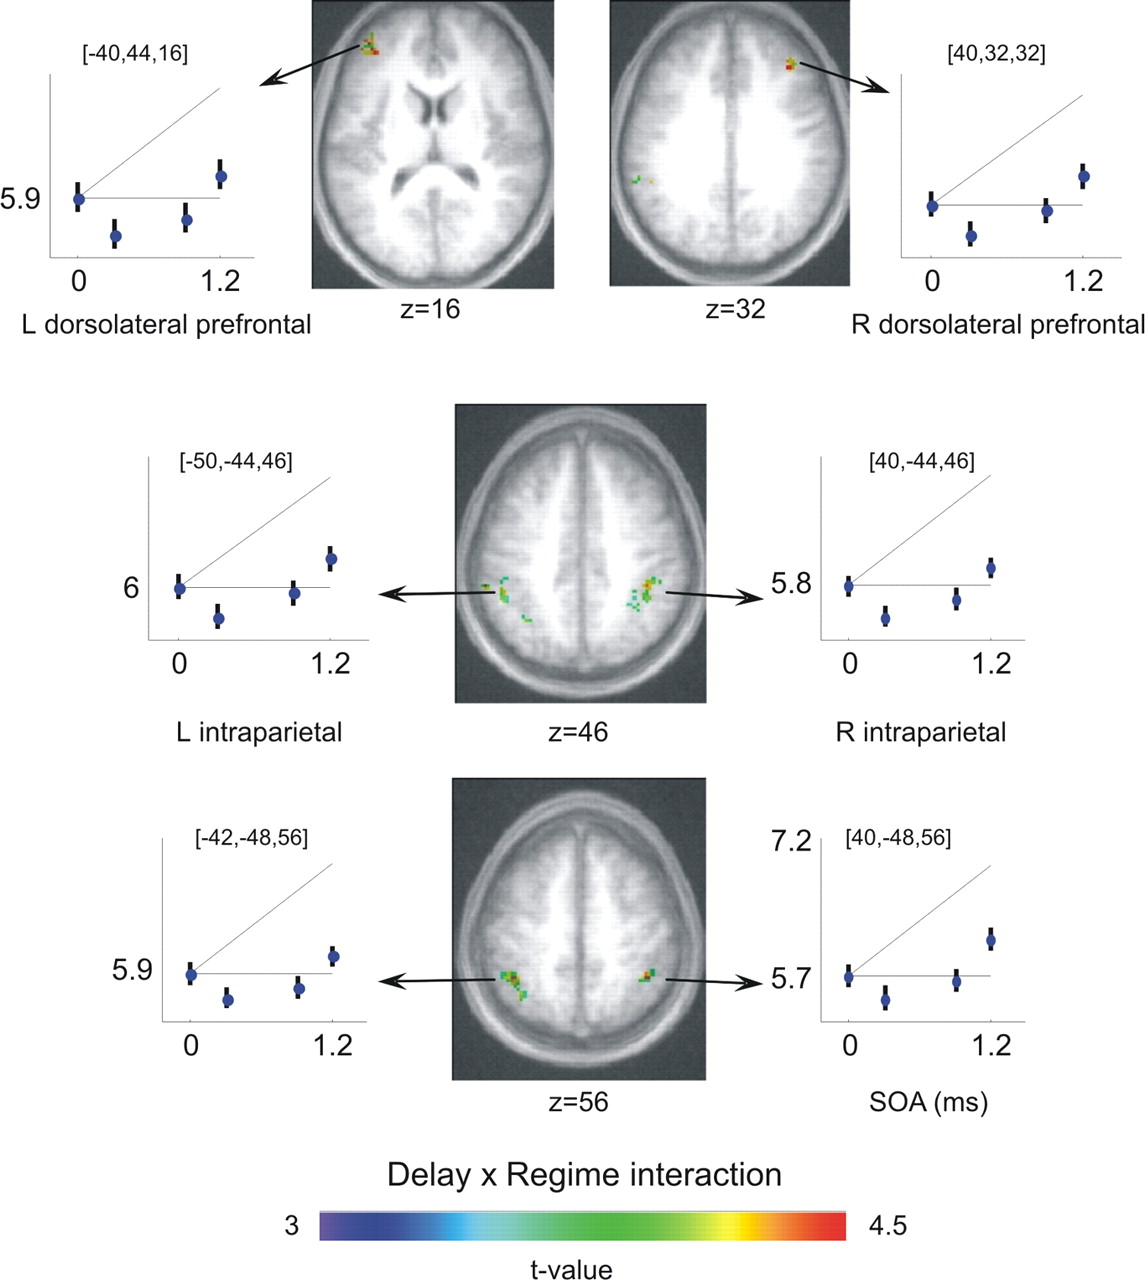
Nonlinear temporal delays reflecting dual-task interference in fMRI. Axial slices show the regions in which a significant interaction between delay and interference regime was found, indicating a PRP interference pattern. This frontoparietal network includes the superior parietal cortex [peaks at (36, −44, 40) and (40, −48, 54)] and left and right dorsolateral PFC [peaks at (−40, 44, 16) (left) and a small cluster at (40, 32, 32) (right)]. L, Left; R, right.
Parsing of brain networks by their phase profile
The previous analysis separated three types of brain areas depending on their lack of variation, linear variation, or nonlinear profile of phase as a function of SOA. We next show that a quantitative analysis of the linear and nonlinear dependence of the phase can serve to identify regions involved in different processing stages of the dual task and thus to parse the active network into different processing stages according to their timing characteristics. Such a quantitative analysis is possible because the phase extracted from our fMRI analysis is a quantitative parameter, expressed in seconds, and the serial bottleneck model makes quantitative predictions as to how it should vary with SOA for different types of brain regions.
The simplest case is for regions devoted exclusively to the first task. Here, phase should not change with SOA. Thus, these regions should show neither a linear nor a nonlinear increase of phase with SOA. On a plane defined by the linear contrast on the x-axis, and the nonlinear contrast on the y-axis, such regions should fall close to the origin. Second, similarly, the phase of regions corresponding to parallel stages of task 2 should show a purely linear increase of phase with SOA, without any nonlinear dependence. Third, regions engaged solely in the bottleneck of task 2 (as well as postbottleneck task 2 processing) should show both a linear and a nonlinear effect, corresponding to the theoretical dependence exhibited by RT2 and described in Figure 1.
In addition to these three phase profiles, we also expect more complicated patterns. Regions involved in both tasks should show an increase of phase corresponding approximately to one-half of those indicated by regions corresponding to task 2 (assuming that task 1 and task 2 cause approximately similar amplitudes of activation). Because the two tasks involved distinct modalities of input and output, we did not expect any regions to be shared at the perceptual or response level, but we did expect that areas responsible for the dual-task bottleneck might be shared between the two tasks, in which case they would show significant linear and nonlinear contrasts, but with a quantitative variation in phase approximately halved compared with the variation observed in RT2. Finally, because the ERP data had indicated some departures from the simple bottleneck model, here we investigated whether any regions showed a purely nonlinear component, i.e., a full crossover interaction with an increase in phase at the shortest SOA, as might be expected if this SOA requires a specific engagement of task-coordination processes.
Following this logic, we parsed the active network in regions with different timing characteristics by projecting all active voxels onto a two-dimensional plane defined by the value of the linear (x-axis) and nonlinear (y-axis) contrasts for phase as a function of SOA (Fig. 8). The contrasts were scaled to permit quantitative predictions. For the linear contrast, a value of 0 indicated no variation in phase with delay, and a value of 1 indicated a 1:1 linear relation between injected delay and observed phase. For the interaction contrast, a value of 0 indicated no interaction (linear relation between phase and delay), a value of 1 indicated an interaction quantitatively equal to expectations from the PRP model for a central T2 process (no increase of phase within the interference regime, linear increase in phase outside the interference regime), and a value of 2 indicated a full crossover interaction. We then performed a Voronoi tessellation, determined by the distances to the five canonical points described previously: (1) no linear nor nonlinear response (blue), (2) purely linear response (yellow), (3) linear and nonlinear response with slope of 1 (red), (4) linear and nonlinear response with slope of ½ (cyan), and (5) purely nonlinear response with slope of 2 (green). This analysis defined five voxel types according to their timing properties, and their cerebral distribution was examined by color coding (Fig. 8). For simplicity, we only considered the resulting spatial clusters that exceeded 200 voxels.

Clustering of brain regions by their temporal properties. To parse the active network in regions with different timing characteristics, all active voxels were projected onto a two-dimensional plane defined by the value of the linear (x-axis) and nonlinear (y-axis) contrasts for phase as a function of SOA and classified according to a Voronoi tessellation, determined by the distances to the five canonical points determined by the PRP model (see Results for details) in five categories: (1) no linear nor nonlinear response (blue) (expected profile of regions involved in execution of task 1); (2) purely linear response (yellow) (expected profile of regions of task 2 that can be active simultaneously during the execution of task 1); (3) linear and nonlinear response with slope of 1 (red) (expected profile of regions of task 2 that reflect a serial bottleneck); (4) linear and nonlinear response with slope of ½ (cyan) (expected profile of regions shared by both tasks); and (5) purely nonlinear response with slope of 2 (green) (expected profile of regions that show a delay during simultaneous presentation of auditory and visual stimuli). Insets, The anatomical projection as well as a representative phase profile of each cluster.
The functional neuroanatomy of the five parsed networks (Fig. 8) was, for the most part, in tight accordance with the theoretical predictions. The first cluster (blue, no phase variation) comprised regions in extrastriate visual cortex, left motor cortex, and the most medial part of the posterior parietal cortex, as well as an extended subcortical network. This network plausibly corresponds to T1 task processing (visual number comparison with a right-hand response). The second cluster (yellow, slope 1 linear phase response) involved only bilateral auditory cortex, including Heschl's gyrus and more lateral regions of temporal cortex, a plausible network for the perceptual stages of the T2 task of auditory pitch judgment. The third cluster (red, slope 1 nonlinearity corresponding to T2-only bottleneck and postbottleneck areas) included the right motor cortex, right SMA (remember that target T2 is responded to with the left hand), and bilateral intraparietal activation. Interestingly, this cluster also included the most medial parts of the visual cortex. This unexpected finding might relate to the fact that subjects resumed attention to the fixation cross after conclusion of the two tasks.
The fourth and most theoretically relevant cluster (cyan; slope ½ nonlinearity corresponding to bottleneck areas shared by T1 and T2) involved an extended bilateral network that included the bilateral posterior parietal cortex, premotor cortex, SMA, anterior part of the insula, and the cerebellum. This cluster corresponds to the center of the Voronoi diagram, and hence there might be a bias for noisy and less reliable responses to be mapped by default to this cluster. Thus, we cannot exclude the possibility that some of these voxels might belong to other stages. However, most of this network showed precise phase dependence with a slope of ½, suggesting that a large amount of the dual-task network was shared by both tasks during dual-task performance.
Finally, the fifth cluster (green, purely nonlinear phase variation) involved exclusively a bilateral frontoparietal network. This network has been previously involved as responsible for processing bottleneck in dual-task performance (Marois et al., 2000; Marois and Ivanoff, 2005; Dux et al., 2006), is engaged in effortful but not in automatic tasks (Ashbridge et al., 1997), and is ubiquitously present in a large variety of goal-directed tasks (Duncan and Owen, 2000). Although it is therefore not surprising to find these regions associated with the purest form of PRP interaction, it is not entirely clear why they should exhibit a slower response at SOA = 0 than at SOA = 300 ms, especially because such a pattern is not seen in response times. One possibility is that the SOA = 0 is special because it is the only condition in which the stimuli are not ordered. Thus, it may involve the deployment of additional higher-level control, both during and after T1 and T2 processing, to impose the appropriate task order (Sigman and Dehaene, 2006).
Relation to single-task processing
Although our analysis identified subtle timing differences in dual-task execution, there are certain specific situations that it cannot disambiguate. Specifically, we cannot distinguish between timing patterns that yield the same dependence of the temporal center of mass of neural activation as a function of SOA. For instance the phase dependency of voxels in the fourth cluster (slope of ½, which we identified as voxels participating in both tasks) could also be found in a region with a phasic response at the end of task 1 (for instance, involved in task disengagement) and another phasic response at the beginning of task 2 (for instance, for task engagement). To resolve this ambiguity, we explored the relation between the dynamics in the dual-task experiment and the activations in single-task execution (of T1 and of T2). We asked whether the voxels identified by fMRI timing analysis as belonging to both tasks were indeed active during either task alone, or whether some voxels were solely active in relation to the requirements of dual-task execution. To this aim, we investigated the overlap of the five clusters identified by the fMRI timing analysis of the activation observed when subjects were engaged in only one task at a time, obtained in an independent fMRI run, in which the same subjects performed the number and sound tasks on separate trials. Number and sound trials alternated randomly in a fast event-related design. We also intermixed blank trials in which the fixation cross dimmed, to account for possible effects of the dimming of the fixation cross as well as of task-setting mechanisms.
Figure 9A shows the regions differentially involved in the number and sound tasks (positive t values, number > sound; negative t values, sound > number). These were highly consistent with previous findings. Activation in motor cortex as well as in SMA was contralateral to the response hand, whereas activation in the cerebellum was ipsilateral. We observed a massive activation in superior temporal cortex, including primary auditory cortex, for the sound relative to the number task. In the converse direction, lateral occipital/fusiform cortex was more active in the number task, although no significant difference was seen in medial occipital cortex (area 17/18). This finding is consistent with the observation that the lateral occipital, but not the medial occipital cortex, showed phase invariance characteristic of exclusive task 1 performance.

Comparison of dual-task and single-task responses. A, Regions differentially involved in the number and sound tasks (positive t values, number > sound; negative t values, sound > number). Activation in motor cortex as well as in SMA was contralateral to the response hand, whereas activation in the cerebellum was ipsilateral. A massive activation is observed in superior temporal cortex, including primary auditory cortex, for the sound relative to the number task. In the converse direction, lateral occipital/fusiform cortex was more active in the number task, although no significant difference was seen in medial occipital cortex (area 17/18). B, To investigate the relation of each of the five clusters obtained in the dual-task analysis to these single-task activations, the voxels from each dual-task cluster were projected onto a scatter-plot plane in which the x-coordinate represents the single-task activation to the sound task (T2) and the y-coordinate represents the single-task activation to the number task (T1). C, Each scatter plot was collapsed to a histogram, counting the fraction of voxels within each individual cluster as a function of the t value of the number–sound contrast on the single-task runs. The vertical line indicates the mean of each distribution. The first cluster type (blue, no phase variation) had a major overlap with the T1 task (number task), including a subset of voxels strongly activated in the number task but virtually inactive in the sound task. The second cluster type (yellow, purely linear) involved exclusively regions strongly activated by the sound task but inactive during the number task. The third cluster type (red, linear and nonlinear variation corresponding to T2-only bottleneck and postbottleneck areas) also involved voxels with dominant activation for the T2 task (sound task). The fourth (cyan, slope ½ nonlinear corresponding to shared bottleneck areas) and fifth (green, purely nonlinear PRP effect) cluster types showed positive and positively correlated activations in both tasks.
We then investigated quantitatively the relation of each of the five clusters obtained in the dual-task analysis to single-task activations. We emphasize that the dual-task clusters were identified purely on the basis of their temporal profile: all dual-task activations occurred in response to a mixture of visual and auditory stimuli separated by 1.2 s at most. The PRP model predicts that voxels with different temporal properties during dual-task processing should be involved in different stages of the individual tasks. We explored this hypothesis by projecting the voxels from each dual-task cluster onto a new scatter-plot plane in which the x-coordinate represents the single-task activation to the sound task (T2) and the y-coordinate represents the single-task activation to the number task (T1) (Fig. 9B). We also collapsed these data in histograms, in which we counted the fraction of voxels within each individual cluster as a function of the t value of the number–sound contrast on the single-task runs (Fig. 9C).
As expected from the PRP model, we observed that the first cluster type (blue, no phase variation) had a major overlap with the T1 task (number task). The scatter plot, in particular, comprised a subset of voxels strongly activated in the number task but virtually inactive in the sound task. The second cluster type (yellow, purely linear) involved exclusively regions strongly activated by the sound task, but inactive during the number task. The third cluster type (red, linear and nonlinear variation corresponding to T2-only bottleneck and postbottleneck areas) also involved voxels with dominant activation for the T2 task (sound task), yet often with a positive activation for the T1 task too. Finally, the fourth (cyan, slope ½ nonlinear corresponding to shared bottleneck areas) and fifth (green, purely nonlinear PRP effect) cluster types showed positive and positively correlated activations in both tasks.
In summary, the cyan and green voxels in Figure 8 fulfill two independent criteria: they belong to the intersection of activations observed during the processing of either task in isolation, and they show a nonlinear phase relation characteristic of the PRP during dual-task performance. These areas, which form an extended parietoprefrontal network, are thus highly likely to play a causal role in dual-task interference.
Although an overall correspondence was found between the single-task and dual-task results, close examination of Figure 9 reveals several instances of deviation from the expected pattern (for instance, cyan voxels showing an interaction profile of phases during dual-task processing, yet no activity during either single task). Further experiments would be needed to understand these deviations, which could arise from a number of differences between the single- and dual-task conditions (e.g., random vs predictable order of the two targets).
Discussion
We used time-resolved EEG and fMRI to probe the cerebral mechanisms of dual-task interference. Both methods converged to support a simple model that accounts for the major part of our observations: a central decision-related processing stage establishes a strictly serial bottleneck, whereas early perceptual processes occur in parallel as soon as a stimulus is delivered. Some specific observations, however, revealed important departures from the model and implied the involvement of additional executive components for task engagement and coordination.
Processing of T1 was unaffected by the joint presentation of T2 at various time intervals. fMRI also indicated that the total level of brain activation, whether evoked by T1 or T2, was unaffected by SOA. Thus, dual-task interference merely affected the temporal organization of brain activation. In both fMRI and ERPs, auditory activation evoked by T2 was time locked to the onset of auditory stimulation, even when T2 was presented during the T1 task. The fine temporal resolution of ERPs suggested that this perceptual processing stage lasted ∼250 ms. At this point, a large, P3-like component was rigidly delayed, reflecting a bottleneck and serial processing. fMRI related this effect to an extended network of distributed areas, mostly located in bilateral parietal and prefrontal cortices, within which subtle timing differences could be observed. Many of these areas were jointly activated by the T1 and T2 tasks performed in isolation, suggesting that they form a central processing network shared by various tasks and responsible for the dual-task bottleneck.
Our results extend previous ERP studies of the PRP, all of which agree that it does not delay the initial P1 and N1 sensory events, although their amplitude may be reduced (Brisson et al., 2007). The N2PC, associated with attention deployment, is also sharply attenuated but with little or no delay (Brisson and Jolicoeur, 2007; Brisson et al., 2007). On the contrary, the lateralized readiness potential, which indexes motor preparation, is rigidly delayed by an amount comparable to response time (Osman and Moore, 1993; Jentzsch et al., 2007). Such a “bracketing” of the PRP effect on both sensory and motor sides is compatible with a main locus of interference at the stage of response selection, in agreement with psychological theorizing (Pashler, 1984; Pashler and Johnston, 1989; Sigman and Dehaene, 2005). Yet previous studies have not identified a clear ERP component associated with this central stage. The novelty P3 component, a subtraction wave evoked by unexpected infrequent stimuli that forms a subset of the main P3, is delayed during the PRP, but only by ∼70 ms (Luck, 1998; Arnell et al., 2004; Dell'acqua et al., 2005; Sessa et al., 2007), an interval considerable smaller than the delay observed in response times [although Dell'acqua et al. (2005) found the two delays to be correlated].
With respect to this background, our study is the first to examine the entire profile of the ERP rather than a reduced subtraction. This analysis demonstrated that the bulk of the late evoked potential, which is dominated by a P3-like late positive complex, is in fact delayed by an amount comparable to the PRP effect on RTs. Time-resolved fMRI confirms that the PRP delay on parietal and prefrontal activation can be as large as several hundreds of milliseconds. In fact, a surprising finding was that the fMRI delay, in dorsolateral prefrontal and intraparietal cortices, exceeded the PRP delay at the shortest SOA (Fig. 7), which may indicate the deployment of additional higher-level control when T1 and T2 occur simultaneously, perhaps to impose the appropriate task order (Sigman and Dehaene, 2006).
Recently, it has been proposed that the P3 may be related to access to a global workspace associated with conscious reportability (Sergent et al., 2005; Del Cul et al., 2007). According to this theory, a distributed set of neurons with long axons provides a global “broadcasting” system enabling communication between arbitrary and otherwise not directly connected brain processors (Baars, 1989; Dehaene et al., 1998; Dehaene and Naccache, 2001). Global workspace theory can explain why response selection generally imposes a dual-task bottleneck. In most psychological tasks, the relation between stimuli and responses is entirely arbitrary and thus requires the temporary mapping between otherwise independent processors. Establishing such a new arbitrary interconnection should involve central workspace mediation. Supporting this interpretation, interference is drastically reduced for highly practiced or nonarbitrary tasks (Lien et al., 2002, 2005; Greenwald, 2003).
Our fMRI results indicate that a large parietofrontal network shows delayed activity during the PRP. This is compatible with much fMRI literature on the brain mechanisms of central capacity limits (Marois and Ivanoff, 2005). However, the majority of these previous neuroimaging studies are not time resolved and relied on indirect means of identifying the cerebral substrates of the PRP. When contrasting short versus long SOAs, no difference is seen in the total amount of fMRI activation (Jiang et al., 2004), unless subjects engage more attentional resources to compensate for the interference, in which case a right inferior frontal increase is seen (Jiang, 2004; Jiang et al., 2004). Such lack of activation differences is expected by the PRP model, which predicts only subtle timing differences. A single fMRI study has investigated the temporal delays in fMRI activation during the PRP (Dux et al., 2006). Dux et al. (2006) used a design in which a difficult T1 task imposed an extended delay, which led to a detectable delayed peak of activation in left posterolateral prefrontal cortex associated with the PRP. However, the method was not very sensitive and only permitted analysis of few regions of interests. The present fMRI method goes beyond this previous work, because it permits whole-brain voxel-based analysis and provides highly sensitive between-subjects statistics. This allowed us to extend this previous finding, showing that the delay of the PRP holds for a broad array of bilateral parietal and frontal regions. The precise quantitative dependence of the temporal activation of this large cluster is in good agreement with the delay observed in the P3 component: no delay during the interference regime, and a delay of 300 ms during the noninterference regime. This finding suggests that these independent measures may be reflecting a common cerebral substrate.
More importantly, we achieved a full parsing of the responsive network, identifying distinct processing stages beyond the serial bottleneck. A massive cluster in the superior temporal cortex reflected perfect parallel processing, firmly constraining the extension of the cerebral locus of the bottleneck. Although this region was the natural candidate for a parallel sensory stage, the extent to which sensory areas may participate to the central bottleneck may vary according to task requirements. Recordings from the primary visual cortex of awake monkeys have shown that a visual stimulus evokes a first transient response, determined by stimulus properties and unaffected by attention, followed by a second wave of activity, which is modulated by stimulus visibility, affected by a concurrent stimulus (Kovács et al., 1995; Lamme et al., 2002) and suppressed by anesthetics (Lamme et al., 1998). This specificity suggests an engagement of the central workspace system, and thus, that the same neuron may be involved in distinct processing stages within the same task (Gilbert and Sigman, 2007). Further experiments are required to determine whether this second wave of activity shows a dual-task delay characteristic of the serial processing bottleneck.
Cognitive theories differ as to the exact nature of the processes causing the PRP bottleneck. It might be a response selection process (Pashler, 1984) or it might involve a more extended set of processes, including executive components of task engaging and disengaging (Allport et al., 1994; Meiran et al., 2000; Logan and Gordon, 2001; Ruthruff et al., 2001; Sigman and Dehaene, 2006; Jentzsch et al., 2007) as well as delays in response initiation (De Jong, 1993, 1995; Sigman and Dehaene, 2006).
Although the vast majority of the data could be accounted for by a simple passive bottleneck model, with serial queuing on a “first-come, first-served” basis, some aspects of the data went beyond such a simple model. We therefore suggest that the “extended bottleneck” view is most compatible with our results, for at least two reasons. First, the extended array of areas affected by the PRP suggests that a broad array of processes cause the delay. Although this large set of areas might implement just a single cognitive stage of response selection, it seems more likely to correspond to the deployment of multiple hierarchically organized executive operations (Koechlin et al., 2003; Koechlin and Jubault, 2006). Second, we observed an explicit T2-related ERP at the end of T1 processing, in advance of the T2 stimulus, and a modulation of the amplitude of the early T2-evoked perceptual components with SOAs. These findings suggest that at least part of the acceleration of RT2 with SOA is attributable to the deployment of active task-switching and stimulus expectancy processes. The time-resolved methods that we introduced here provide basic tools with which to further explore these open issues.
Footnotes
-
This work was supported by Inserm, Commissariat à l'Energie Atomique, and the Human Frontiers Science Program. We gratefully acknowledge the contributions of Martin Graziano and of members of the Cognitive Neuroimaging Unit, particularly Ghislaine Dehaene-Lambertz, Antoinette Jobert, Marco Buiatti, and Antoine Delcul. Denis Le Bihan provided essential administrative support.
- Correspondence should be addressed to Mariano Sigman, Integrative Neuroscience Laboratory, Physics Department, University of Buenos Aires, University City, Pabellon I, 1428 Buenos Aires, Argentina. sigman{at}df.uba.ar
References
- Allport et al., 1994.↵
- Arnell and Duncan, 2002.↵
- Arnell et al., 2004.↵
- Ashbridge et al., 1997.↵
- Baars, 1989.↵
- Bellgowan et al., 2003.↵
- Borger, 1963.↵
- Brisson and Jolicoeur, 2007.↵
- Brisson et al., 2007.↵
- De Jong, 1993.↵
- De Jong, 1995.↵
- Dehaene and Naccache, 2001.↵
- Dehaene et al., 1998.↵
- Del Cul et al., 2007.↵
- Dell'acqua et al., 2005.↵
- Duncan and Owen, 2000.↵
- Dux et al., 2006.↵
- Formisano and Goebel, 2003.↵
- Gilbert and Sigman, 2007.↵
- Greenwald, 2003.↵
- Jentzsch et al., 2007.↵
- Jiang, 2004.↵
- Jiang et al., 2004.↵
- Kim, 1997.↵
- Koechlin and Jubault, 2006.↵
- Koechlin et al., 2003.↵
- Kovács et al., 1995.↵
- Lamme et al., 2002.↵
- Lamme et al., 1998.↵
- Lien et al., 2002.↵
- Lien et al., 2005.↵
- Logan and Gordon, 2001.↵
- Luck, 1998.↵
- Marois and Ivanoff, 2005.↵
- Marois et al., 2000.↵
- Meiran et al., 2000.↵
- Menon et al., 1998.↵
- Meyer and Kieras, 1997.↵
- Osman and Moore, 1993.↵
- Pashler, 1984.↵
- Pashler, 1994.↵
- Pashler and Johnston, 1989.↵
- Pashler and Johnston, 1998.↵
- Pashler et al., 2001.↵
- Raichle et al., 2001.↵
- Ruthruff et al., 2001.↵
- Sergent et al., 2005.↵
- Sessa et al., 2007.↵
- Sigman and Dehaene, 2005.↵
- Sigman and Dehaene, 2006.↵
- Sigman et al., 2007.↵
- Tombu and Jolicoeur, 2005.↵
- Welford, 1967.↵


