

Article Figures & Data
Figures
- Figure 1.
Complex spikes triggered by CF stimulation can be reproduced by somatic dynamic clamp. A, Recording configuration illustrated using an image of a biocytin-filled Purkinje cell. Somatic electrodes (blue and red) and a CF-stimulating electrode in the granule cell layer (gray) are shown. B, Complex spike responses of Purkinje cell shown in A, evoked by 1 Hz stimulation of its CF. Overlay of multiple sweeps (gray) and a single representative example (red). C, Simultaneous dual somatic dynamic-clamp configuration, with one electrode used to record voltage (red) and the other to inject current (blue). D, Responses (left) of the same cell as in A to injection of synaptic-like conductances of increasing amplitude (right, biexponential waveform, τrise = 0.3 ms, τdecay = 3 ms, peak amplitudes as indicated beside traces). Note that by choosing the appropriate conductance amplitude (150 nS), the complex spike evoked by CF stimulation could be mimicked. E, F, Timing (E) and amplitude (F) of spikes (measured with respect to the first spike, for the first, second, and third spikes) within the complex spikes evoked by CF stimulation and by the 150 nS synaptic-like conductance. Spike times differed by <17%; amplitudes differed by <4%. stim, Stimulation.
- Figure 2.
Dendritic spikes are not necessary for the generation of the complex spike. A, Simultaneous dendritic and somatic patch-clamp recording (blue electrodes) during both climbing fiber stimulation (gray electrode) and two-electrode somatic dynamic clamp. B, CF response of cell shown in A recorded simultaneously at the soma (bottom traces) and 110 μm away in the dendrites (top traces). Complex spikes at the soma are accompanied by characteristic dendritic calcium spikes. C, Response of same cell to 150 nS somatic dynamic clamp. Somatic complex spikes generated by dynamic clamp are well matched to CF-evoked responses (spike times differed by <18%, amplitudes by <10%), but no dendritic spikes are observed. D, Average amplitude and dV/dt of dendritic events triggered in response to CF stimulation or equivalent somatic dynamic clamp (n = 13 cells; significantly different, p < 10−7). Open circles show single-cell averages (data shown in B and C are highlighted in red); bars show the mean ± SEM of the total data. stim, Stimulation.
- Figure 3.
Dendritic spikes have only a weak influence on the somatic complex spike triggered by CF stimulation. A, Recording configuration of experiment. The dendritic recording electrode was 80 μm from the soma. B, Multiple superimposed CF responses recorded at the soma (bottom) and dendrite (top) of the cell in A. Left, Responses with one dendritic spike (4 sweeps); right, responses with two dendritic spikes (5 sweeps). Note that in this example, somatic spiking is the same regardless of the number of dendritic spikes, and that the second dendritic spike only produces a small response at the soma. C, A second example in which dendritic spikes have a stronger effect on the soma. The dendritic recording electrode was 125 μm from the soma. D, Threshold for a second dendritic spike occurred when a somatic holding current of −160 pA was applied (left: 1 spike, 29 sweeps; right: 2 spikes, 32 sweeps). In some CF responses, a second dendritic spike triggered an additional somatic spike (0.81 ± 0.10 spike added). Responses in which the second dendritic spike occurred <2 ms after a somatic spike are shown in red; in these cases, either no further somatic spike or only a small somatic spikelet occurred. E, Average number of somatic spikelets triggered by an extra dendritic spike. “B,” “D,” Mean ± SD of the data shown in B and D; “all data,” averages from individual datasets (circles) and weighted mean ± SEM of all datasets (n = 21; bar). On average, 0.24 ± 0.09 additional somatic spikes (significantly different from 0, p <0.01) were triggered by an extra dendritic spike. Calibration in D also applies to B.
- Figure 4.
Dendritic spikes have only a weak influence on the somatic complex spike triggered by somatic dynamic clamp. A, Illustration of the experiment; during two-electrode dynamic-clamp injection of synaptic-like conductance (τrise = 0.3 ms; τdecay = 3 ms) to the soma, dendritic current at threshold for triggering a second dendritic spike was injected (biexponential of τrise 0.5 ms and τdecay 5 ms, together with tonic depolarizing current). B, Responses of Purkinje cell (A) to a somatic synaptic-like conductance (200 nS) and a simultaneous biexponential dendritic current (3 nA). Tonic current injection (80 pA) to the dendrite (125 μm) took the cell to threshold for generating a second dendritic calcium spike. The layout is as in Figure 3B. The second dendritic spike (right-hand column) triggered no further somatic spikelets. C, Average number of somatic spikelets triggered by an extra dendritic spike during somatic dynamic clamp. “B,” Mean ± SD of the data shown in B; “all data,” individual dataset averages (circles) and weighted mean ± SEM of all datasets (bar; n = 19). On average, 0.1 ± 0.1 somatic spikes (not significantly different from 0, p = 0.37) were triggered by an extra dendritic spike.
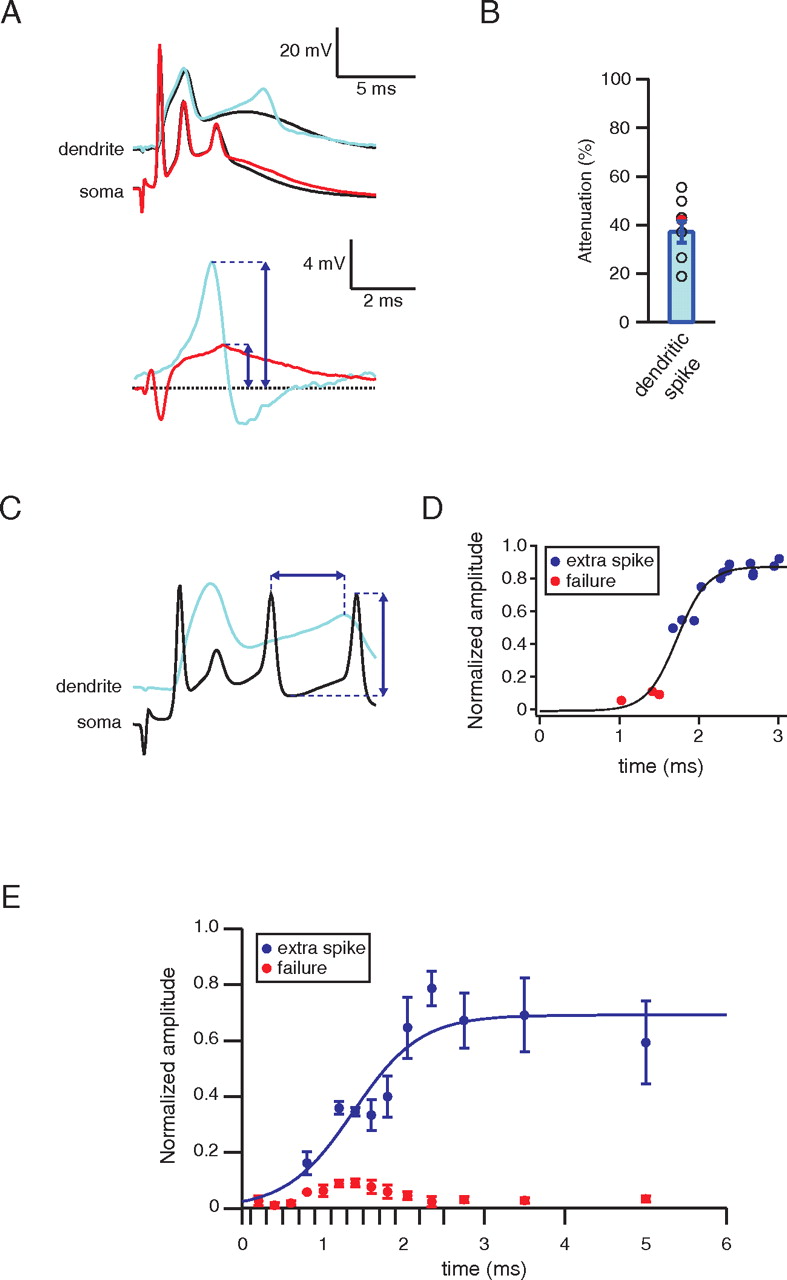
- Figure 5.
Dendritic spikes are highly attenuated and often occur within the somatic refractory period. A, Method used to measure attenuation of dendritic spikes during the complex spike. Top, Example response with an extra dendritic spike, recorded simultaneously in the dendrite (light blue; 142μm from soma) and soma (red; traces offset for clarity); also shown are dendritic and somatic averages of events without extra dendritic spikes but with similar somatic firing pattern (black). Bottom, Subtraction of these averages from the sweeps with extra spikes reveals the depolarization in the dendrite (light blue) and the soma (red) caused by the extra dendritic spike. The peak differences in depolarization were measured (blue arrows) at both locations, and attenuation was calculated as somatic depolarization as a percentage of dendritic depolarization. B, Attenuation of extra dendritic spikes in individual datasets (open symbols; red symbol indicates data shown in A) and in the whole population (blue bar; mean ± SEM). C, Illustration of the measurements made of dendritic spike time and resulting somatic event amplitude. Horizontal arrow, Time between the extra dendritic spike and the spike preceding the somatic event. Vertical arrow, Somatic event amplitude, measured as difference between preceding trough minimum and event maximum; this amplitude is normalized by the amplitude (above average baseline Vm) of the first spike of the complex spike. D, Dependence of somatic event amplitude on dendritic spike latency, as illustrated in C, for the data shown in Figure 3D. Red circles, Cases in which an extra dendritic spike failed to trigger a spike, generating only a subthreshold depolarization; blue circles, cases in which an extra spike triggered a somatic spike. The refractory trend is highlighted by a sigmoidal fit (black line); half- maximum = 1.7 ms. E, Dependence of somatic event amplitude on dendritic spike latency (n = 19 datasets), binned according to the time intervals marked by the x-axis ticks. Red and blue symbols are as in D. The refractory trend is highlighted by a sigmoidal fit to extra spike data, constrained to a baseline amplitude of 0; half-maximum = 1.4 ms.
- Figure 6.
Dendritic calcium spikes regulate the post-complex spike pause. A, Example of data collected at threshold for generating a second dendritic calcium spike in response to CF stimulation (grouped according to the number of dendritic spikes), on a time scale that shows the post-complex spike pause. Top, One dendritic spike; bottom, two dendritic spikes; left, dendritic recordings (60 μm from the soma); right, somatic recordings. Arrows indicate pause duration (time between the last spikelets in the complex spike and the next spontaneous spike) measured in the red example sweeps. An extra dendritic spike increased the pause from 28.0 ± 17.9 to 50.0 ± 12.7 ms (p < 0.01). B, Average increase in pause duration triggered by an extra dendritic calcium spike (in milliseconds). Symbols show averages of individual datasets (dataset shown in A highlighted in red); bar indicates weighted mean ± SEM of the population data (n = 11; significantly different from 0, p < 0.0005). C, Average increase in pause duration triggered by an extra dendritic calcium spike (as a percentage of pause duration without extra dendritic calcium spike). Symbols and bars are as in B (n = 15; significantly different from 0, p < 0.005).
- Figure 7.
Dendritic spikes regulate the AHP after the complex spike. A, Dendritic recording (155 μm from the soma) of responses to CF stimulation collected at threshold for generating a second dendritic calcium spike (blue, 1 dendritic spike; red, 2 dendritic spikes). The black arrow indicates the measured difference in AHP amplitude; red and blue arrows mark the time of somatic action potentials (reflected as small depolarizations in the dendritic recording) that terminate the post-complex spike pause in the one- and two-dendritic-spike traces, respectively. B, Average dendritic AHP (minimum dendritic membrane potential reached during the pause minus average baseline dendritic membrane potential preceding CF stimulation) after CF stimulation that evokes, at threshold, one or two dendritic calcium spikes. Lines connect one- and two-spike data from the same set; the dataset shown in A is highlighted in color. C, Average change in AHP amplitude caused by an extra dendritic spike. Circles show averages of individual datasets (dataset shown in A highlighted in red); bar indicates weighted mean ± SEM of the population data (n = 11; significantly different from 0, p < 0.001). D, Relationship between post-complex spike pause duration and dendritic AHP amplitude. Each data point represents a single measurement made after CF stimulation at threshold for generating an extra dendritic spike (n = 11 cells; blue symbols, 1 dendritic spike; red symbols, 2 dendritic spikes). The black line indicates the negative correlation between pause length and AHP depth (r = −0.89; p < 10−16). dend, Dendritic.
- Figure 8.
All spikelets of the complex spike originate in the axon. A, Biocytin-filled Purkinje cell indicating the location of the somatic (blue) and axonal (red) recording electrodes for the data shown in B and C. The axonal electrode was located at 55 μm from the soma. The CF stimulation electrode is also illustrated (gray). B, Simultaneous cell-attached recordings made from the soma and axon during CF stimulation (arrow), which generates a complex spike with four spikelets. C, Averages for each spikelet of the complex spike generated by aligning data to the peak of the somatic capacitive current, indicated by the dotted line.


Additional Files
Supplemental Data
Files in this Data Supplement:
- supplemental material - Supplemental Figure 1
- supplemental material - Supplemental Figure 2
- supplemental material - Supplemental Figure 3
- supplemental material - Supplemental Figure 4


