

Abstract
Subthreshold somatic depolarization has been shown recently to modulate presynaptic neurotransmitter release in cortical neurons. To understand the mechanisms underlying this mode of signaling in the axons of dentate granule cells (hippocampal mossy fibers), we have combined two-photon Ca2+ imaging with dual-patch recordings from somata and giant boutons forming synapses on CA3 pyramidal cells. In intact axons, subthreshold depolarization propagates both orthodromically and antidromically, with an estimated length constant of 200–600 μm depending on the signal waveform. Surprisingly, presynaptic depolarization sufficient to enhance glutamate release at mossy fiber–CA3 pyramidal cell synapses has no detectable effect on either basal Ca2+-dependent fluorescence or action-potential-evoked fluorescence transients in giant boutons. We further estimate that neurotransmitter release varies with presynaptic Ca2+ entry with a 2.5-power relationship and that depolarization-induced synaptic facilitation remains intact in the presence of high-affinity presynaptic Ca2+ buffers or after blockade of local Ca2+ stores. We conclude that depolarization-dependent modulation of transmission at these boutons does not rely on changes in presynaptic Ca2+.
- synaptic transmission
- mossy fiber
- analog modulation
- hippocampus
- dual-patch recordings
- biophysical modeling
Introduction
Transient subthreshold depolarization of dentate granule cells enhances transmitter release at remote synapses formed by axons [mossy fibers (MFs)] on CA3 pyramidal cells in the hippocampus (Alle and Geiger, 2006). Surprisingly, the estimated 40–45% enhancement of transmission is not accompanied by a detectable change in presynaptic Ca2+ currents recorded from giant MF boutons in whole-terminal mode (Alle and Geiger, 2006). In contrast, electrotonic facilitation of transmission between cortical pyramidal cells does involve an enhanced presynaptic Ca2+ signal (Shu et al., 2006). A possible explanation for the paradoxical absence of change in evoked Ca2+ currents at giant MF boutons is that the enhancement in neurotransmitter release relies on changes in resting Ca2+ and/or Ca2+ release from internal stores (Lauri et al., 2003; Scott and Rusakov, 2006). However, chelation of presynaptic Ca2+ using a high concentration of EGTA (10 mm) only led to a nonsignificant attenuation of this enhancement (Alle and Geiger, 2006), casting doubt on the role of intraterminal Ca2+ sources in electrotonic facilitation of neurotransmitter release.
To address the mechanisms of analog modulation of neurotransmitter release from MF boutons more directly, here we assess the effects of presynaptic depolarization on Ca2+ kinetics in MF boutons using two-photon excitation microscopy. We have previously shown that long-term (minutes) changes in granule cell membrane potential affect both resting Ca2+ and action-potential-evoked Ca2+ entry in MFs within 100–200 μm of the soma (Ruiz et al., 2003) but not as far as area CA3 (Scott and Rusakov, 2006). However, long-term depolarization potentially alters the state of voltage-gated ion channels (Na+, K+, Ca2+) that shape action-potential-evoked presynaptic Ca2+ currents. These effects might differ from the consequences of short-term depolarization such as studied by Alle and Geiger (2006). To address whether depolarization-mediated facilitation in CA3 involves changes in resting Ca2+ and/or Ca2+ store signaling, we combine Ca2+ imaging with dual-patch recordings from somata and axons of granule cells. We confirm directly that depolarization propagates electrotonically along the entire length of intact axons between the granule cells and giant boutons in CA3. Surprisingly, however, subthreshold depolarization, either local or remote, has no detectable effect on presynaptic Ca2+ signaling (either entering through channels or released from internal sources) in these boutons. Furthermore, depolarization (or high external K+)-induced enhancement of release at these synapses is not affected by buffering presynaptic Ca2+ or by blocking Ca2+ stores, although neurotransmitter release varies with action potential-dependent Ca2+ entry with a power relationship of ∼2.5. The results argue that a Ca2+-independent but voltage-dependent mechanism underlies analog control of transmission at MF synapses.
Materials and Methods
Electrophysiology.
Acute 300 μm hippocampal slices from three- to four-week-old male Sprague Dawley rats were transferred to a submersion-type recording chamber (Scientific Systems Design) and superfused with (in mm) 124 NaCl, 2.5 KCl, 2 CaCl2, 1 MgCl2, 26 NaHCO3, and 10 glucose, and bubbled with 95% O2/5% CO2. The slice orientation that allows intact MFs to be preserved was detailed previously (Scott and Rusakov, 2006). The internal solution included (in mm) 135 K methanesulfonate, 2 MgCl2 10 HEPES, 10 Na-phosphocreatine, 4 NaATP, 0.4 NaGTP, and fluorophores as indicated. Unless specified otherwise, dentate granule cells were held at −80 mV; cells were discarded if their resting potential, in current-clamp mode, increased above −70 mV during the experiment. Single orthodromic escape action currents were evoked by a 2 ms command voltage pulse. Recording sweeps (normally 500 ms long) were collected at 5 kHz with 30 s or 1 min intervals. Experiments were carried at 22–24°C unless specified otherwise; 1 μm tetrodotoxin (TTX) was added where shown. Receptor antagonists were purchased from Tocris Bioscience, and fluorescent probes were purchased from Invitrogen. All animal handling procedures followed current UK regulations.
To record from an individual MF bouton, we approached it (imaged in the Alexa emission channel 50–100 μm deep in the slice) with a patch pipette, in voltage-clamp configuration, and applied negative pressure to achieve loose patch (100–200 MΩ seal resistance). Next, we determined the minimal external command voltage that would induce an action potential in the axon (which invariably evoked a presynaptic Ca2+ transient and an antidromic action current detected at the soma): this voltage was considered to reflect local depolarization up to the spiking threshold, which is ∼25 mV above the resting membrane potential in these boutons (Geiger and Jonas, 2000).
Two-photon excitation fluorescence imaging.
We used a Radiance 2000 or Radiance 2100 imaging system (Zeiss/Bio-Rad) optically linked to a MaiTai femtosecond pulsed infrared laser (SpectraPhysics/Newport) and integrated with patch-clamp electrophysiology (Rusakov and Fine, 2003; Scott and Rusakov, 2006). Granule cells held in whole-cell mode were loaded with two fluorophores: a morphological tracer Alexa Fluor 594 (20–40 μm) and either of two high-affinity Ca2+ indicators, Fluo-4 (200 μm) or Oregon Green BAPTA-1 (OGB-1; 200 μm), as indicated. Fluorophores were excited in two-photon mode at 800 nm. The technique to trace and to identify giant boutons synapsing in the CA3 region 500–1000 μm from the soma is described by Scott and Rusakov (2006). Depending on the task, we focused on presynaptic boutons identified by their distinct morphology and location (Acsády et al., 1998; Scott and Rusakov, 2006), at the maximal optical resolution (∼0.2 μm, 70 nm per pixel). The success rate for imaging a giant MF bouton in CA3 supplied by a given granule cell was <10%. Recordings started at least 30 min after obtaining a whole-cell configuration (Scott and Rusakov, 2006).
Fluorescence line scans were recorded at 500 Hz (500 or 1000 ms sweeps, intersweep interval, 30 s or 1 min) and analyzed off-line. To probe the effects of somatic depolarization, 100-ms-long command voltage pulses were applied at the soma, with an amplitude (30–35 mV) set just below the spike-generation threshold. Where required, a 2 ms spike-generating pulse was also applied 30 or 50 ms after the depolarization onset. In the presence of 1 μm TTX, the pulse amplitude was 100 mV.
The Ca2+-dependent fluorescence response ΔF/F (space integrated over the visible bouton width) was routinely calculated as (Fpost − Fpre)/(Fpre − F0), where F0 denotes the background fluorescence measured outside any cell structures filled with the indicator. Because special care was taken to avoid escape of the dye from the pipette and because the site of imaging was normally at a significant distance from the pipette tip, F0 was likely to represent the average photomultiplier tube dark current (the background fluorescence levels outside and inside the slice were indistinguishable). In the case of subthreshold depolarization pulses, Fpre and Fpost represented the line-scan fluorescence averaged over, respectively, 200 ms before the pulse onset and 100 ms after the onset. In the case of spike generation (30 or 50 ms into the 100 ms long depolarization pulse), Fpre and Fpost were taken, respectively, over the time intervals 50 ms before and 50 ms after the spike onset. Recordings were routinely collected in a cycle of three alternating sweeps: no depolarization; depolarization pulse; depolarization pulse plus spike generation. This experimental design allowed within-duty-cycle comparisons, minimizing time-dependent trends in the measured variable. Image analysis was performed on stacks of stored line-scan images using NIH Image macros. False color tables and averaged images were used for illustration purposes, but the quantitative analyses always dealt with the original (gray level) pixel brightness values. In most experiments, we reconstructed the axon trajectory using a collage of high-resolution Kalman-filtered z-stacks 15–20 μm deep using 10-scan average frames.
Translating steady-state fluorescence changes into Ca2+ concentration changes.
Classically, the steady-state Ca2+ concentration [Ca2+]ss can be estimated from the Ca2+ indicator fluorescence F using the following relationship:
 where Kd is the Ca2+ indicator dissociation constant, and Fmax and Fmin represent the maximum (saturated) and Ca2+-independent (residual) fluorescence of the indicator, respectively. To adopt the experimentally measured quantities, Equation 1 can be recast as follows (Scott and Rusakov, 2006):
 where the parameter values measured previously are as follows. In Fluo-4 (Kd ∼ 350 nm) experiments, Rct/Fmax = 0.237 (relative contribution of Alexa cross-talk fluorescence to the Ca2+ channel emission signal), and F/Fmax = 0.380, Fmin/Fmax ≈ 0 (Scott and Rusakov, 2006); in OGB-1 (Kd ∼ 200 nm) experiments, Rct = 0, F/Fmax = 0.465, and Fmin/Fmax = 0.167 (Maravall et al., 2000; Jackson and Redman, 2003; Oertner and Matus, 2005; Scott and Rusakov, 2006). These data imply the following empirical relationships between a relative fluorescence change F/Frest (Frest is the fluorescence at the resting Ca2+ concentration [Ca2+]rest) and a relative Ca2+ concentration change [Ca2+]/[Ca2+]rest in the subthreshold depolarization experiments:
 for Fluo-4 fluorescence, and
 for OGB-1 fluorescence. The Equations 3 and 4 indicate that a fractional increase in fluorescence, at least up to ∼50% of the resting level, should reflect an increase in the steady-state Ca2+ level with a power exponent of three. These expressions were thus applied to evaluate changes in Ca2+ concentration induced by subthreshold depolarization.
Translating spike-evoked fluorescence transients into the total Ca2+ entry.
A different approach was required to translate fractional changes of the spike-evoked presynaptic Ca2+ fluorescence signals (evoked ΔF/F) into the corresponding fractional change of rapid (nonstationary) Ca2+ entry. This calibration was performed using an explicit single-compartmental model (Scott and Rusakov, 2006): an increase in ΔF/F was matched by the model outcome in which the unknown action-potential-evoked total Ca2+ entry (in molar) was a single adjustable parameter, whereas the rest of the parameters (concentration and kinetics of the Ca2+ indicator, of the endogenous Ca2+ buffer calbindin-28K, Ca2+ removal rate, and the resting Ca2+ level) were obtained experimentally, as documented previously (Scott and Rusakov, 2006). Supplemental Figure S2C (available at www.jneurosci.org as supplemental material) shows the results of these calculations for the experimental measurements of ΔF/F at five different external Ca2+ concentrations.
Bulk loading of cell-permeable BAPTA AM (testing the consequences of Ca2+ buffering for depolarization- or high-[K+]o- induced facilitation).
BAPTA AM was initially dissolved in DMSO and diluted in the recording bath solution to a final concentration of 200 μm. Slice incubation with BAPTA AM for 10–15 min led to a substantial reduction of EPSCs in the postsynaptic CA3 pyramidal cells and of the action-potential-induced Ca2+ transients in granule cell dendrites and axons (see Fig. 6), implying accumulation of the buffer in the cytosol. We subsequently washed out BAPTA AM remaining in the extracellular space. Special care was taken to wash thoroughly the entire perfusion system and recording chamber before and after such experiments.
Sensitivity and statistical power of Ca2+-imaging experiments.
Before attempting to detect (small) changes in Ca2+-dependent fluorescence induced by subthreshold depolarization, we routinely checked that the imaged MF bouton showed a large action-potential-evoked Ca2+ signal (Scott and Rusakov, 2006). The accuracy of these experiments is potentially reduced by (1) the pixel noise (dark current) in individual line scans (trials), (2) the trial-to-trial measurement error in an individual bouton, and (3) variability among boutons. The pixel noise in the average line-scan signal (8–10 trials per bouton) representing the baseline Ca2+-dependent fluorescence had a coefficient of variation (CV) of 0.122 ± 0.004 (n = 40). Because this noise is much faster than the expected fluctuations in Ca2+-dependent fluorescence in baseline conditions, for the fluorescence value averaged over a 100 ms sampling window (500 Hz scanning) this CV is reduced to
Compartmental model of a dentate granule cell.
We used a NEURON model of a fully reconstructed dentate granule cell adapted from the study by Schmidt-Hieber et al., 2007) (cell number 7, imported from SenseLab; ModelDB accession number 95960, http://senselab.med.yale.edu/modeldb). Depolarization pulses (100 ms, 25 mV) were applied at axonal sites at different distances from the cell soma while adjusting the axonal cable properties to match the antidromic attenuation documented in dual-patch experiments. The best fit yielded intracellular resistivity Ri and specific membrane resistance Rm for the cell axon, as described in Results. In the optimized model, the steady-state input resistance of MF boutons was 1.3–2.7 GΩ for distances from the soma ranging between, respectively, 350 and 700 μm; this was consistent with experimental values reported using whole-terminal recordings in giant MF boutons (Alle and Geiger, 2007).
Modeling the effects of EGTA on spatial cooperativity among presynaptic Ca2+ nanodomains in MF boutons.
Simulations were implemented in Virtual Cell (VCell), version 4.2, at the National Resource for Cell Analysis and Modeling (University of Connecticut Health Center, Farmington, CT). A fragment of the presynaptic MF bouton was modeled as a truncated sphere (see Fig. 8) (diameter, 1 μm; a 0.2-μm-high segment was cut off to represent a flat synaptic active zone). To investigate potential interactions among Ca2+ microdomains, individual Ca2+ sources (voltage-dependent channels) were distributed in nine 50-nm-wide clusters. In each cluster, Ca2+ influx followed action potential driven kinetics represented by a Gaussian with σ = 0.5 ms (Bischofberger et al., 2002) and an amplitude corresponding to the opening of nine channels letting through 125 ions each during an action potential (Koester and Sakmann, 2000). This arrangement was consistent with estimates of the Ca2+ channel distribution in the presynaptic membrane of central synapses (Li et al., 2004).
The terminal contained the endogenous Ca2+ buffer prevalent at MF terminals, calbindin-28K, at a known total concentration of 160 μm (40 μm × four binding sites; kon = 3 × 10⁷ m−1s−1; koff = 9.0 s−1) (Müller et al., 2005) with an effective diffusion coefficient of 2.5 μm2/s and equilibrated with a resting Ca2+ concentration of 100 nm (Scott and Rusakov, 2006). EGTA (10 mm) was added (kon = 107 m−1s−1; koff = 0.7 s−1) to test its effects on the Ca2+ profile; for the initial conditions, the quasi-equilibrated local Ca2+ concentration was decreased to 5 nm. (The actual effective level of the Ca2+ concentration clamp by EGTA is not known and may depend on location-specific Ca2+ homeostasis mechanisms; this level, however, has no influence on the qualitative conclusions of these simulations.) Other simulation parameters were as follows: arena, 1.1 × 1.0 × 1.1 μm; cell size, 10 × 10 × 10 nm (total regular mesh 1.21 × 10⁶ elements); time step, 50 μs.
Statistical tests.
To test the difference between the sampled means, we routinely applied a two-tailed paired t test (Gaussian data scatter) or a nonparameteric Wilcoxon test (non-Gaussian data scatter). The confidence intervals were calculated from the raw data samples using Statistica (StatSoft).
Results
Electrotonic propagation between giant boutons and the soma
We traced the axons (MFs) of individual granule cells to identify giant boutons synapsing in the CA3 region 500–1000 μm from the soma (Scott and Rusakov, 2006) (Fig. 1A,B). Because of the three-dimensional trajectory of MFs, the traced boutons generally occurred >50 μm deep in the slice, precluding routine whole-bouton recordings. In some cases, however, we obtained simultaneous loose-patch recordings from these boutons using a second pipette (Fig. 1C). We verified that individual action potentials evoked either at the soma or at the giant bouton reliably propagate in either direction with no failures, generating local presynaptic Ca2+ transients (Fig. 1C–E) (spike initiation in giant boutons using loose patch is consistent with a high local density of Na+ channels) (Engel et al., 2001). Transient subthreshold depolarization of an individual bouton (100 ms current pulses, adjusted just below action potential threshold, which is ∼25 mV above the resting membrane potential in these boutons) (Geiger and Jonas, 2000) evoked an inward current detected at the soma (Fig. 2A). We could therefore directly demonstrate electrotonic propagation in MFs over >500 μm, which has previously only been shown with bulk depolarization of multiple granule cells (Alle and Geiger, 2006). Moving the pipette away from the bouton 2–10 μm (n = 10) completely eliminated both subthreshold and suprathreshold events at the soma, arguing against indirect effects mediated by neighboring structures. To estimate the electrotonic length constant for these depolarization waves propagating antridromically, we repeated dual-patch experiments in axonal boutons for different distances from the soma. In these measurements, cell input resistance values yielded a current–voltage conversion factor at the soma; assuming an axonal threshold depolarization of ∼25 mV (see above), we translated the somatic current deflection directly to voltage attenuation in different cells. We thus could combine measurements in individual granule cells regardless of variability in input resistance, which depends strongly on the preservation of intact dendritic trees (supplemental Fig. S1, available at www.jneurosci.org as supplemental material). Fitting the entire data set with a simple exponential decay function indicated a length constant of 99 ± 14 μm (including a ∼10% offset; n = 16) (Fig. 2B).

Dual-patch axon–soma recordings and Ca2+ imaging in dentate granule cells. A, Schematic showing positioning of the microscope objective and two patch pipettes (both used for stimulation and recording) with respect to dentate gyrus (DG). B, Characteristic examples of giant MF boutons traced from granule cell somata into area CA3 (Alexa Fluo 594 emission; λx = 800 nm). C, Example of a dual-patch experiment showing a patched soma (right) and a visible giant bouton (dashed arrow) and adjacent patch pipettes. D, Traces, Dual current recordings from a CA3 bouton and soma during orthodromic (left) and antidromic (right) action potentials (escape currents) induced by 2 ms depolarization pulses (orange or cyan lines, individual traces; red or blue lines, five trace average). E, A characteristic Ca2+ signal (line scan at 500 Hz; Fluo-4 emission channel) recorded from a loose-patched giant MF bouton in area CA3 in response to five action potentials generated at the soma. Arrows, Spike onsets; plot, the time course of fluorescence integrated over the width of the recorded bouton.

Subthreshold depolarization propagates in intact MFs between remote boutons and granule cell somata. A, Example of a dual-patch experiment (Fig. 1) showing somatic voltage deflection (blue, eight-trial average; converted from whole-cell current recording using input resistance) evoked by a 100 ms depolarizing pulse at a CA3 MF bouton (red), with the amplitude adjusted just below a spiking threshold; the latter was established earlier to be ∼+25 mV relative to the resting potential at these boutons (Geiger and Jonas, 2000). B, Antidromic (axon–soma) attenuation of a subthreshold depolarization wave in individual MFs: experimental data and theoretical estimates. Ordinate, Amplitude of somatic current deflection evoked by near-threshold depolarization (100 ms/25 mV) of axonal boutons (as in A); abscissa, soma–bouton distance. Red open circles, Data of dual-patch recordings (as in A); dotted line, the best fit with a single-exponent decay. Gray dots, Best-fit data obtained in simulation experiments mimicking dual-patch recordings in a detailed NEURON model of a granule cell (Schmidt-Hieber et al., 2007); optimization was achieved by adjusting the cable properties of the reconstructed axon, as detailed below in C. Inset, Simulated traces of somatic Vm in response to axonal subthreshold depolarization pulses at axon–soma distances shown in the plot. C, Testing axonal attenuation using a NEURON model of a fully reconstructed dentate granule cell adapted from (Schmidt-Hieber et al., 2007) (cell number 7, imported from SenseLab; ModelDB accession number 95960, http://senselab.med.yale.edu/modeldb). Left, A simulation example: antidromic (axon–soma) attenuation of the 100 ms/25 mV depolarization applied at the axonal site marked by a yellow arrow (resting Vm = −80 mV; false color scale, membrane voltage). The depolarization site was systematically changed and the (unknown) axonal properties were adjusted to obtain best fit for the experimental data, as shown in B, yielding intracellular resistivity Ri ≈ 50 Ω · cm and specific membrane resistance Rm ≈ 36.4 kΩ · cm2 (membrane capacitance, Cm ≈ 1 μF/cm2, and axon morphology were kept unchanged). Right, The best-fit model tested for orthodromic (soma-axon) attenuation in response to a square pulse, as shown; a simulation example. In the resulting model, the steady-state input resistance of MF boutons was 1.3–2.7 GΩ for distances from the soma ranging between 350 and 700 μm, respectively. D, Summary of simulation experiments: orthodromic attenuation of signal harmonics (frequency indicated) along the axon.
To assess orthodromic attenuation of axonal depolarization based on these experimental data, we used a detailed NEURON model of a dentate granule cell with a mostly preserved axon (Schmidt-Hieber et al., 2007) (Materials and Methods). In this model, the authors fully reconstructed the granule cell morphology (including the axon) and exhaustively cross-tested cable properties of the dendrites. To assess the unknown cable parameters of the reconstructed axon, we reproduced our dual-patch experiments (100 ms/25 mV axonal depolarization at different distances from the soma) in the model (Fig. 2C). The best-fit correspondence between our experiments and simulations was obtained when the axon had an intracellular resistivity Ri ≈ 50 Ω · cm and a specific membrane resistance Rm ≈ 36.4 kΩ · cm−2 (Fig. 2B,C). Once the modeled cell was consistent with the experimental data, it allowed an estimate of the orthodromic attenuation of depolarization propagating from the soma along the axon (Fig. 2C, right cell diagram). The results indicate that the depolarization wave could propagate for hundreds of micrometers depending on the carrying frequency that defines the signal waveform (Fig. 2D, standard harmonics are shown).
Maximal subthreshold depolarization has no effect on Ca2+ in giant MF boutons
In dual-patch experiments combined with presynaptic Ca2+ imaging, applying a local suprathreshold depolarization pulse to a giant bouton evoked a large spike-dependent presynaptic Ca2+ signal (average ΔF/F = 93 ± 29%; p < 0.001; n = 5) (Fig. 3A,B). However, 100-ms-long depolarizations just below spike threshold had no detectable effect on Ca2+-dependent fluorescence: the mean ΔF/F averaged >150 ms after the depolarization onset was 1.1 ± 1.7% (n = 6 soma-bouton pairs; p > 0.9) (Fig. 3C–E).

Maximal subthreshold depolarization of giant MF boutons has no effect on the presynaptic Ca2+ level. A, A traced and loose-patched giant MF bouton in CA3 (patch pipette is shown; Alexa Fluor 594 emission channel). Dashed arrows, Line-scan position; bottom, experiment diagram. B–D, Line scans of Ca2+-dependent Oregon Green BAPTA-1 fluorescence during suprathreshold (B, single spike initiation) and maximal subthreshold (C) depolarization pulses (blue segments) applied to the bouton (black and red lines in D, respectively; line-scan position shown in A). Subthreshold depolarization applied to the loose-patched bouton was simultaneously monitored as a voltage deflection at the soma, as shown in Figure 2A. E, Summary of dual-patch experiments showing average Ca2+-dependent fluorescence signals in response to suprathreshold and maximal subthreshold depolarization, as indicated (error bars indicate mean ΔF/F: 93 ± 29% and 1.1 ± 1.7%; n = 5 and n = 6, respectively; circles, individual data points).
However, according to the classical high-power relationship between neurotransmitter release and presynaptic Ca2+, only a small increment in Ca2+ entry may be sufficient for a substantial enhancement of transmission. Previous reports have suggested that increasing presynaptic Ca2+ influx through either spike broadening or elevation of external Ca2+ could enhance MF–CA3 pyramidal cell transmission with an apparent power of 2 or less (Regehr et al., 1994; Geiger and Jonas, 2000; Blatow et al., 2003; Mori-Kawakami et al., 2003). To test this more directly, we varied the extracellular Ca2+ concentration ([Ca2+]o) and recorded both action-potential-evoked Ca2+ entry in giant MF boutons and EPSCs in CA3 pyramidal cells (EPSCs evoked by paired pulses were recorded in similar conditions but with no Ca2+ indicators) (Fig. 4A,B). The results suggest a power relationship between the EPSC amplitude and the presynaptic Ca2+ signal with an exponent of 2.5 ± 0.2 (Fig. 4C; supplemental Fig. S2, available at www.jneurosci.org as supplemental material). Translating Ca2+ fluorescence signals into total Ca2+ entry using a compartmental model calibrated previously (Scott and Rusakov, 2006) yielded a very similar relationship (Fig. 4C; supplemental Fig. S2C, available at www.jneurosci.org as supplemental material).

Ca2+ entry in MF giant boutons controls synaptic responses in CA3 pyramidal cells with a power relationship of ∼2.5. A, Example traces of MF-evoked EPSCs in the same CA3 pyramidal cell (30 trace average) at [Ca2+]o = 2 mm (black) and 4 mm (red). B, Presynaptic Ca2+ transients evoked by an action potential in the same giant MF bouton in area CA3 (line scans, Fluo-4 channel; 10 trace average) at [Ca2+]o = 4 and 2 mm, as indicated (bottom, black and red lines, respectively); dashed arrows indicate the action potential onset. C, Summary relationship (n = 16) between the ΔF/F signal (open circles), total calculated Ca2+ entry (gray dots), and EPSC amplitude (relative to the amplitude at [Ca2+]o = 2 mm) at different [Ca2+]o values, as indicated. Error bars indicate SEM; red line, the best-fit power relationship y = AxB, where B = 2.5 ± 0.2 and A is a scaling factor. For further details, see Materials and Methods and supplemental Figure S2 (available at www.jneurosci.org as supplemental material).
Presynaptic depolarization sufficient to enhance transmitter release has no effect on Ca2+ signaling at giant MF boutons
In the above experiments, [Ca2+]o-dependent changes in total Ca2+ entry reflect an average change in Ca2+ influx through individual Ca2+ channels, including those immediately involved in neurotransmitter release. Therefore, the reported 43% enhancement of transmission by presynaptic depolarization (Alle and Geiger, 2006) could be explained by a ∼15% increase in Ca2+ sources near release sites. However, subthreshold depolarization in these boutons has no effect on the presynaptic Ca2+ current recorded under conditions giving a high signal-to-noise ratio (Alle and Geiger, 2006). Hence, the 15% Ca2+ source increase, if such occurs, could be provided either by a change in the resting Ca2+ level or by release from intracellular Ca2+ stores. An increase in the resting Ca2+ concentration (over a depolarization period lasting tens of milliseconds) is very likely to spread throughout the bouton; the bouton-average Ca2+-dependent fluorescence should therefore be sufficiently sensitive to detect its consequences. However, Ca2+ store signaling might in principle be localized to the release-triggering sites and therefore missed by volume-average Ca2+ measurements. To test whether highly localized Ca2+ signals could explain the facilitatory effects of presynaptic depolarization, we turned to an alternative approach.
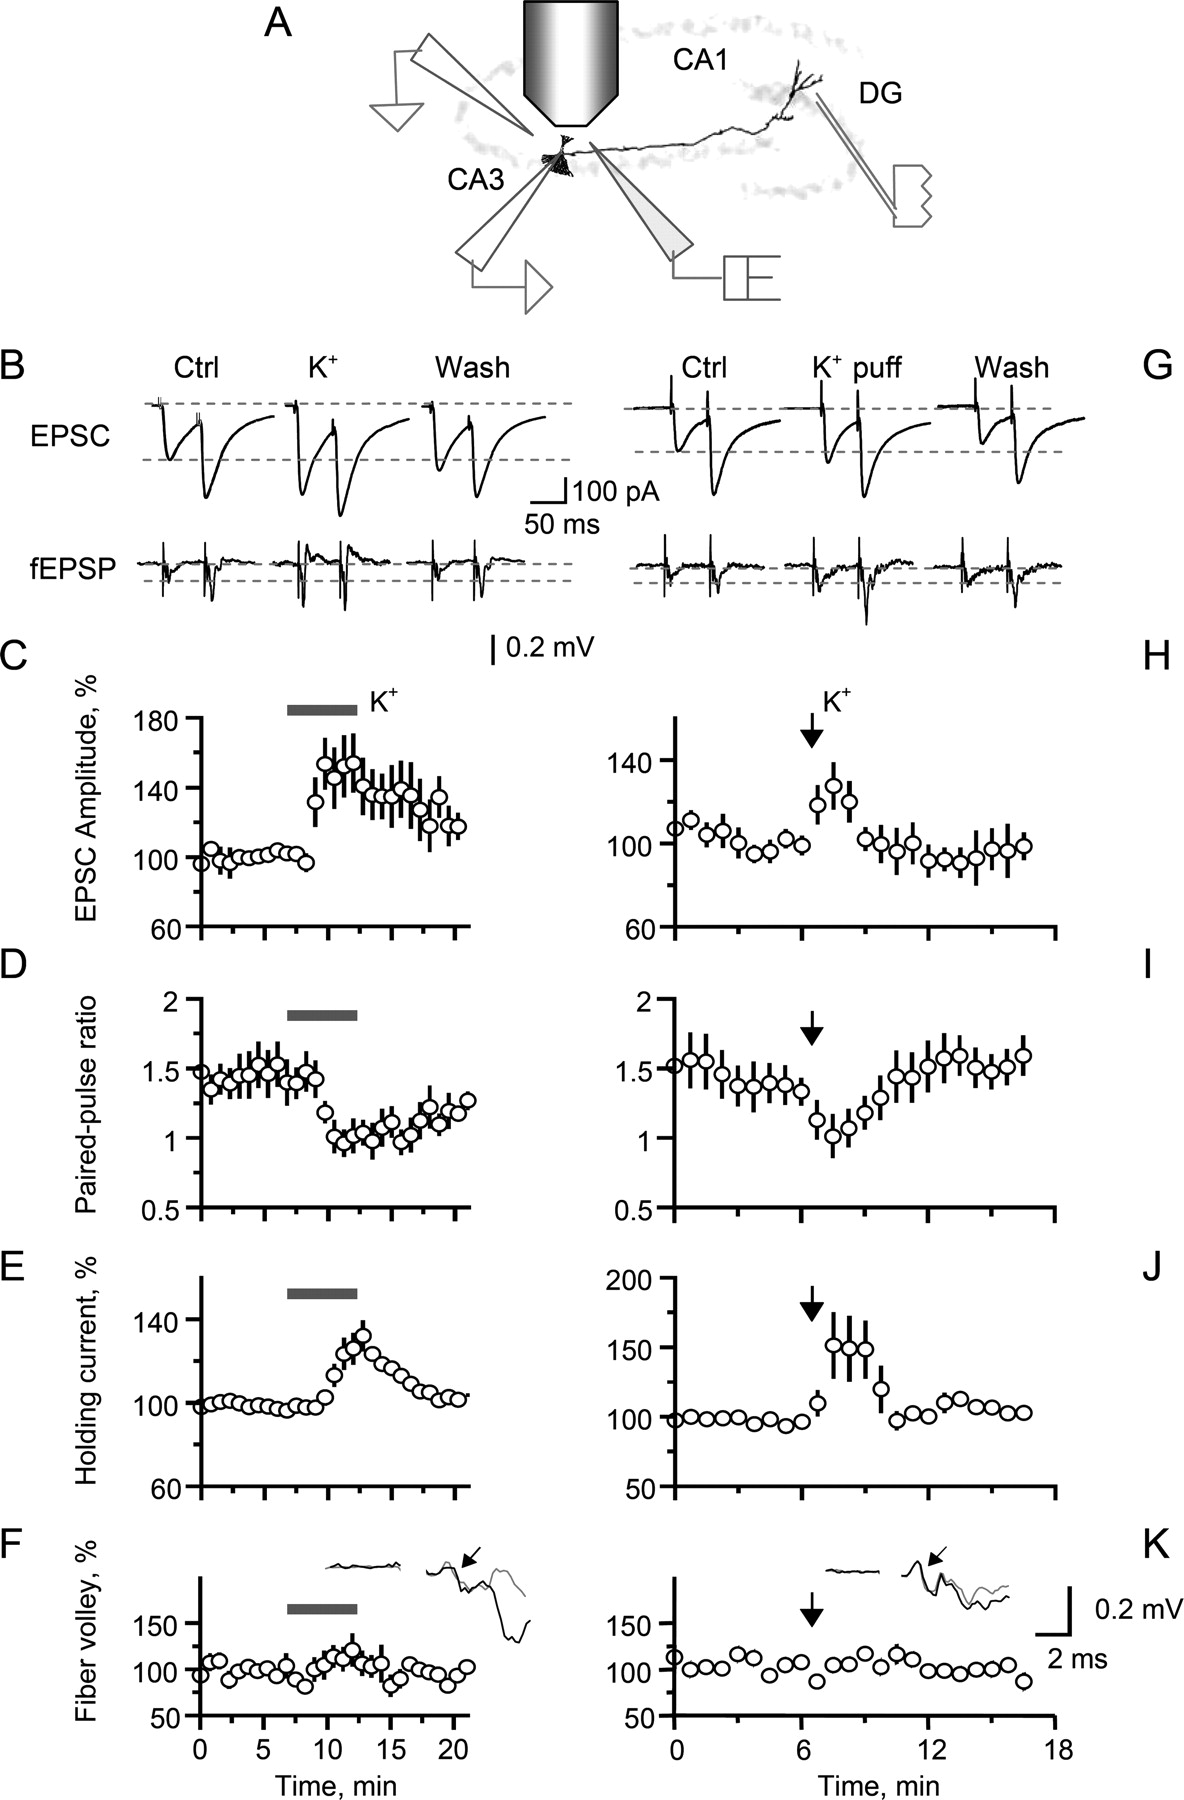
It was shown previously that depolarizing MFs by raising the extracellular K+ concentration [K+]o enhances EPSCs recorded in CA3 pyramidal cells with little change in fiber excitability (Schmitz et al., 2001). Although this was originally suggested to reflect a change in action-potential-dependent presynaptic Ca2+ entry (Schmitz et al., 2001), later experiments demonstrated that increasing [K+]o up to 6.5 mm has no effect on the action potential waveform recorded in giant MF boutons (Alle and Geiger, 2006). We therefore first confirmed that raising [K+]o from 2.5 to 5 mm increased EPSCs in CA3 pyramidal cells (by 53 ± 15%; p < 0.005; n = 6), and that this was accompanied by a decrease in the paired-pulse ratio (PPR) (31 ± 8%; p < 0.03) consistent with an increase in neurotransmitter release probability (Fig. 5A–E); changes in axon recruitment in high K+ were too small to account for this result (Fig. 5F). Qualitatively identical results were obtained by locally and transiently increasing K+ via pressure application (20–30 mm KCl in perfusion medium, 100 ms/∼5 psi) in area CA3 and far from the stimulus site, with no detectable effects on fiber recruitment (Fig. 5G–K).

Presynaptic depolarization associated with raised [K+]o reversibly enhances the amplitude while decreasing the paired-pulse ratio of MF-evoked responses in CA3 pyramidal cells. A, Schematic showing positions of the stimulating electrode (stratum granulosum), patch-clamp pipette (bottom left), the extracellular recording electrode (top left), and the pressure-pulse pipette (middle; ∼20 mm K+ in bath solution). B, Whole-cell EPSCs (top traces) and fEPSPs (bottom traces) recorded, respectively, in CA3 pyramidal cells and in stratum lucidum, evoked by two stimuli (25 ms apart) applied in the granule cell layer (one-cell example). Ctrl, Control conditions; K+, [K+]o increased from 2.5–5 mm; Wash, washout. C–F, The average time course of the first EPSC amplitude (C; average change in high [K+]o, +54 ± 15%; n = 6; p < 0.001), the paired-pulse amplitude ratio (D; −31 ± 8%; p < 0.03), holding current (E; +24 ± 13%; p < 0.05) and the fiber volley amplitude [F; +15 ± 13%; not significant (NS)]. F, Inset, A characteristic fEPSP trace showing a fiber volley (arrow) in control conditions (black) and after an increase in [K+]o (gray). G–K, Same experiments as in B–F but with pressure application of K+ (100 ms/∼ 5 psi pulse; arrow) near the recorded CA3 pyramidal cell. Notation is as in B–F. The average changes after a high K+ puff (n = 9) are as follows: EPSC amplitude, +29 ± 10% (p < 0.03); paired-pulse ratio, −29 ± 8% (p < 0.01); holding current, +44 ± 34% (NS); fiber volley, −5 ± 6% (NS). Error bars indicate SEM.
If increases in local Ca2+ sources are responsible for depolarization-dependent enhancement of transmission, high-affinity Ca2+ buffering should suppress this phenomenon (Blatow et al., 2003; Burnashev and Rozov, 2005). Previously, testing a similar hypothesis by loading individual giant MF boutons with the Ca2+ chelator EGTA in whole-cell mode failed to abolish the facilitatory effect (Alle and Geiger, 2006). We therefore bulk-loaded MFs with the high-affinity (cell-permeable) Ca2+ chelator BAPTA AM to an intracellular level sufficient to decrease EPSCs in CA3 pyramidal cells to 27 ± 2% of baseline (n = 3) and action-potential-evoked ΔF/F responses (monitored with Fluo-4) to 48 ± 4% of baseline (n = 6) (Fig. 6A) (these decreases were comparable with the effect of terminal loaded BAPTA in neocortical cells at a concentration of 0.5–1.0 mm) (Blatow et al., 2003). We next tested whether, in these conditions, somatic depolarization of dentate granule cells still enhances MF–CA3 pyramidal cell transmission: we excited MFs antidromically, with an extracellular electrode placed in area CA3, and monitored the corresponding field EPSPs (fEPSPs). Control trials were interleaved with trials where granule cell somata were depolarized by applying brief pulses of glutamate locally in the dentate gyrus (Fig. 6B, schematic). Glutamate application induced a transient negative deflection in the dentate gyrus but not in CA3 (Fig. 6B, traces). However, it significantly increased the fEPSC amplitude (by 47 ± 6%; n = 4; p < 0.005), with no effect on the fiber volley in CA3 (change, −4 ± 4%) (Fig. 6B) (in these experiments, the PPR was not measured because the effect of glutamate did not necessarily remain constant between stimuli). Consistent with these observations, in separate experiments, high K+ reversibly enhanced MF-evoked EPSCs in CA3 pyramidal cells while reducing the corresponding PPR in the presence of intracellular BAPTA (Fig. 6C). Together, these results confirm that depolarization-dependent enhancement of release remained unaffected by presynaptic Ca2+ buffering, arguing that the underlying mechanism is unlikely to involve local Ca2+ sources and is not affected by Ca2+ indicators.

Depolarization-induced enhancement of MF–CA3 pyramidal cell transmission is not affected by high-affinity buffering of presynaptic Ca2+. A, Bulk-loading granule cells with the high-affinity Ca2+ buffer BAPTA AM reduces the MF-evoked EPSCs in CA3 pyramidal cells to 27 ± 2% of baseline (top plot, mean ± SEM; n = 3) and action-potential-evoked ΔF/F responses to 48 ± 4% of baseline (bottom plot; black and open circles denote recording from dendrites and axons, respectively; combined, n = 7; imaged using 200 μm Fluo-4; error bars indicate average values). B, In the presence of bulk-loaded BAPTA AM (see A), depolarizing granule cell somata with local puffs of glutamate enhances the fEPSPs evoked by stimulation of MFs in CA3, with no change in fiber recruitment. Top left, Experiment schematic: an extracellular patch-pipette electrode in the dentate gyrus (DG) filled with the bath medium and glutamate (50 mm) is also connected to the micropump pressure line. Top traces, Extracellular recordings in the DG during alternating sweeps, with or without glutamate puff (black and gray, respectively); during and after the puff (open bar), an inward current deflection reflecting somatic depolarization is prominent, and pop spikes are seen indicating antidromic excitation of granule cells by extracellular stimuli in CA3. Bottom traces, fEPSPs recorded simultaneously in stratum lucidum (time scale expanded); during the puff (black), the fEPSP amplitude increases with no changes in fiber volley (fv; in these experiments, fEPSPs are relatively small compared with fv because of a strongly reduced release probability in the presence of BAPTA). Plots, Statistical summary; open circles, average ± SEM; n = 4; dotted lines, data from the same experiment; ***p < 0.005. C, In the presence of cytosolic BAPTA (as in A), an increase in [K+]o still decreases PPR (left; n = 5) and increases the amplitude (right; n = 4) of MF-evoked EPSCs in CA3 pyramidal cells (dotted line in the right plot indicates the amplitude reduction trend after bulk application of BAPTA AM; see A).
In agreement with these results, increasing [K+]o had no effect on either evoked or resting Ca2+ signals in individual CA3 MF boutons (average change, −0.8 ± 3.0% and 0.4 ± 3.3%, respectively; n = 4; p > 0.8) (Fig. 7A,B). Finally, depolarization-induced facilitation also remained intact in the presence of the Ca2+ store blocker thapsigargin (Fig. 7C,D) (in these conditions, thapsigargin on its own produces a slight increase in the resting Ca2+ level in these boutons) (Scott and Rusakov, 2006). This result further argues against the involvement of Ca2+ stores in the phenomenon.

MF depolarization associated with raised [K+]o enhances transmission to CA3 pyramidal cells with no changes in presynaptic Ca2+ and no contribution from Ca2+ stores. A, Local increases in [K+]o have no effect on the resting Ca2+ level in individual giant MF boutons traced from granule cells; a characteristic one-bouton example. Left, A bouton is approached by a pressure application pipette (dotted lines; pipette medium, 30 mm KCl plus bath medium plus 20 μm Alexa Fluor 594; Alexa channel; arrow, line-scan position). Middle, Line scan (Alexa) illustrating the ejection flux profile (the brightness change front; no apparent mechanical disturbance can be seen in the bouton trace). Right, Line scan (OGB-1 channel) showing no detectable changes in the Ca2+-dependent fluorescence during the [K+]o rise. B, Summary. Increases in [K+]o have no effect on either resting or evoked Ca2+ signals in giant MF boutons. Black circles, Resting Ca2+ fluorescence (average change in high [K+]o, 1.0 ± 4.1%; n = 4); orange circles, spike-evoked ΔF/F Ca2+ signal (−1.2 ± 2.9%, n = 3) (for an example of recordings, see in Fig. 3A,B). Error bars indicate SEM. C, Increasing [K+]o to 5 mm in the presence of the Ca2+ store blocker thapsigargin reversibly reduces the PPR while increasing the amplitude of EPSCs in CA3 pyramidal cells (top and bottom plots, respectively); one-cell example. D, Summary of experiments in C: dotted lines connect data points from individual cells (n = 6; normalized to control values); bars, values averaged over the 5 min periods of control (Cntrl), increased [K+]o (5 mm K+), and washout (Wash), as indicated. **p < 0.01.
Somatic depolarization affects presynaptic Ca2+ only in proximal segments of the axon
How can we reconcile the voltage insensitivity of presynaptic Ca2+ in giant boutons with the effects of depolarization in proximal axons (Ruiz et al., 2003)? We found that 100 ms somatic depolarization before evoking an action potential did affect axonal Ca2+ transients, but this influence diminished rapidly with distance, with a length constant of 37 ± 17 μm (n = 28) (Fig. 8A–D; supplemental Fig. S3, available at www.jneurosci.org as supplemental material). The increase in resting Ca2+ in response to subthreshold depolarization also diminished systematically with distance, with a length constant of the same order (29 ± 13 μm; n = 35) (Fig. 8E). The length constant was also similar (47 ± 24 μm; n = 23) when 100 mV, 200 ms depolarizing pulses were delivered in the presence of 1 μm TTX to block action potentials (Fig. 8F). Indeed, in boutons occurring >200 μm from the soma, depolarization evoked no increase in spike-evoked or baseline Ca2+ signals: the average change was −4.2 ± 4.8% (n = 17; p > 0.50) and −0.4 ± 1.4% (n = 23; p > 0.77; subthreshold and TTX data combined), respectively. These length constants are an order of magnitude smaller than those for electronic propagation of depolarization (see above), suggesting a sensitivity threshold for the effect of voltage on Ca2+ signaling. They are also substantially shorter than the length constants of long-term (minutes) effects of depolarization on Ca2+ signaling reported previously (Ruiz et al., 2003; Scott and Rusakov, 2006). This discrepancy between brief and long-lasting depolarizations may be explained by time- and voltage-dependent inactivation of axonal ion channels that modulate spike-driven Ca2+ entry. In addition, the difference in the voltage sensitivity of Ca2+ signaling between proximal and CA3 boutons might reflect differences in the expression of Ca2+-permeable channels between the two areas.

Somatic depolarization affects Ca2+ signaling only in proximal segments of granule cell axons. A, B, An example of tracing and identifying a giant CA3 bouton, with morphological reconstruction of the axon for soma–bouton distance measurements (Alexa channel). Two contiguous parts of the collage are connected by a yellow dotted line. The bouton of interest is shown by a gray rectangle and, at higher magnification, in B. C, A characteristic example illustrating no change in spike-evoked Ca2+ entry in a giant CA3 bouton (top line scan; plot, black trace) in response to somatic depolarization (bottom line scan; plot, red trace); blue segment, somatic depolarization from −80 to −45 mV; arrows, action potential onset. See additional examples in supplemental Fig. S3 (available at www.jneurosci.org as supplemental material). D–F, Effect of subthreshold somatic depolarization (100 ms pulse, 30–35 mV above the resting membrane potential) on presynaptic action-potential-evoked Ca2+ signals (D) and on the resting Ca2+-dependent fluorescence (E) decays rapidly along the axon; data in F show a similar effect of 100 mV, 200 ms somatic depolarization in the presence of 1 μm TTX. Abscissa, Distance to the soma; ordinate, relative changes in ΔF/F signal (D) or in the steady-state [Ca2+] calculated from fluorescence changes (E, F) (supplemental Fig. S3, available at www.jneurosci.org as supplemental material) (see Material and Methods for details). Blue and red circles, Fluo-4 and OGB-1 data, respectively; open circles, data obtained at 33–35°C; lines, a monoexponential fit.
Discussion
We have performed dual-patch recordings from axons and somata of dentate granule cells to document directly the long-range electrotonic propagation of subthreshold depolarization in individual intact MFs. Such depolarization has been shown to facilitate MF–CA3 pyramidal cell transmission, with no detectable changes in spike-evoked presynaptic Ca2+ currents (Alle and Geiger, 2006). In the present study, we asked whether the underlying mechanism relied instead on Ca2+ signaling from Ca2+ stores or on changes in the resting Ca2+ level. We observed no change in resting or action-potential-evoked Ca2+ fluorescence in giant MF boutons, with either local, somatic, or high-[K+]o-induced depolarization (Figs. 3, 7, 8), although such manipulations should be sufficient to enhance MF-evoked EPSCs in CA3 pyramidal neurons (Figs. 5⇑–7) and alter Ca2+ signaling in proximal segments of the axon (Fig. 8).
We have established that postsynaptic responses in CA3 pyramidal cells vary with presynaptic Ca2+ entry in giant MF boutons (and the corresponding fluorescence ΔF/F signal) with a power exponent of ∼2.5 (Fig. 4). Such a dependence is slightly steeper than the power relationship between the EPSC amplitude and [Ca2+]o assessed here (Fig. 4; supplemental Fig. S2, available at www.jneurosci.org as supplemental material) or in previous studies (Regehr et al., 1994; Geiger and Jonas, 2000; Blatow et al., 2003; Mori-Kawakami et al., 2003). This suggests that presynaptic Ca2+ influx in MFs depends on [Ca2+]o in a slightly sublinear manner, which is consistent with classical Ca2+ channel properties at this range of [Ca2+]o (Tsien et al., 1987). In contrast, a recent study reported a power relationship of 3.8 (Gundlfinger et al., 2007) based on Ca2+ imaging of MFs bulk-loaded with the cell-permeable indicator Oregon Green BAPTA-1 AM (Kd ∼ 150 nm). However, translating many-fold changes in fluorescence of a high-affinity indicator directly into Ca2+ entry could be complicated by (partial) indicator saturation, potentially resulting in an underestimation of free presynaptic Ca2+ transients.
Our Ca2+-imaging results argue that the electrotonic facilitation of transmission at MF–CA3 pyramidal cell synapses reported previously (Alle and Geiger, 2006) cannot be explained by a change in either resting or action-potential-evoked presynaptic Ca2+ signaling in the bouton. To further address the potential role of highly localized Ca2+ sources (other than Ca2+ channels) in mediating depolarization-dependent synaptic facilitation, we tested whether such facilitation can be suppressed by presynaptic high-affinity Ca2+ buffers or by blockade of Ca2+ stores. Again, the depolarization-induced synaptic enhancement remained intact (Figs. 5⇑–7), also confirming that this phenomenon should not be affected by the use of high-affinity Ca2+ indicators.
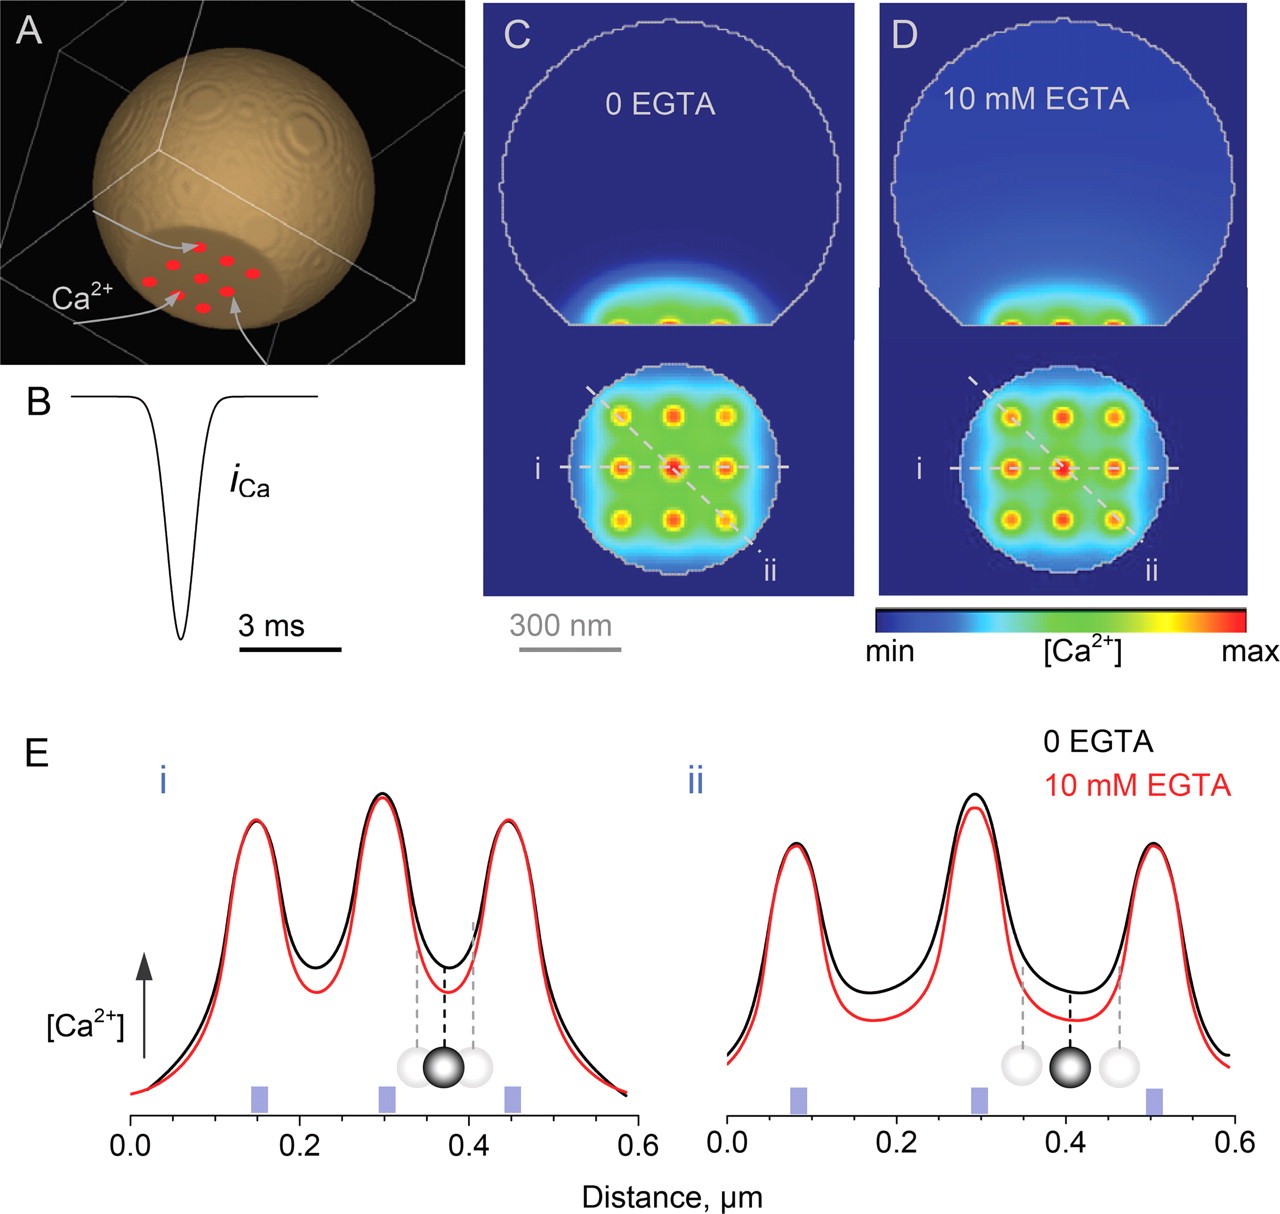
One Ca2+-dependent mechanism that cannot be ruled out is that depolarization decreases the effective distance between Ca2+ sources (principally Ca2+ channels) and Ca2+ sensors that trigger exocytosis. Such a decrease could elevate the Ca2+ concentration near the sensor without affecting either presynaptic Ca2+ currents or the bouton-averaged Ca2+-dependent fluorescence. However, this mechanism should be sensitive to Ca2+ buffering: the attenuation of the effect by 10 mm EGTA (Alle and Geiger, 2006) could be explained by shallower Ca2+ nanodomains that would weaken synaptic facilitation in response to the same change in the Ca2+ sensor-source distance. To test this possibility, we simulated distributed presynaptic Ca2+ entry, diffusion and buffering using the VCell environment (Schaff et al., 1997). Although the model incorporated the experimental estimates of Ca2+ entry (Geiger and Jonas, 2000) and intraterminal buffering (Müller et al., 2005; Scott and Rusakov, 2006) characteristic of giant MF boutons (Fig. 9A–D) (see Materials and Methods), its general features were not important to answer a qualitative question: does adding EGTA make the Ca2+ nanodomains less steep? In fact, simulations showed the opposite: adding EGTA causes the rapid rise in free Ca2+ to attenuate more steeply with distance (Fig. 9D,E). Therefore, the depolarization-dependent decrease in the Ca2+ source-sensor distance, if such exists, should be enhanced in EGTA, opposite to what has been observed (Alle and Geiger, 2006). In addition, Ca2+ sensors that trigger release have been associated with docked and primed, and therefore mostly immobile, synaptic vesicles (Sudhof, 2004), also arguing against the involvement of Ca2+ source-sensor distance changes in the underlying mechanism.

Simulations predict that Ca2+ chelation (with EGTA) reduces spatial cooperativity among presynaptic Ca2+ nanodomains. A, B, A three-dimensional (spherical) fragment of the modeled presynaptic bouton (A; diameter, 1 μm; 0.2 μm segment truncated). Individual Ca2+ sources (voltage-dependent channels) were distributed in nine 50-nm-wide clusters, as depicted. In each cluster, Ca2+ influx followed the action-potential-driven kinetics (B) and an amplitude corresponding to the opening of nine channels letting through 125 ions each during an action potential (Koester and Sakmann, 2000). Bouton geometry or the size of channel clusters has little impact on the qualitative conclusion of these simulations. For additional parameters, see Materials and Methods. C, D, A simulation snapshot of the free Ca2+ concentration profile at the peak of action-potential-evoked Ca2+ influx in the plane normal (central cross-section; top) and parallel (the first 10 nm layer inside the terminal; bottom) to the synaptic membrane, before and after adding 10 mm EGTA (C, D, respectively). False color scale, Relative concentrations. E, Simulated near-membrane Ca2+ concentration landscape (relative values, scaled for comparison) showing spatial summation of Ca2+ domains generated by Ca2+ influx through Ca2+ channel clusters. Black and red lines, Before and after adding 10 mm EGTA, respectively. i, ii, Left (i) and right (ii) panels show the profile taken, respectively, along lines i and ii depicted in C and D. Vesicle diagram, Shortening the distance between the vesicle exocytosis trigger (gray spheres) and Ca2+ channels (blue rectangles) corresponds to a greater increase of Ca2+ concentration in the presence of EGTA (red lines) than without EGTA (black lines). For the underlying assumptions, see Materials and Methods.
Changes in presynaptic voltage have been reported to modulate Ca2+-triggered exocytosis at the crustacean neuromuscular junction in a Ca2+-independent manner (Hochner et al., 1989). However, this has not been reproduced at mammalian central synapses (Felmy et al., 2003), although voltage-dependent and Ca2+-independent somatic exocytosis has been reported in dorsal root ganglion neurons (Zhang and Zhou, 2002). Overall, the present results suggest that changes in presynaptic membrane potential, including those arising from electrotonic propagation of somatic depolarization, affect neurotransmitter release from MF boutons in a Ca2+-independent manner. By implication, other presynaptic influences on MF bouton membrane potential, such as those mediated by presynaptic kainate and GABAA receptors (Kamiya et al., 2002; Ruiz et al., 2003; Alle and Geiger, 2007), may also exert at least part of their action through a mechanism that does not involve changes in Ca2+. Whether this is a general mechanism in the cortex is less clear: electrotonic propagation of depolarization has been shown to affect transmission in cortical pyramidal cells in a Ca2+-dependent manner (Shu et al., 2006). Moreover, somatic depolarization influences presynaptic Ca2+ in proximal MF segments (Ruiz et al., 2003; Scott and Rusakov, 2006). However, a strong Ca2+-indepedent component of evoked glutamate release at central synapses can be revealed by osmotic challenge (Bronk et al., 2007) or by application of nifedipine (Hirasawa and Pittman, 2003). Thus, Ca2+-dependent and Ca2+-independent influences of presynaptic membrane potential on neurotransmitter release are likely to coexist, with different relative contributions at distinct synapses.
Footnotes
-
This work was supported by the Wellcome Trust, the Medical Research Council UK, the Human Frontier Science Program, and the European Union (Promemoria). We thank P. Ragunathan for help with some experiments, and K. Volynski and M. Walker for valuable comments.
- Correspondence should be addressed to either Dmitri A. Rusakov or Ricardo Scott, Institute of Neurology, University College London, Queen Square, London WC1N 3BG, UK. d.rusakov{at}ion.ucl.ac.uk or r.scott{at}ion.ucl.ac.uk


