

Article Figures & Data
Figures
- Figure 1.
Distinct responses of hTRPA1 and mTRPA1 to menthol as assayed by ratiometric calcium imaging and FLIPR. A–D, The responsiveness of mTRPA1 and hTRPA1 to menthol was assayed by ratiometric calcium imaging (A, B) and FLIPR (C, D). A, Activation effect of menthol on CHO cells expressing hTRPA1 (red trace) and mTRPA1 (blue trace). Untransfected CHO cells responded neither to menthol nor to MO (green trace). Menthol (250 μm) induced a robust increase in intracellular Ca2+ in cells expressing hTRPA1, but not in cells expressing mTRPA1. Notably, removal of menthol led to a rapid increase in intracellular Ca2+ in cells expressing mTRPA1. This phenomenon is termed “off response” and is a characteristic response of mTRPA1 to menthol activation. B, Inhibitory effect of menthol on MO-evoked hTRPA1 (red trace) or mTRPA1 activity (blue trace). C, Menthol concentration–response relationships of hTRPA1 (open squares) or mTRPA1 (open circles). Note the bell-shaped sensitivity of mTRPA1 to menthol. D, Concentration dependence of menthol to inhibit MO (100 μm)-evoked Ca2+ responses in HEK293T cells expressing hTRPA1 (open squares) or mTRPA1 (open circles).
- Figure 2.
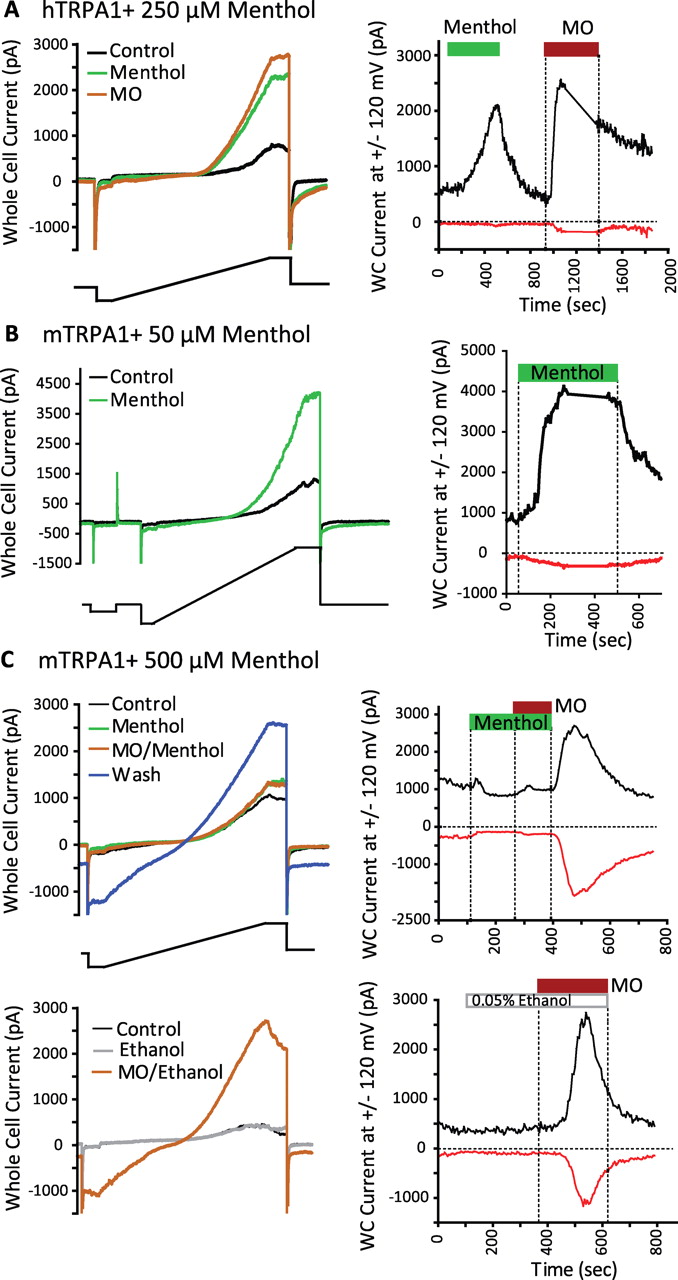
Menthol modulation of TRPA1 is species- and concentration-dependent as assayed by electrophysiology. A, Menthol activates hTRPA1. Left, Both menthol (250 μm) and MO (100 μm) similarly increase whole-cell currents in HEK293T cells transiently transfected with hTRPA1. Representative current traces are shown before (black), at the peak of the menthol response (green), and at the peak of the MO response (brown) after reversal of the menthol effect. Cells were challenged every 5 s with voltage ramps between −120 and +120 mV (2.8 mV/ms) from a holding potential of −50 mV (protocol shown below). The currents at −120 (red) and +120 (black) mV were measured and plotted over the entire time course of the experiment (right). Menthol and MO application is indicated by the green and brown bars, respectively. Vertical dashed lines indicate the times that either the indicated compound arrived at the bath or washout was initiated. Note that during the gap between 1100 and 1370 s, the cell was challenged with voltage step protocols (extracellular saline, 2 mm Ca2+ ES; pipette saline, 0 mm Ca2+ IS). Responses of cells tested in 0 mm Ca2+ ES were similar to those obtained in 2 mm Ca2+ ES and combined. B, Low concentrations of menthol activate mTRPA1. Left, Menthol (50 μm) increases whole-cell currents in HEK293T cells transiently transfected with mTRPA1. Representative current traces are shown before (black) and at the peak of the menthol response (green). Right, Exposure to menthol is indicated by the green bar. Note that during the gap between 220 and 380 s, the cell was challenged with voltage step protocols (extracellular saline, 0 mm Ca2+ ES; pipette saline, 0 mm Ca2+ IS). C, High concentrations of menthol block subsequent responses to MO (100 μm) applied in the presence of menthol (500 μm). Top left, Representative current traces are shown before (black), at the peak of the menthol response (green), at the peak of the MO/menthol response (brown), and at the peak of the washout response (blue). Top right, The whole-cell currents at −120 (red) and +120 (black) mV were measured and plotted over the entire time course of the experiment. The durations of exposure to menthol and MO are indicated by the green and brown bars, respectively. Bottom left, Ethanol (0.05%) had no effect on whole-cell conductance (gray trace) and 100 μm MO elicited a large response (brown trace). Bottom right, The currents at ±120 mV are shown over the course of the experiment (extracellular saline, 2 mm Ca2+ ES; pipette saline, 0 mm Ca2+ IS).
- Figure 3.
Determinants of the distinct responses of hTRPA1 and mTRPA1 to menthol reside in the region from TM5 to TM6. A, Schematic representations of mTRPA1-hTRPA1 chimeras. The amino acid compositions of the indicated chimeras are described in the supplemental Table 1 (available at www.jneurosci.org as supplemental material). B–E, The responsiveness of hTRPA1 (purple traces), hTRPA1-mTM1–6 (blue traces), hTRPA1-mTM5–6 (red traces), and hTRPA1-mTM1–4 (green traces) to menthol (activation) and menthol-dependent inhibition of MO activation (inhibition) is shown in B and C, respectively, whereas the responsiveness of mTRPA1 (blue traces), mTRPA1-hTM1–6 (red traces), and mTRPA1-hTM56 (green traces) to menthol activation and inhibition is displayed in D and E, respectively. F, Concentration–responsive relationships of menthol activation of hTRPA1-mTM5–6 (open squares) or mTRPA1-hTM5–6 (open circles). G, Concentration–dependence curves of menthol inhibition of 100 μm MO-evoked hTRPA1-mTM5–6 (open squares) or mTRPA1-hTM5–6 (open circles) activity. Note that hTRPA1-mTM5–6 recapitulates the sensitivity of mTRPA1 to menthol, whereas mTRPA1-hTM5–6 behaves like hTRPA1.
- Figure 4.
Residues within TM5–TM6 govern species-specific response of TRPA1 to menthol and AMG5445. A, Sequence alignment of the region from TM5 to TM6 reveals a total of 17 nonidentical amino acids (red and blue) in mTRPA1 and hTRPA1. Residues shown in red are responsible for the distinct responses of mTRPA1 and hTRPA1 to menthol and AMG5445; those in blue did not alter the host channel response to menthol. The predicted positions of TM5, pore helix, selectivity filter, and TM6 (the rest of TM6 is identical between mTRPA1 and hTRPA1 and, thus, is not shown) are also depicted. B, C, Calcium imaging experiments revealed that hTRPA1-V875G behaved partially like mTRPA1 in response to menthol activation (displaying a slight activation and pronounced off response, green trace) (B) and inhibition (C). D, E, hTRPA1-FGFATLIAM recapitulates the sensitivity of mTRPA1 to menthol activation (D) and inhibition (E). F, G, Concentration–effect relationships of mTRPA1 (open circles), hTRPA1-V875G (open squares), and hTRPA1-FGFATLIAM (open triangles) to menthol activation and inhibition. H, Concentration–response relationships of mTRPA1 (open circles), hTRPA1 (open squares), and hTRPA1-FGFATLIAM (open diamonds) to AMG5445. Note that AMG5445 acts as a partial agonist at mTRPA1 and hTRPA1-FGFATLIAM and has no agonist activity at hTRPA1. I, Concentration–response relationships of AMG5445 inhibition of 30 μm MO-induced responses mediated by mTRPA1 (open circles), hTRPA1 (open squares), and hTRPA1-FGFATLIAM (open diamonds) activity. Note that AMG5445 is a full antagonist at hTRPA1.
- Figure 5.
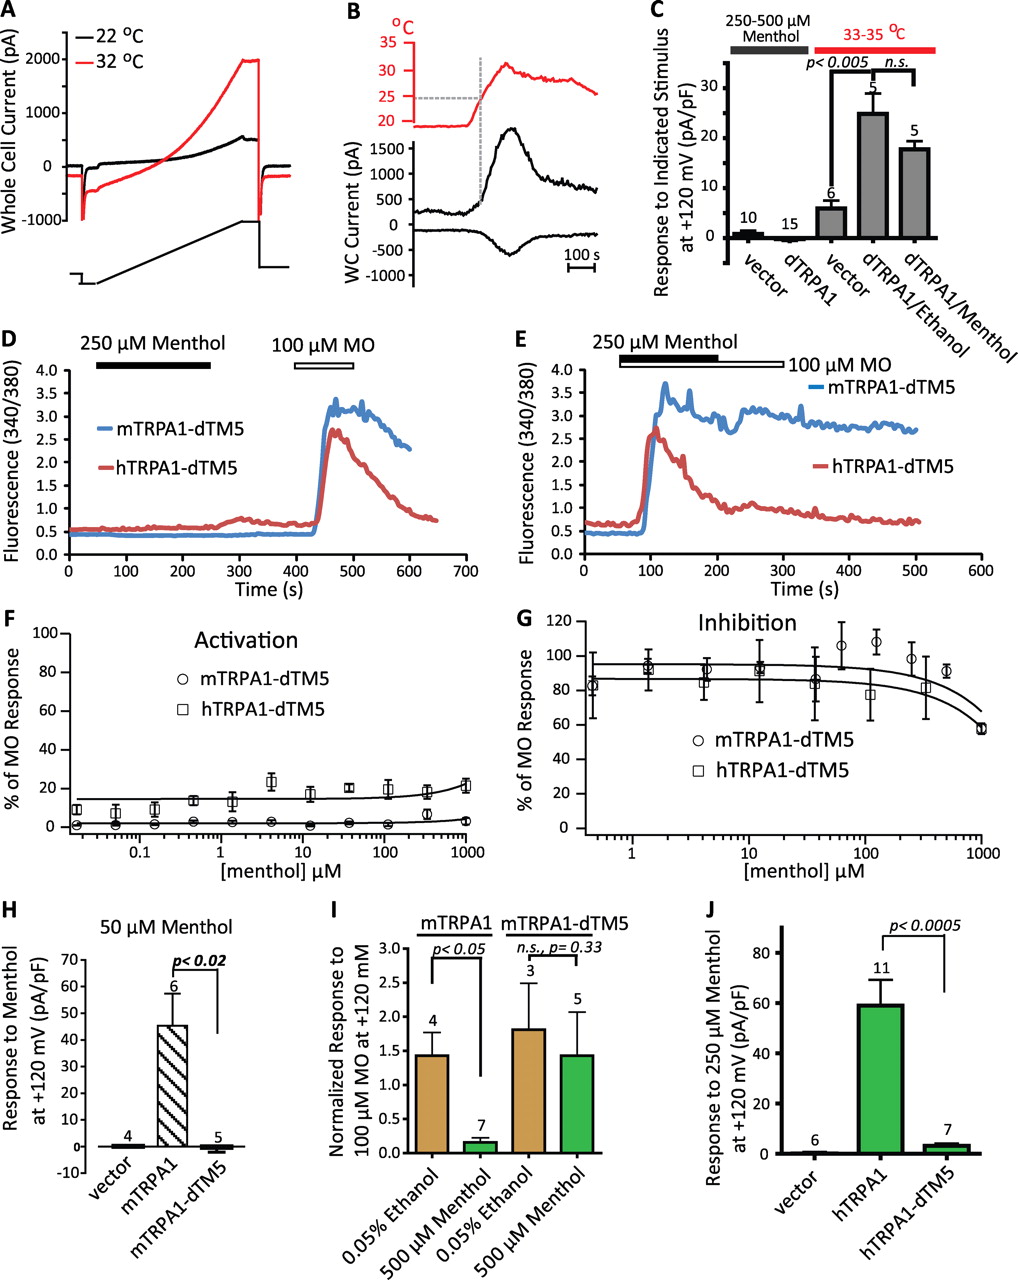
Warm-activated Drosophila TRPA1 is insensitive to (−)-menthol, and replacement of mammalian TM5 with dTM5 abolishes modulation of mammalian channels by menthol. A, A dTRPA1-transfected cell was challenged with a voltage ramp (from −120 to +120 mV) at 22°C (black trace) and 32°C (red trace). The warming-induced current was −35.5 and +85 pA/pF at −120 and +120 mV, respectively. This cell revealed no activation by menthol (at either 25 or 250 μm; 0 mm Ca2+ ES/0 mm Ca2+ IS). B, Time course of currents measured at −120 mV and +120 mV before and during warming and recovery from warming for the cell shown in A. Heating-induced currents often revealed apparent desensitization. WC, Whole cell. C, dTRPA1 is neither activated by 250–500 μm nor inhibited by 500 μm menthol. The two leftmost bars indicate the change in whole-cell current density at +120 mV during exposure to 250–500 μm menthol at ∼20–24°C for the number of vector or dTRPA1-transfected cells shown above each bar. Similar results were obtained for cells recorded with or without external calcium, or in 0 mm Ca2+- or 100 nm Ca2+-containing intracellular saline, and were combined. Cells were exposed to menthol for at least 3 min, which was at least three times the latency of menthol to activate hTRPA1 under similar conditions. The set of gray bars are the means ± SEM for the increases in current density at +120 mV during heating to 33–35°C from 20–22°C. Similar results were obtained when currents were measured at −120 mV (data not shown). Whereas control HEK293T cells (“vector”) revealed a heating-induced increase in conductance, the response of dTRPA1-transfected cells is significantly larger. The threshold for activation by warming was near 27°C, as described previously for dTRPA1 expressed in oocytes (Viswanath et al., 2003). To determine whether menthol could inhibit dTRPA1-mediated warm responses, the heat stimulus was applied in the presence of either 500 μm menthol or 0.05% ethanol (dTRPA1/Ethanol vs dTRPA1/Menthol) in the presence of external calcium. Although a slight suppression was observed in the presence of menthol, the effect was not significant. Only dTRPA1 cells that revealed heat responses at least 2 SDs larger than the vector control heat response were included in this analysis. YFP-positive cells were tested up to 5 d after transfection with vector alone or dTRPA1. D, E, Menthol (250 μm) neither activated (D) nor inhibited (E) both mTRPA1-dTM5 (blue trace) and hTRPA1-dTM5 (red trace) as assayed by ratiometric calcium imaging. F, G, Concentration-dependence curves of menthol activation (F) and inhibition (G) of mTRPA1-dTM5 (open circles) and hTRPA1-dTM5 (open squares). H, In whole-cell voltage clamp, mTRPA1-dTM5 was not activated during 3 min exposure to 50 μm at ∼25°C and was comparable to vector-transfected cells. The response of wild-type mTRPA1 to 50 μm menthol is significantly greater. I, mTRPA1-dTM5 is not inhibited by high concentrations of menthol. The peak mTRPA1-dTM5 whole-cell current response to 100 μm MO was not significantly affected by the presence of menthol (500 μm; right set of bars, green) compared with ethanol (0.05%; brown). Data from wild type (left bars) are included for comparison. The analysis was as described in Figure 2. Examples of MO-induced responses in the presence of MO or vehicle are presented in supplemental Figure 4B (available at www.jneurosci.org as supplemental material). Conclusions were identical when data were expressed as MO response normalized to cell size. J, hTRPA1-dTM5 is not activated by menthol. There was no significant effect of 250 μm (−)-menthol on cells expressing hTRPA1-dTM5 compared to wild type. Values were not significantly different from vector-transfected cells (p > 0.1).
- Figure 6.
Specific residues in TM5 determine menthol sensitivity of TRPA1. A, Sequence alignment around the TM5 domain of mTRPA1, hTRPA1, and dTRPA1. The blue box (TM5a) indicates the region that was swapped from dTRPA1 into hTRPA1 (hTRPA1-dTM5a). Residues highlighted by yellow within the TM5a region are identical between mTRPA1 and hTRPA1 and divergent from dTRPA1. B, C, The chimera hTRPA1-dTM5a (B, C, red traces) was unresponsive to menthol. mTRPA1-S876V/T877L (blue traces) lost both menthol activation (B) and inhibition (C; note the lack of an off response in B), whereas the activation of hTRPA1-S873V/T874L by 250 μm menthol was minimal (green trace, B). D, E, Concentration-dependence curves of menthol activation (D) and inhibition (E) of mTRPA1 (black open circles), mTRPA1-S876V/T877L (red open circles), hTRPA1 (black open squares), and hTRPA1-S873V/T874L (red open squares). F, Sequence alignment around the TM5 domains of TRPA1 from mouse, rat, human, fugu, fly, and mosquito reveals that the Ser and Thr residues critical for menthol sensitivity are conserved in mammalian TRPA1 but not in other species.
- Figure 7.
Residues critical for menthol sensitivity determine the sensitivity of TRPA1 to AP18 and AMG5445. A, AP18 (50 μm) inhibited MO (30 μm)-evoked response in cells transfected with mTRPA1 (black trace), but not in cells transfected with mTRPA1-S876V/T877L (gray trace). B, Concentration-dependence curves of AP18 inhibition of mTRPA1 (open circles) or mTRPA1-S876V/T877L (filled circles) activity evoked by 30 μm MO. C, Concentration–response relationships of activation of mTRPA1 (open circles) and mTRPA1-S876V/T877L (filled circles) by AMG5445. D, Concentration–dependence curves of AMG5445 inhibition of 30 μm MO-evoked Ca2+ responses in cells transiently transfected with either hTRPA1 (open squares) or hTRPA1-S873V/T874L (filled squares).
- Figure 8.
Homology model for the TM5–TM6 domain of mTRPA1 and molecule docking. A, Sequence alignment of mTRPA1 and KcsA. The outer helix, pore helix, selectivity filter, and inner helix of KcsA are depicted. The selectivity filter of KcsA (TVGYGD) aligns with SMMLGD of mTRPA1, which may potentially form the selectivity filter of mTRPA1. B, Diagram presentation of one subunit from the mTRPA1 homology model. The residues critical for mTRPA1 to sense menthol (S877 and T878) are highlighted in blue. The G878 residue, which is a major determinant of mTRPA1-specific response to menthol (compared with human), is highlighted in red. Other residues from TM5, pore region, and TM6 contributing to the species-dependent response of mTRPA1 and hTRPA1 to menthol and AMG5445 (red in A) show side chains. The menthol molecule (purple) is docked in the mTRPA1 homology model. C, Surface view of the predicted putative menthol binding pocket. The blue area shown at the side is contributed by S876; the gray area is contributed by G878; the blue area located in the bottom of the cavity is contributed by T877. Distance coordinates suggest that the residues T877 and G878 directly interact with the menthol molecule. D, Diagram view of one subunit of mTRPA1 homology model and the docked molecule AP18.


Tables
- Table 1.
Summary of the responsiveness of hTRPA1, hTRPA1-dTM5, and hTRPA1-S873V/T874L to TRPA1 modulators
Compound Effect hTRPA1 EC50 or IC50 (μm) hTRPA1-dTM5 EC50 or IC50 (μm) hTRPA1-S873V/T874L EC50 or IC50 (μm) Menthol Activation 28.4 ± 3.6 No activation 161.2 ± 31.5 Thymol Activation 62.5 ± 3.2 No activation >400a FTS Activation 7.3 ± 1.1 No activation 11.8 ± 8.3 Trinitrophenol Activation 383.8 ± 5.7 367.9 ± 76.7 218.6 ± 3.6 MO Activation 2.33 ± 0.74 1.32 ± 0.46 0.98 ± 0.24 AP18 Inhibition 0.60 ± 0.17 No inhibition No inhibition AMG5445 Inhibition 2.23 ± 0.58 No inhibition No inhibition HCO30031 Inhibition 12.87 ± 2.67 11.47 ± 2.39 8.51 ± 1.36 Ruthenium red Inhibition 1.5 ± 0.2 0.48 ± 0.03 0.64 ± 0.13 -
↵aCould not be accurately fit with a Hill Equation.
-
Supplemental Data
Files in this Data Supplement:
- supplemental material - Supplemental Legend
- supplemental material - Supplemental Table 1
- supplemental material - Supplemental Table 2
- supplemental material - Supplemental Figure 1
- supplemental material - Supplemental Figure 2
- supplemental material - Supplemental Figure 3
- supplemental material - Supplemental Figure 4
- supplemental material - Supplemental Figure 5
- supplemental material - Supplemental Figure 6


