

Abstract
The selectivity for object-specific grasp in local field potentials (LFPs) was investigated in two awake macaque monkeys trained to observe, reach out, grasp and hold one of six objects presented in a pseudorandom order. Simultaneous, multiple electrode recordings were made from the hand representations of primary motor cortex (M1) and ventral premotor cortex (area F5). LFP activity was well developed during the observation and hold periods of the task, especially in the beta-frequency range (15–30 Hz). Selectivity of LFP activity for upcoming grasp was rare in the observation period, but common during stable grasp. The majority of M1 (90 of 92) and F5 (81of 97) sites showed selectivity for at least one frequency, which was maximal in the beta range but also present at higher frequencies (30–50 Hz). When the LFP power associated with grasp of a specific object was large in the beta-frequency range, it was usually of low power in the higher 30–50 Hz range, and vice-versa. Simple hook grips involving flexion of one or more fingers were associated with large beta power, whereas more complex grips involving the thumb (e.g., precision grip) were associated with small beta power. At many M1 sites, there was a highly significant inverse relationship between the tuning of spikes (including those of identified pyramidal tract neurons) and beta-range LFP for different grasps, whereas a positive correlation was found at higher frequencies (30–50 Hz). High levels of beta LFP and low pyramidal cell spike rate may reflect a common mechanism used to control motor set during different types of grasp.
Introduction
The primary motor cortex (M1) and the rostral division of the ventral premotor cortex (F5) form part of a parieto-frontal circuit which plays a key role in visuomotor grasp (Jeannerod et al., 1995; Rizzolatti et al., 1998). These two areas are richly interconnected, both anatomically (Godschalk et al., 1984; Dum and Strick, 2002, 2005) and functionally (Cerri et al., 2003; Shimazu et al., 2004; Schmidlin et al., 2008). Ventral premotor cortex is thought to transform visuomotor information from parietal areas, which is represented in object-based coordinates (Taira et al., 1990; Murata et al., 2000), into a motor output for reaching and grasping via M1 (Rizzolatti et al., 1998; Raos et al., 2006). Simultaneous, multiple electrode recordings from both F5 and M1, while macaque monkeys performed a visually guided reach-to-grasp task, showed that the grasp of different objects is encoded by populations of M1 and F5 neurons in a selective manner (Umilta et al., 2007). F5 neurons showed earlier selectivity than did M1, in keeping with the concept of F5 transforming visuomotor information about objects into motor commands executed via M1 (Umilta et al., 2007).
Relatively little is known about how this information is transformed and transmitted to M1. One possibility is that it involves local field potentials (LFPs), which have been implicated in information transfer in other brain circuits (Sanes and Donoghue, 1993; Singer and Gray, 1995). LFPs represent the net excitatory and inhibitory dendritic synaptic potentials in the vicinity of the recording site (Mitzdorf, 1985; Logothetis, 2003). In M1, the most prevalent activity is in the beta range of 15–30 Hz (Murthy and Fetz, 1992; Sanes and Donoghue, 1993; Conway et al., 1995; Murthy and Fetz, 1996; Baker et al., 1997; Donoghue et al., 1998; Hari and Salenius, 1999). During both preparation and execution of motor tasks, LFPs in different regions of parietal and frontal cortex have been shown to reflect both sensory and motor task parameters (Pesaran et al., 2002; Mehring et al., 2003; 2004; Rickert et al., 2005; O'Leary and Hatsopoulos, 2006).
LFPs in dorsal premotor cortex also show marked activity in the beta-frequency range (Sanes and Donoghue, 1993) but little is known about LFPs in ventral premotor cortex and specifically during observation and grasp of visible objects. Here, we demonstrate a frequency-dependent selectivity of the LFP signals recorded simultaneously in M1 and in area F5 during grasp of different objects, with pronounced selectivity in the beta-frequency range. LFP selectivity was common during steady hold, but much less so during the period when the monkey observed the object. We also show that activity in the LFP beta range was inversely related to the discharge rate of neurons recorded at the same cortical site.
Preliminary results of this study have been published previously (Spinks et al., 2005).
Materials and Methods
The data presented here were recorded from two purpose-bred adult Macaca mulatta monkeys (M39 female, 5.4 kg; M40 male, 5.0 kg). All procedures were performed in accordance with the United Kingdom Scientific Procedures (Animals) Act.
Task.
The carousel apparatus used was similar to one first used by Murata et al. (1996) and subsequently by Brochier et al. (2004), in which the task was described in full.
The task sequence (Fig. 1A–D) was as follows: The monkey was sitting quietly in darkness during the intertrial interval (usually 1–2.5 s, variable) (Fig. 1A). It was trained to exert gentle downward pressure with its hands on two “homepads” located at waist level. After both homepads had been pressed simultaneously for at least 0.2 s, a light came on and showed the monkey an object to be grasped. A red light emitting diode (LED) was reflected onto the object (Fig. 1B). This marked the beginning of the visual presentation or object observation period. After a variable delay period (1.3 ± 0.5 s), the LED changed from red to green to indicate a “GO” signal. The monkey had to release the trained hand (Fig. 1A–D, right hand) from its homepad [homepad release (HPR)] and to reach, grasp and pull the object (Fig. 1C). The object was mounted on a low-friction horizontal shuttle with a weak spring to provide resistance; a Hall effect sensor monitored the displacement of the object. The object had to be displaced into a position window between 4 and 14 mm from the starting point for a period of at least 1 s (Fig. 1D), which required a gentle force of 0.9 N (4 mm) to 2.4 N (14 mm). An auditory cue of a continuous tone was given as feedback to the monkey when the correct position was reached. After 1 s of correct holding of the object within the target position, the tone was terminated, the monkey released the object, and took a food reward from the experimenter with the other hand. The light was then extinguished, and the carousel rotated so as to present a new object for the subsequent trial. Up to six different objects were presented in a pseudorandom order using the carousel device. Throughout the trial, the nongrasping hand was required to maintain pressure on its home pad and to remain in place up until the monkey took its food reward.

A–D, Visually guided grasping task sequence. Each trial started in the dark with the monkey manually depressing two homepads (A, black squares); after a period of at least 200 ms an object in front of the monkey was illuminated. During this visual presentation period (B), the monkey fixated a red (R) LED that was reflected onto the object until, after a variable period, it changed to green (G). C, D, This was the cue for the monkey to lift the trained hand from its homepad (C) and reach out and grasp the object, and hold it steadily in a target displacement zone for ∼1 s (D). At the end of this hold period, the monkey received an auditory cue to indicate completion of a successful trial. E, Recording locations in F5 and M1. Photograph of the cortex of M39-R, showing location of the areas from which LFP together with single neuron recordings were made in M1 and area F5. CS, Central sulcus; AS, arcuate sulcus. F, Objects presented and hand posture used by the monkeys to grasp them. S, Small; L, large. The grasp used when the same object was cued to be gripped in different ways is indicated in square brackets (Table 1).
The monkeys were trained to use a specific grasp for each object presented. This was monitored with two video cameras on sample sessions to verify that the required grasps were being used. Complete training took around 10 months. The monkeys typically performed a total of 50–100 grasping movements per object during a standard recording session.
Objects used.
A variety of objects were presented to the monkeys, to evoke a range of different grasps; full details are given in Table 1 and line drawings of each object and grasp are shown in Figure 1F. All objects and grasps have been described previously (Brochier et al., 2004; Umilta et al., 2007). A different selection of objects and grasps (labeled I–VII in Table 1) were used during recording from the two hemispheres of M39 and from the left hemisphere of M40 (Table 1). The monkeys were trained to use two different grips on two of the objects (a cube and a small ring). In the normal condition these two objects had to be grasped using a side grip (the object was grasped between the thumb and the side of the index finger). A small red marker on the object (M39) or an orange LED instead of the normal red LED during the observation period (M40) indicated that these objects had to be grasped using a hook grip, in which the index finger was inserted into the object [through the small ring (Fig. 1F) or into a recess at the back of the cube]. This allowed a total of 7 grasps to be tested in M40 (Table 1).
Objects and grasps used during recording from the two monkeys, M39 (two hemispheres; six grasps I–VI) and M40 (one hemisphere; seven grasps I–VII)
Surgery.
Under deep general anesthesia, a headpiece was surgically implanted to allow head restraint. At a second surgery, a single 20 × 10 mm recording chamber was mounted so as to give access to the inferior limb of the arcuate sulcus (for F5 hand area recordings) and to the middle third of the central sulcus (for M1 hand area recordings) in the hemisphere contralateral to the trained hand (Fig. 1E). The extent of the craniotomy was based on previous MRI data (Baker et al., 1999b). After the craniotomy had been made, the arcuate and central sulci were identified through the dura and were measured stereotaxically. The top of the chamber was ∼5–7 mm above the dura. After each surgery the monkeys received a full course of antibiotics (20 mg · kg−1 · oxytetracycline, i.m.; Terramycin/LA, Pfizer) and analgesic (10 μg · kg−1 · buprenorphine, i.m.; Vetergesic, Reckitt and Colman ).
Recording of local field potentials.
M1 and F5 LFPs were recorded using two Eckhorn multiple-electrode drives (Thomas Recording). The chamber had been opened and cleaned, and the drives mounted, so that one of them targeted area F5, and the other M1. The tips of the M1 and F5 drives were usually ∼7–10 mm apart. Each drive carried 2–5 glass-insulated platinum electrodes (diameter, 80 μm; impedance, 1–3 MΩ) with an interelectrode spacing of 300 μm. The drive was positioned just above the dura, and the electrodes were inserted transdurally. The depth of each electrode was adjusted to record clearly isolated activity of a single neuron (Umilta et al., 2007).
After preamplification, the signals from each electrode were filtered to split it into local field potential (LFP, 10–250 Hz) and single-unit activity (0.3–10 kHz). Data were acquired using two A/D cards (PCI-6071E, National Instruments). Sampling rates on the A/D interface were 500 Hz and 25 kHz for LFP and spikes, respectively, and were recorded together with key behavioral events, including the timing of object illumination, homepad release, and a record of object displacement.
Recording locations
The location of each electrode penetration was determined by triangulation on fiducial markers on the chamber lid, which allowed the stereotaxic position of each new penetration to be calculated (Baker et al., 1999b). The location of recordings in M1 was verified by the use of ICMS (13 pulses at 333 Hz, intensity up to 25 μA), which elicited mostly digit and hand movements. Most of the M1 penetrations in both monkeys were made in the anterior bank of the central sulcus, whereas the F5 penetrations were made in the bank of the inferior limb of the arcuate sulcus and in the immediately adjoining convexity, as confirmed by postmortem analysis (Fig. 1E) (which is taken from M39-R).
Recording of EMG.
In both monkeys, cortical recordings were combined with simultaneous recordings of EMG activity from up to 12 digit hand and arm muscles through chronically implanted electrodes (Brochier et al., 2004).
Histology.
At the end of the experimental study, each monkey was killed with an overdose of barbiturate, and was perfused through the heart with formal saline. The postmortem brain was measured and photographed. A block of cortex containing the recorded areas was cut parasagittally, and 50 μm histological sections were mounted and Nissl stained. A full reconstruction of the recording locations was then carried out.
Data analysis.
Analysis was performed only on data recorded during successful trials. A successful trial was completed when the monkey held the home pads down until the LED changed from red to green, and then released only the home pad for the correct, working hand, displaced the object into the position window within 1 s, and held it entirely within that window for the full duration of 1 s (Fig. 2A). Typically, >90% of trials were defined as successful. In some sessions, individual electrodes had to be moved to keep track of single-unit activity. If this resulted in undue contamination of the LFP recording, as a result of microphonics caused by electrode movement, these trials were excluded from the database.
Key behavioral events were used to align data for analysis (Fig. 2A). These included: the time of object illumination (IL) near the beginning of the task, the GO signal which cued the monkey to release the home pad and grasp the object, the time of actual HPR and the time of initial object displacement (DO). Hold start (HS), when steady hold and displacement of the object was achieved, was defined as the time when the derivative of the displacement signal reached close to a zero value. Around 1 s after the monkey had successfully entered the object into the position window and maintained it there, a signal was given to indicate completion of a successful trial (REW). Both monkeys released the object some time after the REW signal was given (Fig. 2A) and collected a food reward with the other hand.
To estimate the power of LFP in different frequency bands we first bandpass filtered each LFP signal with Butterworth filters (4 order, bandwidth 5 Hz). The Hilbert transform was applied to the filtered signals and its square was used as an estimate of the LFP power. The power was estimated for 14 different 5 Hz wide frequency bands with 2.5 Hz overlap, so that central frequencies of the bands were 12.5, 15.0,…, 45.0 Hz. In the hold period of the task, there was very little power in the LFPs >50 Hz, and therefore the present study was restricted to LFP activity with frequencies between 12.5 and 45 Hz.
The two task epochs studied were the period of object observation (IL until GO) and that of stable object grasp (between HS and REW) (Fig. 2A). LFP power at the different frequencies were calculated for each successful trial, and grouped according to the object grasped, thus allowing comparisons across different epochs and objects, and further, across different sessions and cortical areas.
For population averages, LFP power was normalized across trials to a zero mean and a unit SD for each site and frequency separately. Correlation between LFP power and firing rates of single neurons recorded at the same site was estimated using mean values recorded during the steady hold period of each object.
Results
Database
This study is based on a total of 189 LFP recordings made during 41 experimental recording sessions in three hemispheres of two monkeys. In M39, a total of 50 successful recordings were made from M1 and 31 from F5 in the right hemisphere (M39-R); these data were obtained in 15 experimental sessions over a period of 5 weeks. In the left hemisphere of M39 (M39-L), 17 LFPs from M1 and 11 from F5 were collected in 7 sessions over a 10 week period. In monkey M40, 25 LFPs were sampled from M1 and 55 from F5 of the left hemisphere (M40-L) in 19 sessions over a 12 week period. In total, 26 of the sessions consisted of simultaneously recorded LFPs in M1 and F5 (15 in M39-R, 7 from M39-L, and 4 in M40-L).
Main characteristics of LFP activity during the task
M1 and F5 LFP activity during a single trial performed by M39 is shown in Figure 2, B and C, aligned with the object displacement signal (Fig. 2A) and a spectrogram of each LFP recording (Fig. 2D,E). Oscillatory LFP activity in the beta-frequency range was generally concentrated in two distinct phases of the task. These were during the period of object observation (Fig. 2A, between IL and GO) before the GO signal cueing the monkey to reach and grasp the object, and during steady hold of the object by the monkey. This began at HS in Figure 2A and finished around the time that the auditory cue indicating completion of a REW was given. Clear bursts of beta-oscillatory activity are seen in the spectrograms at ∼20 Hz in both M1 (Fig. 2D) and F5 (Fig. 2E).

LFP activity in M1 and F5 during performance of a single trial. All data from a single trial recorded in monkey M39 while observing a cube and then grasping it using a side grip. Lower time axis is in seconds relative to HPR. A, Object displacement trace, shaded area represents the target displacement window. B, LFP signal from M1. C, LFP signal from F5. D, E, Power spectrogram from the M1 LFP (D) and from the F5 LFP (E), both showing clear bursts of oscillations at ∼20 Hz during both object observation and stable object grasp; scale is the same for both plots and is in arbitrary units (black maximum, white minimum power).
As described previously (Murthy and Fetz, 1996; Baker et al., 1997), oscillatory LFP activity in the beta-frequency range typically consisted of bursts of 4–7 cycles. In any one trial, these short bursts of activity could arise at any time during the observation or hold periods. Beta bursts were very rarely seen during the dynamic phases of the task, associated with reach and grasp [between HPR and displacement onset (Fig. 2A, DO)] and with object release.
Selective beta power during the task
Figure 3 presents the average power spectra during observation (left column) and hold periods (right column) for a single recording session from an M1 site in M39-R. Figure 3A shows the average power spectra recorded during 492 successful trials. These plots show that beta activity was clearly present throughout the observation period with the earliest bursts occurring ∼200 ms after illumination onset (IL) lasting beyond the GO signal and terminating just before HPR. During the movement period between HPR and stable hold, beta power was almost absent from the LFP. Oscillations reappeared ∼300 ms after HS began and continued throughout the hold period. A higher average level of activity was present during the stable hold period compared with the observation period and this is reflected in the different lengths of the scale bars [shorter for spectrograms on the left (observation period) than for those stable on the right (stable hold period)]. Across sessions, the average maximum power during the hold period was 2.8 ± 1.2 times larger than during the observation period.

LFP activity in M1 and F5 averaged over a single recording session. All data from a single session recorded in M1 in monkey M39-R. Spectrograms from trials for observation (left) and stable hold (right) periods of the task. In the left column all trials are aligned to IL, in the right column all trials are aligned to HPR. A, Spectrograms averaged from all 492 successful trials of all objects. B, Spectrograms from trials of six different objects (S-ring, hook grip, 81 trials; cube, side grip, 82; S-ring, side grip, 87; cube, hook grip, 76; S-plate, 84; disc, 82) (Table 1). Left and right columns are scaled differently. All spectrograms from trials for the observation period (left column) have the same scale (black maximum, white minimum power, a.u.). All spectrograms from trials for the stable hold period (right column) also have the same scale (black maximum, white minimum power, a.u.), but the maximum value is ∼3.85 times bigger than the maximum value of left column, schematically shown by the length of scale bar. This difference reflects the higher level of LFP activity during grasp compared with that during observation. On average, maximum power during the hold period was 2.8 ± 1.2 times larger than during observation period. Lower time axis is in seconds relative to illumination (IL) in the left column and relative to home pad release (HPR) in the right column. Mean values across trials of GO and HPR times (left) and DO, HS, and REW times (right) are indicated with lines (A) and ticks (B). In A, SDs of event markers are shown as thick horizontal arrows centered at mean times.
Figure 3B presents the same data but plotted with reference to the six different objects-grasps that were used in this session; the number of trials per object varied between 76 and 87. There was almost no difference in beta power while the monkey looked at the different objects visible during the observation period, but a very clear variation in the amount of beta power while it was actually grasping and holding the different objects. Beta power was greatest for the cube grasped with a hook grip, and smallest for the same object grasped with a side grip (Fig. 1F).
There was also some variation in the timing of the monkey's behavior; some objects required more orientation of the arm and preshaping of the hand than others, leading to longer reach times (interval HPR to DO) for some objects (e.g., small plate compared with cube). Again, the monkey took longer to achieve stable grasp (interval DO to HS) of some objects (e.g., cube-side grip vs cube-hook grip). LFP power was therefore calculated on a trial-by-trial basis to ensure that only activity occurring in the relevant stable grasp period was included (see Materials and Methods).
Quantification of selectivity
To quantify the variation in LFP power by object, a selectivity analysis was performed. The extent of selectivity present at multiple frequencies in each LFP in the two areas during the object observation and the object grasp periods was assessed as follows. A nonparametric ANOVA (Kruskal–Wallis test) was used to compare the average LFP power values for trials of each object (6 for M39, 7 for M40; Table 1) at each of 14 frequency bands (central frequencies 12.5, 15.0,…, 45.0 Hz). This tested whether the object presented and grasped was a significant factor in the variation of LFP power at these different frequencies, and allowed comparison of the degree of selectivity across task epochs and sites. The relative number of selective sites (p < 0.01, Kruskal–Wallis test) across different frequencies is shown in Figure 4.

Selectivity of LFP activity for observation and grasp. A, B, Proportion of LFP recordings showing significant (p < 0.01, Kruskal–Wallis test) selectivity during (A) object observation and (B) stable hold of the object, in M1 and F5 at different frequencies. A value of 1 corresponds to the total number of recorded LFP sites in M39-R (50 in M1 and 31 in F5), in M39-L (17 in M1 and 11 in F5), in M40-L (25 in M1 and 55 in F5). ALL corresponds to the average selectivity during object grasp pooled over the three hemispheres investigated.
Figure 4A shows the results for the object observation period. Although there was marked LFP activity during this period, only recordings in one of three tested hemispheres (M39-R) showed any significant selectivity for object. There was slightly more selectivity in F5 than in M1, but in both cases the proportion of sites showing selectivity was small (2–8%).
Figure 4B shows the results for the stable hold period for sites in M1 and F5. In contrast to the observation period data, LFPs from all three hemispheres showed selectivity in almost all frequency bands tested. In M1 at 20 Hz the proportion of selective sites was as high as 100% in M39-L, 96% in M39-R, but somewhat lower (68%) in M40. In all three samples, a higher proportion of M1 LFPs showed object grasp selectivity than did F5 LFPs, and this was also true for the pooled data (Fig. 4B, bottom). There was some variation in the optimal frequency for selectivity across areas within a hemisphere, and across hemispheres and monkeys, although all the peak values were in the beta range rather than at either the lower or higher frequency ranges tested.
Object selectivity at different frequencies
To examine object grasp selectivity in the population LFP at each frequency, the average power for each object and grasp (e.g., plate, disc, cube-side, etc.) was calculated for each hemisphere and the corresponding set of objects. The mean values of the LFP power during grasp of each object were first normalized across trials to a zero mean and a unit SD separately for each site and frequency band and then averaged across all sites. The results are shown in Figure 5.

Grasp-related variation in M1 and F5 LFP power at different frequencies. The average LFP power (normalized for each site to zero mean and unit standard variation independently for each frequency) has been plotted (±SE) for the range of frequencies analyzed. Each color curve corresponds to the grasp of a different object. Note that grasps involving the hook grip, such as that of the small and large rings in (B), were associated with relatively large levels of beta power at lower frequencies (<30 Hz), but showed smaller levels of LFP activity at higher frequencies (>30Hz) and vice-versa for other grasps [e.g., precision grip in (B)]. Note that because power values were normalized for each frequency independently, reversal in object preference does not reflect reversal in power. A–C, Data from M39-R (A), from M39-L (B), from M40-L (C). Kruskal–Wallis test for effect of object on the population average showed significance at p < 0.05 for all frequencies and hemispheres except for 35 and 37.5 Hz (M39-R, F5); 25, 27.5 and 45 Hz (M39-L, F5), and 45 Hz (M40-L, M1).
For the M1 sites in M39-R there was a clear pattern (Fig. 5A). In the 15–22.5 Hz range of beta frequencies, the largest LFPs were recorded during grasp involving a hook grip with the index finger inserted into the small ring (continuous red line) or into the cube (continuous green line). Much lower relative levels of power were found in the higher frequency range (25–45 Hz). In contrast, the other four grasps tested, including that of the small plate (dashed dark blue line), were associated with relatively low relative levels of LFP activity in this frequency range, which rose to higher relative levels at 25–45 Hz. The cross-over point of relative power curves for different objects at ∼25–30 Hz indicated a reversal in the selectivity of LFP power. It should be stressed that this reversal in relative power does not mean that the absolute LFP power at say 35 Hz for grasp of the small plate was larger than the absolute power for grasp of this object at 20 Hz. One way nonparametric ANOVA applied to the population LFP revealed significant differences between different object-grasp combinations at all frequency bands (the Kruskal–Wallis test, p < 0.01).
The results for M39-L were similar, although the preference reversal frequency occurred at a slightly higher frequency. Once again, the largest relative LFP power in the 15–27.5 Hz range was recorded during hook grips, including insertion of the index finger into the small ring (continuous red line) and during insertion of all fingers into the large ring (light blue), with lower levels at 32.5–45 Hz. In contrast, grasp of the large plate (dark blue) and thumb-index precision grip (black) were associated with the smallest relative LFP beta power, but with relatively larger levels of activity at higher frequencies.
Changes in the pattern of LFP power in F5 resembled those recorded in M1, although LFP power was less deeply modulated than at M1 sites. It was noticeable that LFPs recorded during grasp of the same object in F5 and M1 did not always behave similarly across the range of frequencies. For example, the strong modulation for the plate in M1 LFPs in M39-L (dark blue) recordings was not seen in F5. In M40 it was also the case that hook grip of the ring was associated with relatively high LFP power in both M1 and F5. However, compared with M39, there was generally less modulation of LFP power with grasp (Fig. 5, compare A,B and C; note differences in vertical scale).
The overall trend was such that the grasp of objects which were associated with the large LFP power at the lower end of the beta range showed relatively small LFP power at the higher frequencies, and vice versa, with the reversal point at 25 or 30 Hz.
Selectivity of LFP activity for the same object grasped in two different ways
The importance of the grasp used was investigated by comparing LFP during two different grasps of the same object. This comparison was made in both M39-R and M40. In M39-R, hook grip of the small ring (continuous red line) was associated with high levels of LFP beta power in both M1 and F5, whereas side grip of the small ring (dashed red) was associated with much lower levels (Fig. 5A). A similar pattern was observed for hook grip (continuous green) and side grip (dashed green) of the cube. In M40, hook grip of small ring (continuous red line) was once again associated with high beta power in the LFP, whereas side grip (dashed red line) showed a lower level (Fig. 5C). In M40, LFP activity recorded for the hook grip of the cube had very low power (Fig. 5C, continuous green line) which was not well differentiated from that recorded during hook grip of the same object (dashed green line).
Analysis of EMG activity recorded from M40 and M39-R confirmed that in both monkeys the pattern of EMG activity in some hand and digit muscles in the hold period [1–1.5 s after the HPR (Fig. 3A)] was quite different during side grips compared with hook grips. For M39-R, the intrinsic hand muscles (thenar, 1DI and AbDM) showed particularly enhanced activity for side grip relative to hook grip: it was 112% higher for the small ring and 86% higher for the cube. In M40 these differences were less marked; for the small ring the side grip activity was 21% higher than the hook grip, whereas for the cube it was only 9% higher.
Comparing the monkeys' performance of the different grips, the most obvious feature was the involvement of the thumb in the side grips, and its lack of participation in the hook grips (Fig. 1F). This was confirmed by analysis of EMG activity in the hold period; in M39-R, muscles acting on the thumb (thenar, AbPL) were on average almost three times more active for side grips than hook grips.
Thus in M39-R there appeared to be clear differentiation between hook and side grips for both the cube and the ring, suggesting that the monkey was indeed using contrasting types of grasp. This was consistent with the pattern in the LFP beta-power selectivity (Fig. 5A). In M40, there was some differentiation in EMG activity for hook vs side grasp of the ring, and once again this was also seen in the LFPs (Fig. 5C). However, for the cube there was little or no difference in EMG activity for side vs hook grips, suggesting that the monkey was actually grasping the cube in a rather similar manner in both conditions. Interestingly there was very little difference in the beta power of LFP recorded during these two conditions (Fig. 5C, green dashed and continuous lines).
Comparison of M1 and F5 selectivity
Simultaneous recordings
To assess the degree of similarity of grasp selectivity within and across areas at the measured frequencies, the value of normalized LFP power recorded at one site during steady grasp of a given object was compared with the LFP recorded simultaneously from another site during the same session. Comparisons were made for recordings within M1 (M1-M1; 126 pairs of recordings), within F5 (F5-F5; 135 pairs) and between M1 and F5 (169 pairs). This was repeated for power values obtained at each of the 14 frequency bands. The correlation values for each set of paired recordings (M1-M1, F5-F5 and M1-F5) for each frequency band are shown in Figure 6A. The strongest correlation at all frequencies was between pairs of M1 LFPs, indicating a very strong similarity between LFPs recorded from different sites within the M1 hand area, which argues against any discrete mapping of grasp-specific LFPs within an area but which could also result from high redundancy in the recordings (see Discussion). F5-F5 LFPs were also highly correlated but significantly less for all frequencies than M1-M1 LFPs. Correlation in selectivity between M1 and F5 sites were lowest, except at 15 and 17.5 Hz and demonstrated that between-area recordings were less homogenous and showed some degree of independence in their object preference. Statistically (Wilcoxon rank sum test), correlation values between areas were significantly lower than within M1 at all frequencies, and significantly lower than within F5 at all but two frequencies (15 and 17.5 Hz). Correlations between areas were lowest at the higher frequencies tested.

Correlation of object preferences for LFP recording sites. A, Results for LFP activity recorded simultaneously from M1 and F5. The median correlation coefficients of LFP preferences estimated at different frequencies from paired sites within M1 (126 pairs), within F5 (135 pairs) and between M1 and F5 (169 pairs). Error bars correspond to SE. Data from all three hemispheres used. The highest correlation was observed within areas, and at most frequencies, pairs of M1 sites showed higher correlation than did pairs of F5 sites. Correlation between M1 and F5 was significantly smaller than correlation in M1 at all frequencies. Correlation within F5 was significantly bigger than between areas for all frequencies except 15 and 17.5 Hz, p < 0.05, Wilcoxon rank sum test). B, A similar analysis for all the other LFP data that was recorded nonsimultaneously (1543 pairs in M1, 1899 pairs in F5 and 2951 pairs between M1 and F5). Once again M1 showed the highest correlation, with both F5 and M1-F5 showing smaller values, particularly at the higher frequencies.
Nonsimultaneous recordings
Figure 6B shows the same analysis based on all recorded LFP data, but excluding data from simultaneous recordings reported in Figure 6A. Figure 6B is based on 1543 pairs of recordings from M1 and 1899 pairs from F5. The maximum area encompassing all the penetrations within M1 or F5 was ∼15–20 mm2 (Fig. 1E) and the most distant penetrations within each of these areas were separated by 3–4 mm. Figure 6B shows that LFP recordings made on different days from within M1 showed a very similar selectivity for grasp, especially in the beta range of frequencies. However, the values shown were all lower than for simultaneously recorded data (Fig. 6A), and this was particularly true at the higher frequencies. The difference between Figure 6B and Figure 6A is more obvious for LFPs recorded within F5, and for the comparison between F5 and M1 LFPs (based on 2951 pairs of recordings).
Thus when recordings were made simultaneously within an area from closely spaced electrodes, there was a high correlation in LFP selectivity. The correlation was somewhat lower when LFPs were recorded on different days, in which overall the interelectrode distance was greater (but still rarely exceeded 4 mm). These results could have resulted from spatial differences within the areas in terms of selectivity for grasp. Indeed, the location of penetrations in which LFP activity in the beta range showed selectivity for particular grasps revealed evidence for some weak clustering of sites within M1 and F5. Penetrations made in the convexity of the gyrus ∼3–4 mm rostral to the central sulcus yielded LFPs with beta power that was maximal for the hook grip of the small ring, whereas in penetrations made more caudally, closer to the sulcus, beta power was maximal for the hook grip of the cube. A similar weak rostro-caudal clustering was found in F5. However it should be stressed that we did not find a detailed map of LFPs showing high beta power for a particular type of grasp in one region of F5 (or M1), and for another type of grasp in a different region. Rather, we found that wherever recordings were made in F5 and M1, particular types of steady grasp (such as the hook grip) tend to be associated with high levels of beta power, whereas others (precision and side grips) were associated with lower levels. The preference of gamma power was even less spatially structured. Up to three different types of grasps could have the largest gamma power at almost any sampled location.
Correlation of object preferences in LFPs and spikes
To compare the object selectivity between spikes and LFPs recorded in the same areas at the same time, the object preferences of the selective LFPs in all frequency bands during the stable hold phase of the task were compared with that of spikes from single neurons recorded during the same trials at the same sites (Umilta et al., 2007).
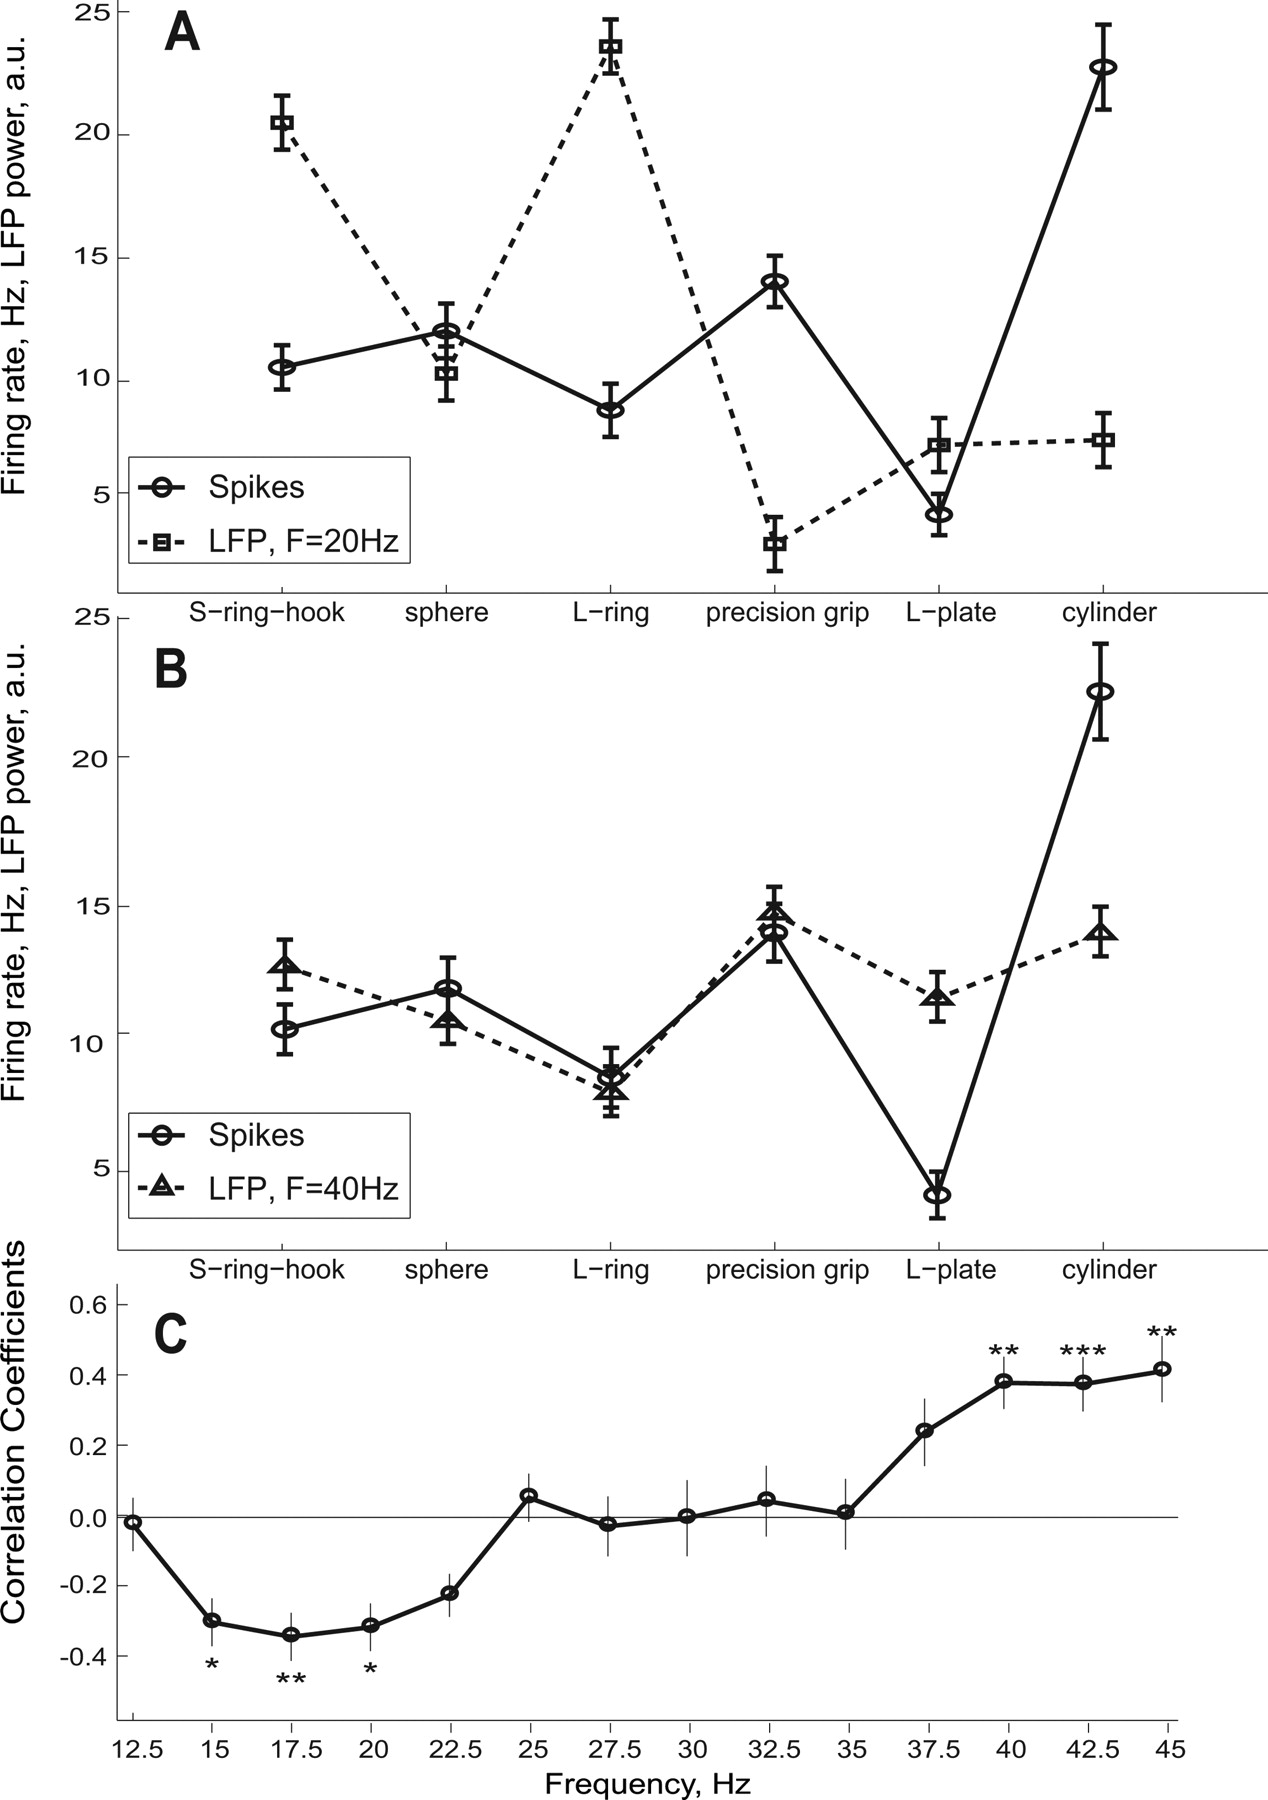
An illustrative example of data from a single site in M1 (M39-L) is shown in Figure 7,A and B. For the stable hold period of the task, the mean firing rate of a neuron recorded at this site is shown together with the LFP power at 20 Hz (Fig. 7A) and at 40 Hz (Fig. 7B). The LFP power is plotted in arbitrary units with its mean adjusted to the value of the mean firing rate. All three measures of activity recorded at this site showed object/grasp selectivity (p < 0.001, Kruskal–Wallis test). The LFP power at 20 Hz showed clear modulation across the six objects grasped, and it is clear that the maxima for LFP power (grasp of the S-ring with a hook grip and of the L-ring) were associated with minima in the firing rate for the single M1 neuron recorded at this same site (Fig. 7A). This neuron showed peak firing rate during steady grasp of the cylinder and during precision grip, when the LFP power at 20 Hz was at its lowest value. In contrast, the LFP power at 40 Hz and the spike rate closely followed each other and were positively correlated (Fig. 7B) (r = 0.59).

Correlation between LFP and single neuron grasp preferences for LFP and spikes recorded simultaneously at the same electrode site. A, Typical example of a unit taken from M1 in M39-L whose firing rate during grasp was negatively correlated with LFP power at 20 Hz (r = −0.31). Firing rate given on the ordinate, values of LFP power were normalized to the mean firing rate. B, Firing rate from the same unit, but showing a positive correlation with LFP power at 40 Hz (r = +0.59). C, Median correlation coefficients at different frequencies (M1, all three hemispheres). The average firing rate and LFP power were calculated during the grasp period. Only sites for which both LFP power and firing rate showed object selectivity during grasp (p < 0.01, Kruskal–Wallis test) were included in the analysis. Different numbers of sites were used for different frequencies (minimum 28 for 45 Hz, maximum 77 for 20 Hz, median 42). Correlation coefficients between LFP power and spike count were estimated for each site independently using mean values for each object. Error bars correspond to SE. Significance was verified by the exact two-sided sign test which does not assume any underlying distribution or its symmetry (*p < 0.05, **p < 0.01, ***p < 0.001). There was a clear negative correlation between selective LFP frequencies (15–20 Hz) and spike firing rate whereas higher frequencies were found to be positively correlated firing rate.
Overall, paired LFP/spike data were available for 79 M1 sites for which single neuron spiking and LFP power for at least one frequency showed grasp–related selectivity (p < 0.01, Kruskal–Wallis test). Of these 79 neurons, 20 were identified as pyramidal tract neurons (PTNs). The pooled data in Figure 7C shows the correlation between the power in the LFP at the different frequency points and spike count during this same stable hold period. The population result shows a highly significant negative correlation between LFP power and spike rate in the 15–20 Hz range, which then turns into a positive correlation at higher frequencies (>40 Hz). The median firing rate of units that were negatively correlated with LFP power at 17.5 Hz (in which the most significantly negative correlation was observed) was 13.5Hz. For the positively correlated units it was smaller, 8.5Hz, but mainly because of units with very low firing rates. If the units which fired <2 spikes during hold period of each trial were excluded from the comparison the difference between the two distributions was nonsignificant (p > 0.05, Wilcoxon rank sum test).
Discussion
Selective nature of LFP beta activity
The bursts of oscillatory activity in the LFP recorded during both the observation and stable hold periods of the task were dominated by frequencies in the beta range (15–30 Hz). Although oscillatory activity was clearly present during the observation period, it showed only limited selectivity for the object presented (Fig. 4A). This lack of LFP selectivity during the observation period is perhaps surprising because the LFP is considered to reflect input to the area (Logothetis, 2003; Goense and Logothetis, 2008) and, at least in F5, the neurons recorded simultaneously with these LFPs show clear selectivity for the upcoming grasp (Umilta et al., 2007).
In striking contrast, LFP power at beta frequency changed systematically with grasp configuration (Figs. 3, 4B). Grasp was a significant factor in the variation of LFP power (p < 0.01) (Fig. 4B) for a large proportion of sites sampled from all three hemispheres, and selectivity in the beta range (15–30 Hz) was greater than at higher frequencies (>30 Hz).
Because the LFP represents the net dendritic synaptic currents within the volume of tissue sampled (Mitzdorf, 1985; Logothetis, 2003; Goense and Logothetis, 2008), a level of LFP power that is specific for particular grasps confirms that populations of neurons in both F5 and M1 are active to different extents for different types of grasp and that their overall level of discharge varies according to type of grasp used, as shown by Umilta et al. (2007), their Figure 9.
Previous studies have demonstrated that LFP activity can be tuned to both the preparation (Shenoy et al., 2003; Musallam et al., 2004; Scherberger et al., 2005; O'Leary and Hatsopoulos, 2006; Asher et al., 2007) and execution of reaching movements (Mehring et al., 2003; Rickert et al., 2005), but there has been relatively little attention to selectivity for grasp. One study found that LFPs in parietal cortex were more often coded for reaching direction than for object grasp, although only two different grasps were investigated (Asher et al., 2007). This study also reported more selectivity for active grasp than for observation of objects, and interestingly found that LFP beta activity was higher for power compared with precision grip [Asher et al. (2007), their Fig. 9].
Frequency-dependent features of LFP selectivity
The largest amount of LFP beta power was associated with “hook” grips, including use of the index finger inserted into the small ring or into a slot cut in the back of the cube (Figs. 1F, 5A,B, continuous red and green lines), and insertion of all the fingers (but not the thumb) into the large ring (Fig. 5B, light blue line). Sites at which LFP power was greatest for hook grips were encountered throughout both F5 and M1. Smaller levels of beta power were observed for grips in which both the index finger and the thumb were engaged. This included the side grips of the cube, ring and small plate (Fig. 5A, dashed red, green and dark blue lines) and the precision grip (Fig. 5B, black line). The importance of grasp configuration, as opposed to object, is underlined by the finding that in M39R, the pattern of LFP activity was very different for two different types of grasp (hook and side grip) applied to the same object (Fig. 5A).
The grasp pattern which evoked the largest power in the beta range was associated with the smallest level of power at higher frequencies (>30 Hz) (Fig. 5), and vice-versa, leading to a frequency–related selectivity for grasp which reversed at ∼30 Hz. This may indicate separate generators of LFP activity at these different frequencies.
Comparison of LFP activity in M1 versus F5
Although the main characteristics referred to above were shared by LFPs recorded from M1 and from F5, M1 showed a higher proportion of sites for which object grasp contributed significantly to LFP power (Fig. 4A). Overall the tuning of LFPs to particular grasps showed similar patterns (Fig. 5), and this explains the relatively high correlation between the object selectivity for LFPs recorded simultaneously from F5 and M1 (Fig. 6A, dotted curve). Simultaneous recording from multiple sites within the same cortical area (F5 or M1) were separated by a few hundred micrometers, and it is likely that the LFP activity recorded at these short interelectrode distances is highly redundant (Legatt et al., 1980; Mehring et al., 2004). Indeed, within-area LFPs showed very high correlations in selectivity (Fig. 6A). When the selectivity of sites encountered during nonsimultaneous recordings was compared we found a somewhat lower level of correlation within M1 and lower still within F5 (Fig. 6B). This suggests some variation in the selectivity across each cortical area, and there was some evidence of a weak rostro-causal clustering of sites with preference for one type of hook grip in both F5 and M1.
Recordings between F5 and M1 were typically separated by up to 10 mm (Fig. 1E), and although the correlation in LFP grasp selectivity between these areas was still high, it was lower than for intra-areal recordings (Fig. 6A). Nonsimultaneous recordings showed lower levels of correlation than simultaneous (Fig. 6), again suggesting some independence of the LFP generators in the two cortical areas. Single trial data showed clear differences between F5 and M1 LFPs (Fig. 2 compare D, E). Furthermore, averaged LFP activity in M1 could show striking “frequency inversion” which was absent in F5 [e.g., large plate, light blue (Fig. 5B)]. Finally, the cross-over point for this frequency inversion was lower in F5 than in M1 (Fig. 5). Therefore it seems likely that generators of oscillatory LFP activity in F5 and M1 are to some extent independent and nonredundant.
Comparison of LFP and spiking activity in M1
Populations of M1 and F5 neurones can represent different types of grasp in an unambiguous manner (Umilta et al., 2007). This study shows that, during the hold period, LFP activity recorded from the same sites also varies with grasp. However, it is clear that the level of LFP power is not a simple reflection of the overall spiking pattern. For many recording sites in M1, the largest amplitude LFP activity was associated with a grasp during which the smallest rate of spike discharge was recorded (Fig. 7A). There was a systematic negative covariation between firing rate and LFP beta power during the hold period: neurons and LFP power at 17.5 Hz at 51 of 77 sites tested exhibited this feature. Averaged across all sites investigated in M1, there was a strong negative correlation between the object selectivity exhibited by neuron firing rate and LFP power at the lower end of the β range (15–20 Hz) (Fig. 7C). This then reversed to a significant positive correlation at higher frequencies (>40 Hz) (Fig. 7B).
Umilta et al. (2007) reported that the mean normalized firing rate of the population of M1 and F5 neurons sampled during the hold period of the same task (data from M39) was highest during steady precision grip and side grips, while the lowest rates were recorded during the hook grip [Umilta et al. (2007), their Fig. 9]. The opposite was true of the LFP beta activity, which was highest during the use of hook grips, and lowest during side and precision grips. Whole hand grasps of objects such as the disc and the sphere were associated with intermediate levels of spike activity and LFP beta power (Fig. 5) [Umilta et al. (2007), their Fig. 9]. Each of these different grasps involves a distinct pattern of EMG activity (Brochier et al., 2004).
Analysis of EMG activity during the hold period showed that in M40 the differentiation of the various grasps was less marked than in M39. This may have been reflected in the more compressed range of LFP β activity in M40 compared with M39 (Fig. 5, compare A,B, C), and this was particularly true for the two different grasps on the cube. However, it was still the case that highest beta power was observed during a hook grip of the small ring (Fig. 5C, continuous red line).
Although macaque M1 corticospinal neurons are more active for precision grip than power grip (Muir and Lemon, 1983; Lemon et al., 1986; Umilta et al., 2007), in humans, there is higher BOLD activation during power grip than during precision grip (Ehrsson et al., 2000). Because BOLD seems better related to LFP than to neuronal activity (Logothetis et al., 2001; Logothetis and Wandell, 2004; Goense and Logothetis, 2008), the higher BOLD activity during power grip might reflect higher levels of beta LFP power and lower pyramidal cell firing rate.
Possible mechanisms linking LFP beta power to firing rate in motor cortex
LFP activity becomes small and desynchronized during the dynamic movements associated with peak discharge among pyramidal neurons; conversely, large oscillatory LFP bursts occur during static hold periods (Murthy and Fetz, 1992, 1996; Baker et al., 1997, 2001; Donoghue, 2002). During such periods, M1 PTNs fire at low rates and in an oscillatory manner (Baker et al., 2001, 2003) when they are more susceptible to synchronization by common inputs, including those generating the β rhythm. PTNs and other cortical pyramidal cells may be held at low firing rates by GABAergic inhibitory interneurons, whose synchronized activity is essential for LFP oscillations (Pauluis et al., 1999; Buzsáki and Draguhn, 2004). This synchronized interneuronal network may act to control the level of discharge across PTNs that maintain the “motor set” required for steady grasp of a particular object (Baker et al., 1999a). Thus, although the LFP beta power and pyramidal cell firing rate negatively covary during grasp, they may reflect different aspects of the same mechanism used to control motor set.
We should emphasize that because bursts of LFP beta power can occur at different times during the hold period of grasping tasks (Baker et al.; 1997; Murthy and Fetz, 1992, 1996), the LFP-spike rate relationship has broad temporal relationship rather than one reflecting a moment-to-moment coupling.
LFP-spike relations in other cortical areas
In general, spiking activity from multiple units (MUA) recorded at the same cortical sites as the LFP shows greater selectivity than do LFPs, and correlation between the tuning exhibited by LFPs and by MUA is weak at low frequencies but stronger for frequencies in the gamma band (Pesaran et al., 2002; Womelsdorf et al., 2007), and in the awake monkey there are periods when visual cortex LFP and MUA are dissociated (Goense and Logothetis, 2008). In inferotemporal cortex, selectivity for categories of visual images by gamma LFP power and spike rate are dissociated; indeed, at some sites, spikes and LFP are negatively correlated (Kreiman et al., 2006). LFPs and spikes recorded in human medial temporal lobe show only a weak correlation of preferred image category, and moreover decoding results revealed that LFPs and spikes contain complementary information (Kraskov et al., 2007). In parietal cortex, Asher et al. (2007) reported a weak correlation between gamma power and single unit firing rate during a reach-to-grasp task. However, none of these studies showed the negative correlation between LFP beta power and spike rate that we have described here.
Conclusions
LFPs in F5 and M1 show activity that is selective for particular types of grasp. This selectivity is frequency dependent and this may have implications for the choice of signal to be used to decode motor cortical signals, for example to control a brain-machine interface (Leuthardt et al., 2004; Pesaran et al., 2006). We demonstrate a systematic negative covariation at a majority of recording sites between LFP beta power and neuronal firing rate, a finding which may help to explain how synchrony in the grasping network maintains the motor set appropriate for each category of grasp used (Baker et al., 1999a, 2001; Kilner et al., 2000).
Footnotes
-
This work was supported by The Wellcome Trust. We thank Sam Shepherd, Ed Bye, Victor Baller and Chris Seers for their expert technical assistance and Stuart Baker for valuable advice.
- Correspondence should be addressed to Dr. Roger N. Lemon, Sobell Department of Motor Neuroscience and Movement Disorders, UCL Institute of Neurology, Queen Square, London WC1N 3BG, UK. rlemon{at}ion.ucl.ac.uk


