

Article Figures & Data
Figures
- Figure 1.
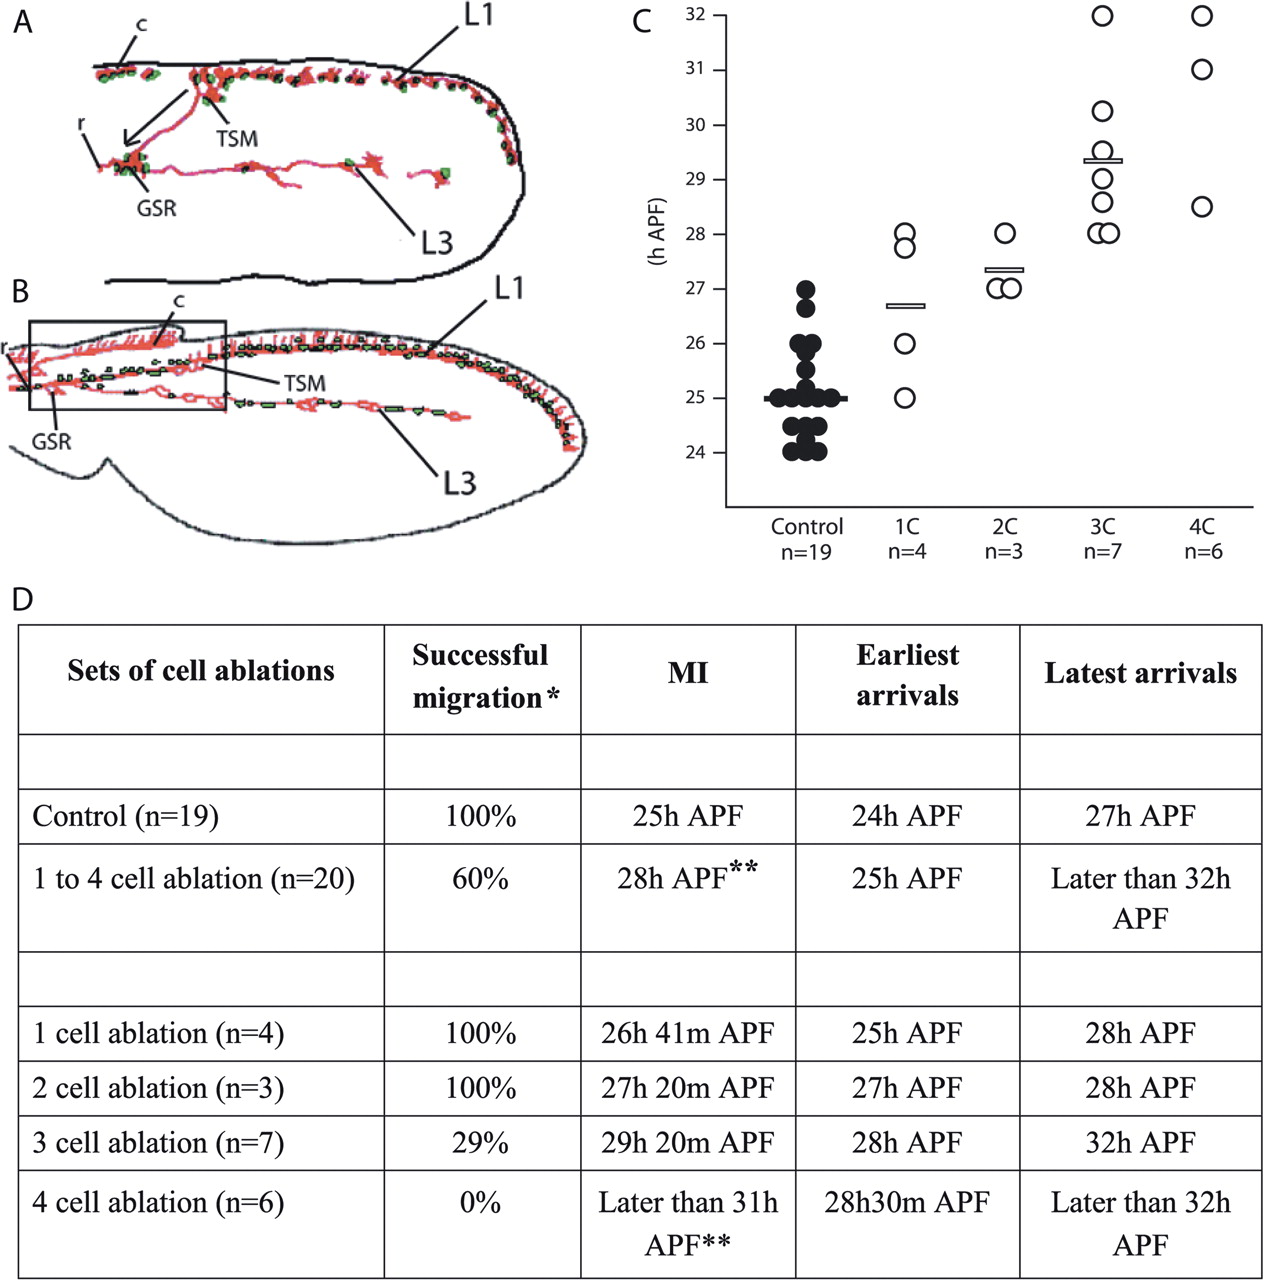
Axonal navigation and glial migration in the fly pupal wing. A, B , Schematic representation of wings before L1-glia migration (16 h APF) ( A ) and after migration completion (29 h APF) ( B ); glia in green, neurons and nerves in red. Arrow in A indicates direction of migration from anterior margin to the radius. Box in B shows the region of interest that has been analyzed by time-lapse throughout this study. L1 and L3 indicate L1 and L3 nerves respectively, GSR indicates the giant sensillum on the radius, TSM the twin sensilla on the margin, r and c correspond to radial and costal nerves, respectively. C shows raw data on ablated (white symbols) and not ablated (black symbols) wings, the number of samples is indicated (n). x-axis shows the different ablation conditions: 1c, 2c, 3c, 4c. y-axis indicates h APF. Each circle represents one sample; horizontal bars, MI values. Note that no MI was calculated for four-cell ablations, because migration is only accomplished in three of six wings. D , Summary of chain tip cell ablation data. The first column indicates the experimental conditions (control and ablated wings), the second the percentage of wings showing successful migration, the third the MI, the fourth the earliest time at which L1-glia accomplish migration, the fifth the latest time of migration accomplishment. Single asterisk, Migration is considered successful when L1-glia reach their final destination by 28 h APF. Double asterisk, MI for the pooled data (one to four cells) is underestimated, because it does not take into account the three samples of four-cell ablation in which migration is not achieved. Same for MI of four-cell ablations.
- Figure 2.
A–I , Pioneer cell ablation impairs L1-glia migration. A, E , Schematic representations of wing proximal regions at 17 h APF. Asterisks in E indicate ablated glia; neurons in red, glia in green. B–D , F–I , Confocal projections from time-lapse on repo::ncGFP flies: B–D , control not submitted to ablation and run in parallel with the wing shown in F–I , in which four cells were ablated; indicated stages apply to control and experimental wings. L1, L3, r and c indicate glia on the corresponding nerves. B–D , L1-glia have almost reached radius-glia by 25 h APF. F–I , On four-cell ablation, L1-glia migration is blocked for several hours. Inset shows L1-glia just after ablation (asterisks indicate targeted glia). The bracket indicates gap between L1-glia and radius glia. Scale bar, 40 μm.
- Figure 3.
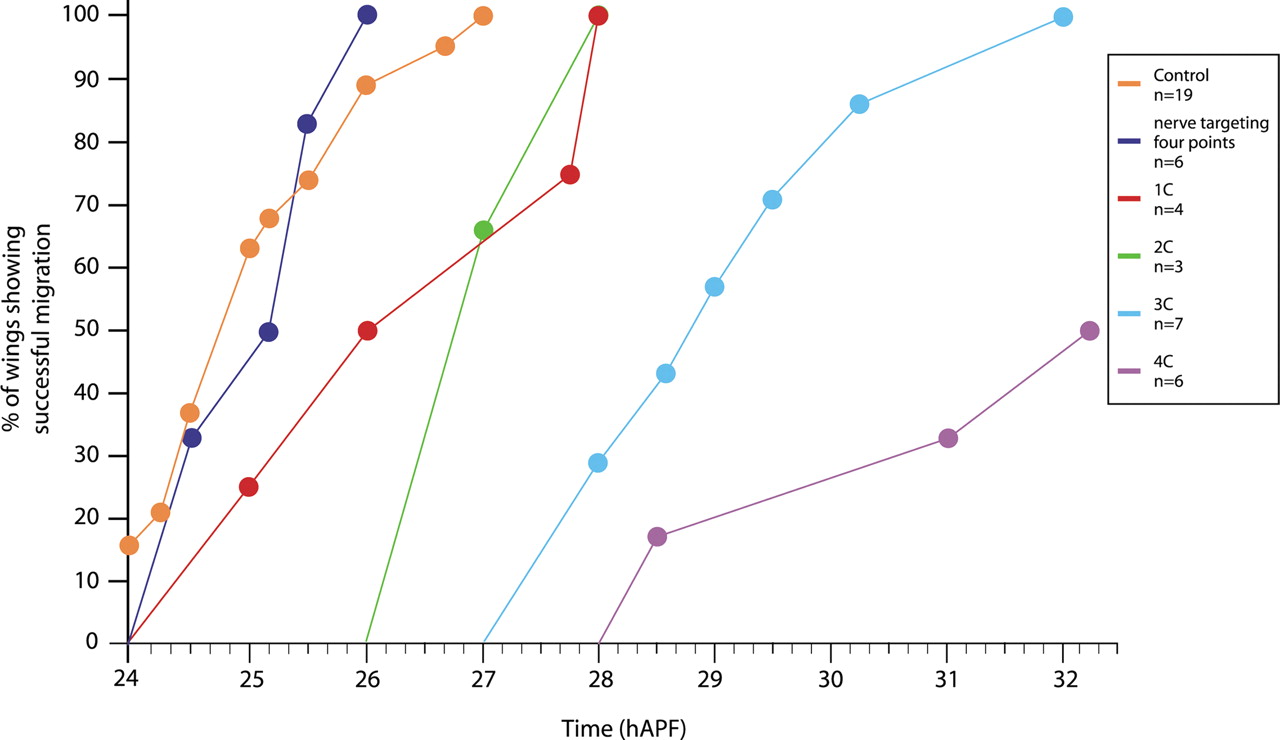
Summary of ablation experiments. The graphic shows the linear progression of migratory delay observed on increasing the number of ablated cells at the chain tip. The x-axis, The developmental time in h APF; the y-axis, the percentage of wings showing successful L1 glia migration. Experimental conditions as in the text (one to four cell ablation, nerve targeting). In this schematics, samples showing the same arrival time are indicated by a single circle.
- Figure 4.
A–L , Controls for pioneer ablations. A , E , I , Schematic representations of wing proximal regions at 18–19 h APF. Symbols are as in Figure 2. B–D , F–H , J–L , Confocal projections from time-lapse on repo::ncGFP wings. Control is shown in B–D . F–H , J–L , Wings in which either cells within the chain ( F–H ) or nerve ( J–L ) were targeted by UV laser. Note that wing in J–L also contains the elav-DsRed transgene. Indicated stages apply to control and experimental wings. Glia are labeled in green (GFP) ( A–L ), neurons in red ( J–L ). Insets show L1-glia just after UV irradiation. Note that in all conditions wings display connected glia by 26 h APF. In F–H , the arrowhead shows the cell proximal to the site of ablation. Note that gap (bracket) induced by ablation within the chain is progressively covered by migrating glia until a continuous sheath is restored ( H ). In J–L , bracket proximal to pioneer cells indicates the nerve region that was targeted by UV laser. Note that glia are able to migrate over this region ( K ). Scale bar, 40 μm.
- Figure 5.
Ablation within the chain. An example of a three-cell ablation within the wing chain. A , Cells were targeted (asterisks) at 18h30 APF, the white arrowhead indicates the proximal-most cell in the field. Note that this cell has left the field by 20h30 APF. B shows a high magnification of the area defined by the white rectangle in A just after UV laser targeting; empty arrowheads indicate the cytoplasmic processes of the cells on each side of the lesion. C–E , The vertical bar is proximal to the lesion. Glial cells distal to the lesion fill the gap, thereby forming again a uniform chain.
- Figure 6.
A–P , Cell interactions at the chain tip. A , G , L , Schematic representations of wing proximal regions at ∼21 h APF. Symbols are as in Figure 2. B–F , H–K , M–P , Confocal projections from time-lapse on repo::ncGFP flies: B–F , first four cell-ablation; H–K , +6/+7 couple ablation; M–P , +3/+4 couple ablation. Insets show L1-glia just after ablation. Arrowhead in B–F indicates a cell distal to the ablated pioneers; note that, several hours after targeting, GFP is expressed at decreased levels distal to the site of ablation (red bar in E ). Also note that connection is made in H–K by 24 h APF, as in controls, whereas wing in M–P still presents a gap at this stage. Bracket indicates gap; λ, reached L1-radius glial connection. Scale bar, 40 μm.
- Figure 7.
The distal cellular extension. MARCM identification of L1-glia in repo::ncGFP/repo::CD8GFP flies. Symbols as above. A , B , 22 h APF wings labeled with anti-Repo (red: glial nuclei), anti-Elav (blue: neuronal nuclei), and anti-GFP (green: clonal glial marker). Note that pioneer cells, arrowheads in A , B , display a DCE, whereas more distal cell does not (see supplemental Fig. 2, available at www.jneurosci.org as supplemental material). C , Confocal projections from time-lapse on four GFP-positive cells, one of them displays DCE (arrowhead), the three others do not (asterisks). The vertical bar indicates the position of DCE distal tip, showing that DCE length increases on pioneer soma translocation. Scale bars: (in A ) A , B , 30 μm; (in C ) C–F , 27 μm.


Additional Files
Supplemental Data
Files in this Data Supplement:
- supplemental material - Supplemental Legend
- supplemental material - Supplemental Figure 1
- supplemental material - Supplemental Figure 2
- supplemental material - Supplemental Movie 1
- supplemental material - Supplemental Movie 2
- supplemental material - Supplemental Movie 3
- supplemental material - Supplemental Movie 4
- supplemental material - Supplemental Movie 5


