

Article Figures & Data
Figures
- Figure 1.
Primary cilia project into the ventricle of embryonic forebrain. A–I, TEM (A–G) and (H, I) scanning EM of cilia projecting into the dorsolateral telencephalic ventricles (V) of E12.5 wild-type (A–D, H) and cbs/cbs (E–G, I) embryos. A, E, Cilium cut longitudinally. B–D, F, G, Cross sections of ventricular cilia, revealing the basal body (B, F), characteristic “9 + 0” ciliary morphology (C, G), and tapering to a “2 + 0” structure (D). E, Proximal-to-distal tapering can clearly be seen (arrow). H, I, Arrows indicate cilia. J–L, Immunofluorescence analysis of Ift88 expression in dorsolateral telencephalon of E11.5 Ift88Δ2–3βgal embryos, using an antibody recognizing β-galactosidase (J, L, red; K, green), which is expressed from the Ift88 locus. The ventricular (V) and pial (P) surface is at bottom (J, K), and top (L) of the panels, respectively. Arrows indicate characteristic somatic β-galactosidase deposits in cells colabeled with the following markers: Nestin- (J, green) and RC2-positive (K, red)VZ cells and newborn neurons (L, green, TuJ1 antibody). J–L, Blue, DAPI-labeled nuclei. Scale bars: A, C, E, G, 200 nm; B, D, F, 100 nm; H, I, 1 μm; J, K, L, 10 μm.
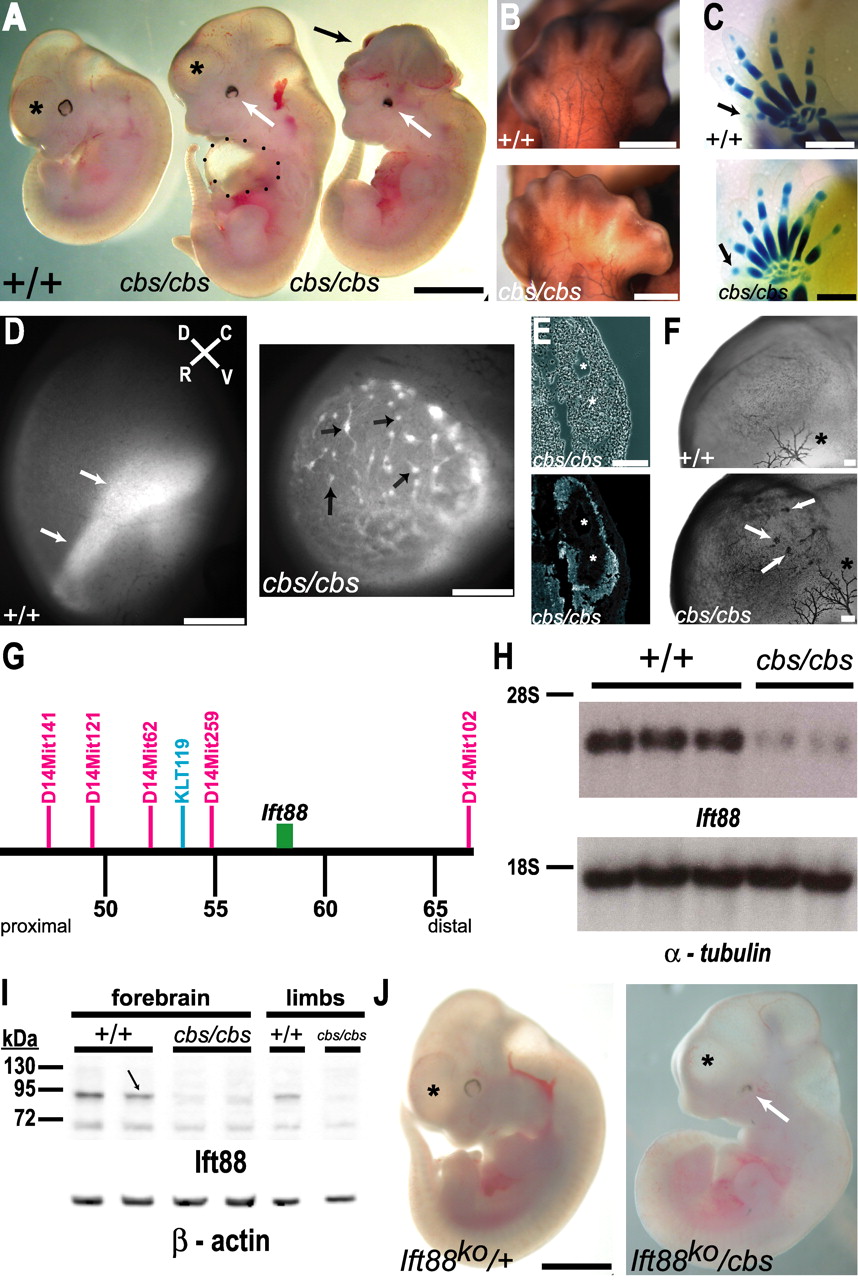
- Figure 2.
The cobblestone mutant is a hypomorphic allele of the Ift88 gene. A, E11.5 cbs/cbs mutants display a cortex (asterisk) shortened in the rostral-caudal axis (middle embryo), compared with wild-type littermates (left embryo). 10% of cbs/cbs mutants display exencephaly (right embryo, black arrow). cbs/cbs embryos display colobomas (white arrow), and an enlarged pericardial sac is often observed (black dots). B, C, cbs/cbs embryos display bilateral polydactyly on hindlimbs (B) and forelimbs (C). B, E13.5 embryos stained with an anti-165 kDa neurofilament antibody, showing hindlimb innervation. C, Alcian blue-stained E14.5 embryos, showing skeletal formation. Arrow indicates pollex. D, Whole-mount epifluorescence of E12.5 tauGFP cortex, looking down upon the pial surface. A wild-type embryo shows EGFP-signal where the lateral edge of the cortex folds over, allowing multiple layers of newborn neurons to be seen as a broad stripe of signal (left panel, arrow). In cbs/cbs mutants, heterotopias appear as 40–180 μm wide spheres (right panel, arrows), often with long trails of green signal corresponding to outgrowing axon bundles. Rostral (R), caudal (C), dorsal (D), and ventral (V) axes are indicated. E, Cross section of two subpial heterotopias in E11.5 cbs/cbs cortex. Asterisk indicates lumen of each heterotopia. Top, Phase contrast. Bottom, Stained with TuJ1 antibody, indicating newborn neurons in the heterotopia periphery. F, Anti-165 kDa neurofilament antibody staining of E11.5 forebrain. Arrows indicate heterotopias in cbs/cbs cortex. The smaller number of stained heterotopias, compared with (D), is due to reduced antibody penetration. Asterisk indicates Nervus ophthalmicus. G, Positional cloning of cbs. Distance from the centromere in million bp (black), the SNP marker used for rough mapping (blue), SSLP markers used for fine mapping (red), and the Ift88 gene (green box) are indicated. H, Northern blots of whole RNA from whole brain of E12.5 wild-type (+/+) and cbs/cbs embryos. Full-length Ift88 (top) and α-tubulin cDNAs (bottom) were used as probes. Ribosomal RNA markers are indicated (left). I, Western blots of protein from forebrain and fore- and hindlimbs (limbs) of E12.5 wild-type (+/+) and cbs/cbs embryos. An anti-N-terminal-Ift88 antibody (top), and an anti-β-actin antibody (bottom) as a loading control, were used. An arrow indicates the Ift88 band. Protein markers (kDa) are indicated (left). J, E11.5 heterozygous Ift88 knock-out embryos (Ift88ko/+) display a wild-type telencephalon (asterisk) with an elongated rostral-caudal profile (cf. A, +/+ embryo). A compound heterozygote of the Ift88 deletion allele (Ift88ko) and the cbs allele (Ift88ko/cbs) displays coloboma (white arrow) and a rostro-caudally shortened cortex (asterisk). Scale bars: A, J, 1.5 mm; B, C, D, 0.5 mm; E, F, 100 μm.
- Figure 3.
The cbs mutant exhibits a pronounced disorganization of the dorsal telencephalon. A–D, H, Hematoxylin-stained coronal sections of E12.5 wild-type (A, C) and cbs/cbs (B, D, H–J) embryos. A, B, E-G, Rostral and (C, D, H–J) caudal telencephalon. E–G, Hematoxylin-stained coronal sections of a E11.5 Ift88ko/− embryo (E), a Ift88ko/cbs compound heterozygote littermate (F), and a cbs/cbs embryo (G). A, C, E, Inset (lower left) indicates the plane of section for (A, B), (C, D), and (E–G), respectively. H, Caudal-most telencephalon showing lateral heterotopias (left, boxed). Enlargement of the boxed region shows them to have a rosette-like morphology (right). B, D, G, H, Arrows indicate heterotopias. G, Arrowhead indicates VZ. I–L, Mitotic cells revealed with an anti-phosphorylated-histone H3 antibody (green, PH3) in subpial heterotopias (I, J) and VZ of the dorsolateral cortex (K) and the ganglionic eminences (L) in E12.5 wild-type and cbs/cbs embryos. Red = anti-nestin antibody. I–L, Arrows indicate nestin/PH3-double positive cells. Arrowheads indicate sub-VZ mitoses. Asterisks indicate blood cells. M, N, O, Quantitation of PH3 staining in the cortex (cortex) and ganglionic eminences (GE), expressed as the number of PH3-positive (M) and double nestin/PH3-positive (N) cells per 100 μm of VZ, and in the number of basally located (i.e., >30 μm from the ventricular zone) PH3-positive cells per 1 mm2 (O). ***p < 0.001, Student's t test. A–L, Dorsal is to the top. H–L, Lateral is to the left; V, ventricle; P, pial surface. Scale bars: A–G, H (left), 300 μm; H (right), I–L, 50 μm.
- Figure 4.
Dorsomedial telencephalic cell types are specified but do not form morphological structures. A–E, In situ hybridization analysis of 12.5 wild-type and cbs/cbs embryos. For each coronal section, one telencephalic half is shown, with dorsal to the top, lateral to the right. Arrows indicate signal described in text. A, Ttr1. B, Wnt2b. C, EphB1. D, Lhx2. E, Reelin. Scale bars: 300 μm.
- Figure 5.
Relaxation of the pallial-subpallial boundary (PSPB) in cbs mutants. In situ hybridization (A, B, D, E) and immunohistofluorescence (C) analysis of 12.5 wild-type and cbs/cbs embryos. For each coronal section, one telencephalic half is shown, with dorsal to the top, lateral to the right. C, Red, Anti-Pax6 antibody; Green, TuJ1 antibody, recognizing newborn neurons. A, B, C, left panel, D, E, Arrows indicate the PSPB. C, Middle, right panels, Arrows indicate radial stripes of Pax6 expression at the PSPB in cbs/cbs mutants. A, Pax6. B, Ngn2. C, Pax6. D, Dlx2. E, Dbx1. Scale bars: A, B, D, E, 300 μm, (C) 100 μm.
- Figure 6.
The dorsal telencephalic-diencephalic boundary in the cbs mutant. In situ hybridization analysis of 12.5 wild-type and cbs/cbs embryos. For each coronal section, only one telencephalic half is shown, with dorsal to the top, lateral to the right. A, FoxG1. B, Lhx2. C, Emx2. D, Wnt2b. E, Ttr1. F, Shh. G, Dlx2. H, Foxd1. A–H, Arrows indicate signal described in text. C, Asterisk indicates fold in tissue. Scale bars: 300 μm.
- Figure 7.
Wnt expression and signaling is upregulated in the cbs mutant. A–F, In situ hybridization analysis of 12.5 wild-type and cbs/cbs embryos. For each coronal section from rostral (A, C, E) and caudal (B, D, F) telencephalon, only one telencephalic half is shown, with dorsal to the top, lateral to the right. A, B, Wnt7b. C, D, Wnt8b. E, F, Axin2. A–F, Arrows indicate signal described in text. Scale bars: 300 μm.
- Figure 8.
Targets of Shh signaling and Gli3 protein processing are disturbed in the forebrain of cbs mutants. A–D, In situ hybridization analysis of 12.5 wild-type and cbs/cbs embryos. For each coronal section, only one telencephalic half is shown, with dorsal to the top, lateral to the right. Scale bars: 300 μm. A, Gli3. B, Emx1. C, Emx2. D, Ptch1. E, Northern blots of whole RNA from forebrain of E12.5 wild-type and cbs/cbs embryos. Full-length Gli3 (top) and α-tubulin cDNAs (bottom) were used as probes. Ribosomal RNA markers are to the left. F, Western blots of protein from forebrain of E12.5 cbs and XtJ wild-type (+/+) and homozygous mutant (−/−) embryos. An anti-N-terminal-Gli3 antibody (top) and an anti-β-actin antibody (bottom) were used. Specific bands corresponding to the 190 kDa full-length Gli3 isoform (arrows) and the 80 kDa proteolytically processed Gli3 isoform (arrowheads) are indicated. The specificity of the antibody was shown by examining homozygous Gli3 deletion mutants (XtJ), in which neither full-length nor processed Gli3 isoforms are detectable. Protein markers (kDa) are to the left. G, Quantitation of Gli3 Western blots seen in (F), first indicating the amount of the 90 kDa (short form) Gli3 isoform, setting levels in +/+ to 1.0. A quantitative comparison of the 190 kDa (long form) isoform shows 19.4% levels in +/+ embryos, compared with the short form. cbs/cbs mutants show a 5.6-fold increase in the amount of the long form, compared with +/+ embryos, to levels greater than that of the short form in cbs/cbs embryos. The combined amount of short and long isoforms is also indicated (total). H, Quantitative real time RT-PCR was performed upon mRNA extracted from E12.5 telencephalon. Reverse-transcribed cDNA was analyzed using TaqMan probes recognizing Ptch1 and Gli1. cDNA was normalized using probes for GAPDH. I, Luciferase assays using a Gli-responsive luciferase plasmid transiently transfected into fibroblasts prepared from wild-type and cbs/cbs embryos and allowed to reach confluency. Sonic hedgehog (Shh, 1 μg/ml) was added to the cultures for 12 h before lysis and analysis of luciferase levels. Relative luminosity levels relative to Shh-untreated wild-type cells are indicated. G–I, Mean values ± SEM (n = 4–8). ***p < 0.001, **p < 0.01, *p < 0.05, Student's t test.


Additional Files
Supplemental Data
Files in this Data Supplement:
- supplemental material - Figure Legends
- supplemental material - Figure 1
- supplemental material - Figure 2
- supplemental material - Figure 3
- supplemental material - Figure 4
- supplemental material - Figure 5


