

Article Figures & Data
Figures
- Figure 1.
A, Schematic of the model. B, Example raw data output from model. C, Cross-correlation between Renshaw cell and motoneuron spikes, averaged over all possible pairs.
- Figure 2.
A, Corticomuscular coherence for simulations without Renshaw cells (black), with Renshaw cells (red), and in which Renshaw cell activity was copied from a previous simulation, thereby opening the Renshaw cell–motoneuron feedback loop (blue). B, Power spectrum of muscle force. In B, black line indicates no Renshaw cells; red, each motoneuron receives input from 20 Renshaw cells, and each Renshaw cell receives input from 50 motoneurons. Simulation length throughout 4017 s.
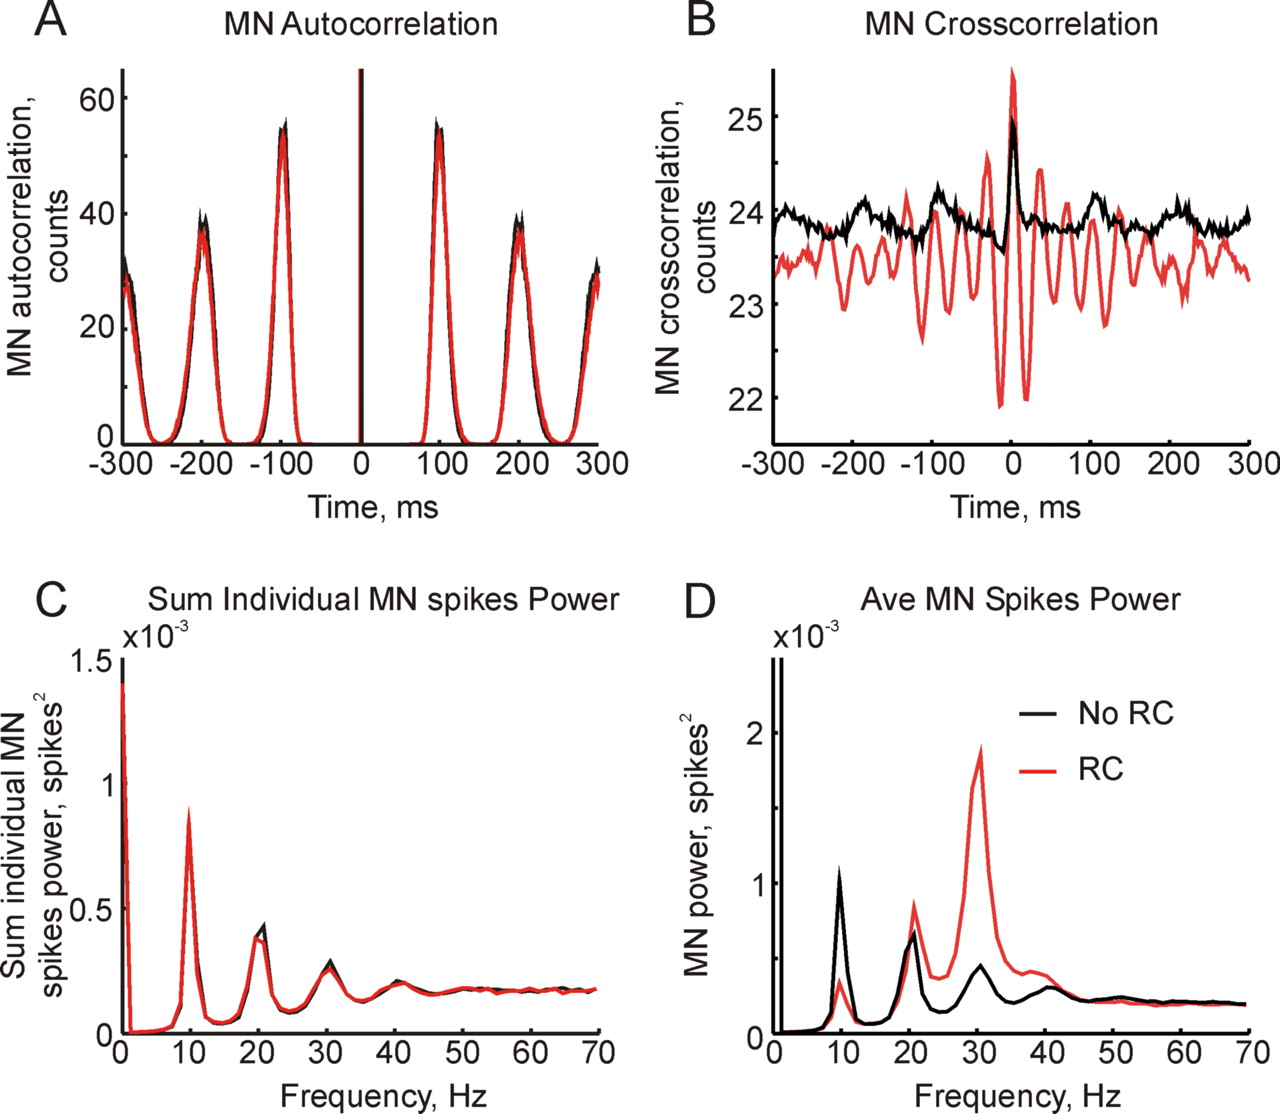
- Figure 3.
Effects of Renshaw cells on motoneuron firing properties. Black line indicates simulation without Renshaw cells; red indicates the simulation with Renshaw cells. A, Autocorrelation of motoneuron spikes, summed across the motoneuron pool. B, Cross-correlation between pairs of motoneurons, summed across all possible cell pairs. Bin width 10 ms. C, Sum of power spectra of single motoneuron spike activity. D, Power spectrum of the population discharge of the motoneuron pool.
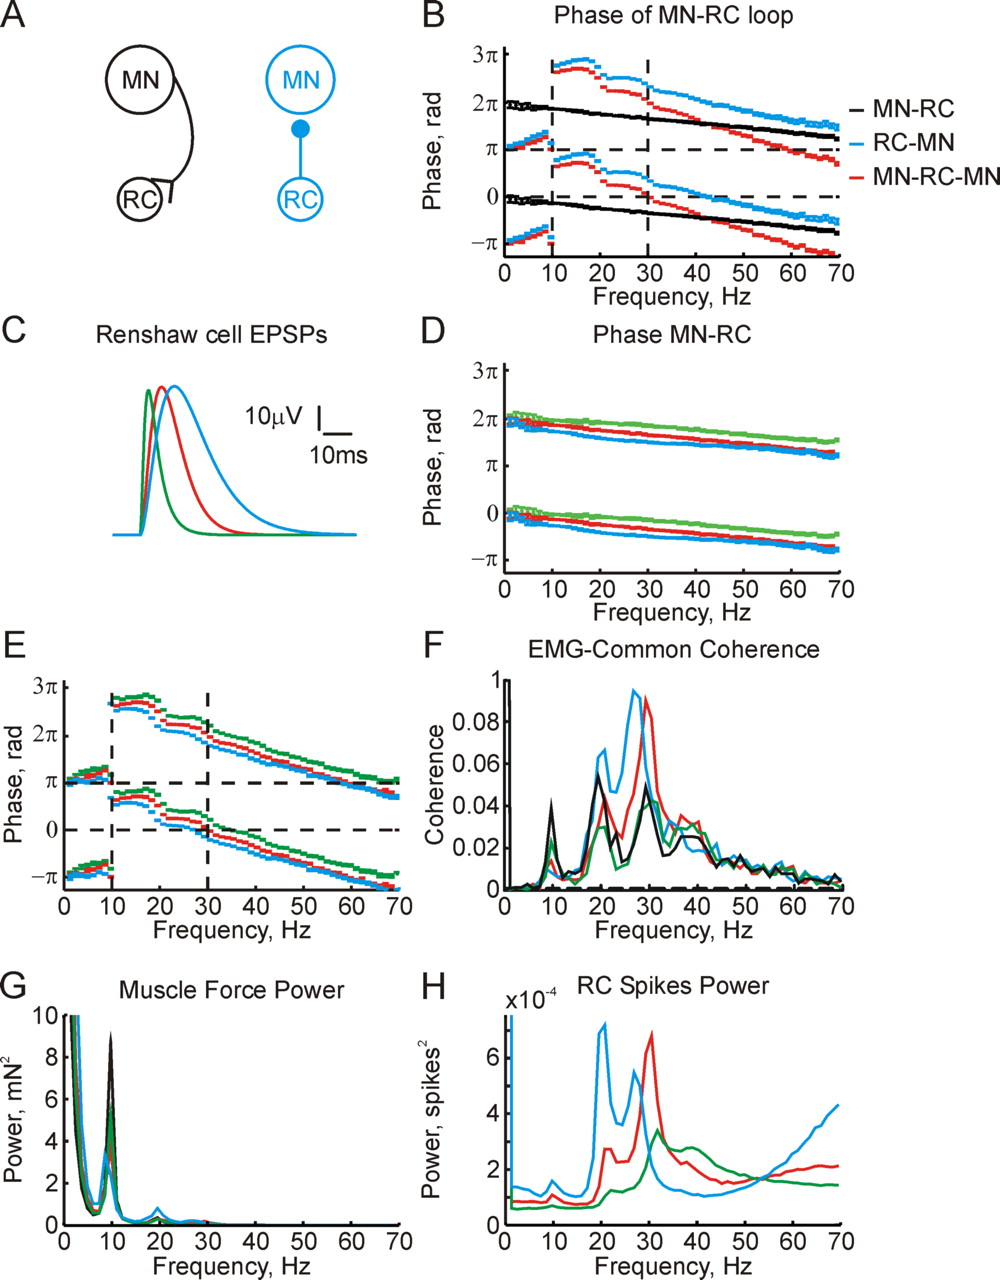
- Figure 4.
A, Schematic of connectivity in two simulations run to open the feedback loop between Renshaw cells and motoneurons. B, Coherence phase between spikes from the population of Renshaw cells and motoneurons. Black and blue lines correspond to models shown in A. Red line, Sum of phases shown by black and blue lines, estimating the total loop phase. Horizontal dashed lines mark in-phase (0 radians) and anti-phase (π radians); vertical dashed lines mark 10 Hz and 30 Hz frequencies. C, Different EPSP shapes tested in simulations described in the lines of corresponding color in the remainder of the figure. Red EPSP is the same as used in simulations in previous figures. D, Coherence phase between motoneuron and Renshaw cell spikes, for the network shown in black in A. This corresponds to the black line in B, but for the different EPSP widths shown in C. E, Total loop phase, corresponding to the red line in B, for the different EPSP widths shown in C. F, Corticomuscular coherence. G, Force power spectrum. Black line in F and G shows the results for a simulation without Renshaw cells for comparison. H, Power spectrum of Renshaw cell population spiking. Simulations were 4017 s long throughout.
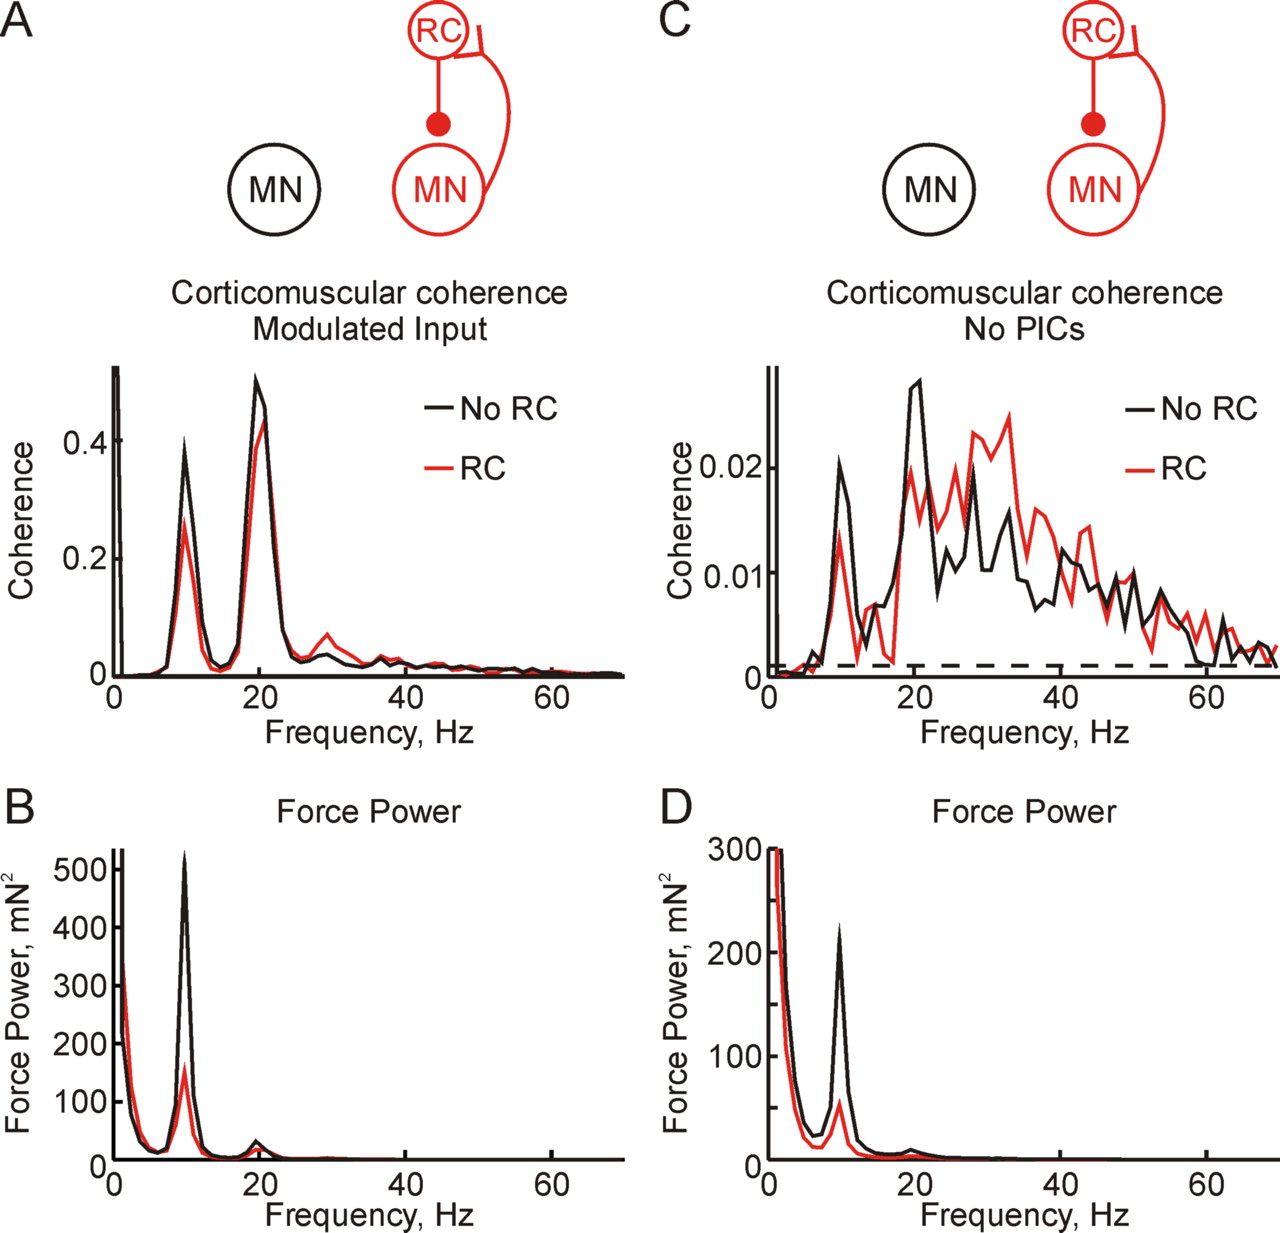
- Figure 5.
A, B, Results from simulations which used a cortical input modulated to contain power-spectral peaks at 10 Hz and 20 Hz. C, D, Results from simulations which omitted PICs from the motoneuron model. Top row (A, C) shows corticomuscular coherence; bottom row (B, D) shows force power spectrum. Black lines relate to simulations without Renshaw cells and red lines to simulations in which they were included. Simulation length throughout was 2880 s.


