

Article Figures & Data
Figures
- Figure 1.
Summary of translation preferred directions, gains, and phases. A , Polar plot of maximum response direction from n = 73 MSTd neurons responsive during 0.5 Hz translation. The angle illustrates the orientation of the vector in the horizontal plane (see diagram). The distance of each data point from the center corresponds to the neuron's response gain (in units of spikes/s/G, and G = 9.81 m/s2). Filled circles correspond to convergent neurons that respond to both translation and rotation. Open circles denote the nonconvergent neurons that only respond to translation. B , Distribution of tuning ratio, computed as the ratio of the gains along the preferred and orthogonal directions. C , Distribution of response phase (computed for the preferred direction). Note that a phase of 0° illustrates responses in phase with acceleration.
- Figure 2.
A–D , Example of MSTd neuron responses during combinations of tilt and translation: translation only ( A ), tilt only ( B ), and combined translation and tilt ( C , D ) (tilt-translation, where translational and gravitational accelerations cancelled each other and tilt+translation, where translational and gravitational accelerations added and net acceleration doubled). Data are shown along two stimulation axes (diagrams). Vertical dotted lines mark peak stimulus amplitude. This is an example of a convergent MSTd neuron that modulated significantly during roll, but not yaw and pitch rotation.
- Figure 3.
A–F , Summary of neural response amplitude and phase during tilt ( A , D ), tilt-translation ( B , E ), and tilt+translation ( C , F ), plotted as a function of the corresponding responses during translation. Each data point corresponds to an MSTd cell (n = 68), whose responses are shown either for lateral translation/roll tilt (squares) or forward/backward translation/pitch tilt (circles), whichever gave the largest modulation during translation (similar results were also seen when comparisons were made along the preferred direction). Filled symbols, Convergent neurons; open symbols, nonconvergent neurons. Solid red and dashed blue lines illustrate the predictions if cells selectively code for translation versus net linear acceleration, respectively. These are typically zero-slope or unity-slope lines, with two exemptions: slope-of-2 line (net acceleration prediction for tilt+translation amplitude) and 180°-difference diagonal lines (translation prediction for tilt+translation phase).
- Figure 4.
Test of response linearity. A , B , Comparison of tilt-translation ( A ) and tilt+translation ( B ) responses (ordinate) with the vector difference and sum (abscissa), respectively, of the neuronal responses during tilt and translation (n = 68). Note that these comparisons have been made to raw gain and phase measures along the axis of maximum translational response for each cell.
- Figure 5.
Scatter plots of z-transformed partial correlation coefficients for fits of each cell responses with translation and net acceleration models. The superimposed dashed lines divide the plots into three regions: an upper/left area corresponding to responses significantly better fit by the translation-coding model; a lower/right area includes neurons which were significantly better fit by the net acceleration-coding model; and an in-between area in which responses would not be significantly better fit by either model at a p = 0.01 significance level. As in Figure 3, each data point corresponds to a cell (n = 68), shown only for the best-responding direction of the cell: lateral translation/roll tilt (squares) or forward/backward translation/pitch tilt (circles). Filled symbols, Convergent neurons; open symbols, nonconvergent neurons. Asterisk marks the cell whose responses are shown in Figure 2.
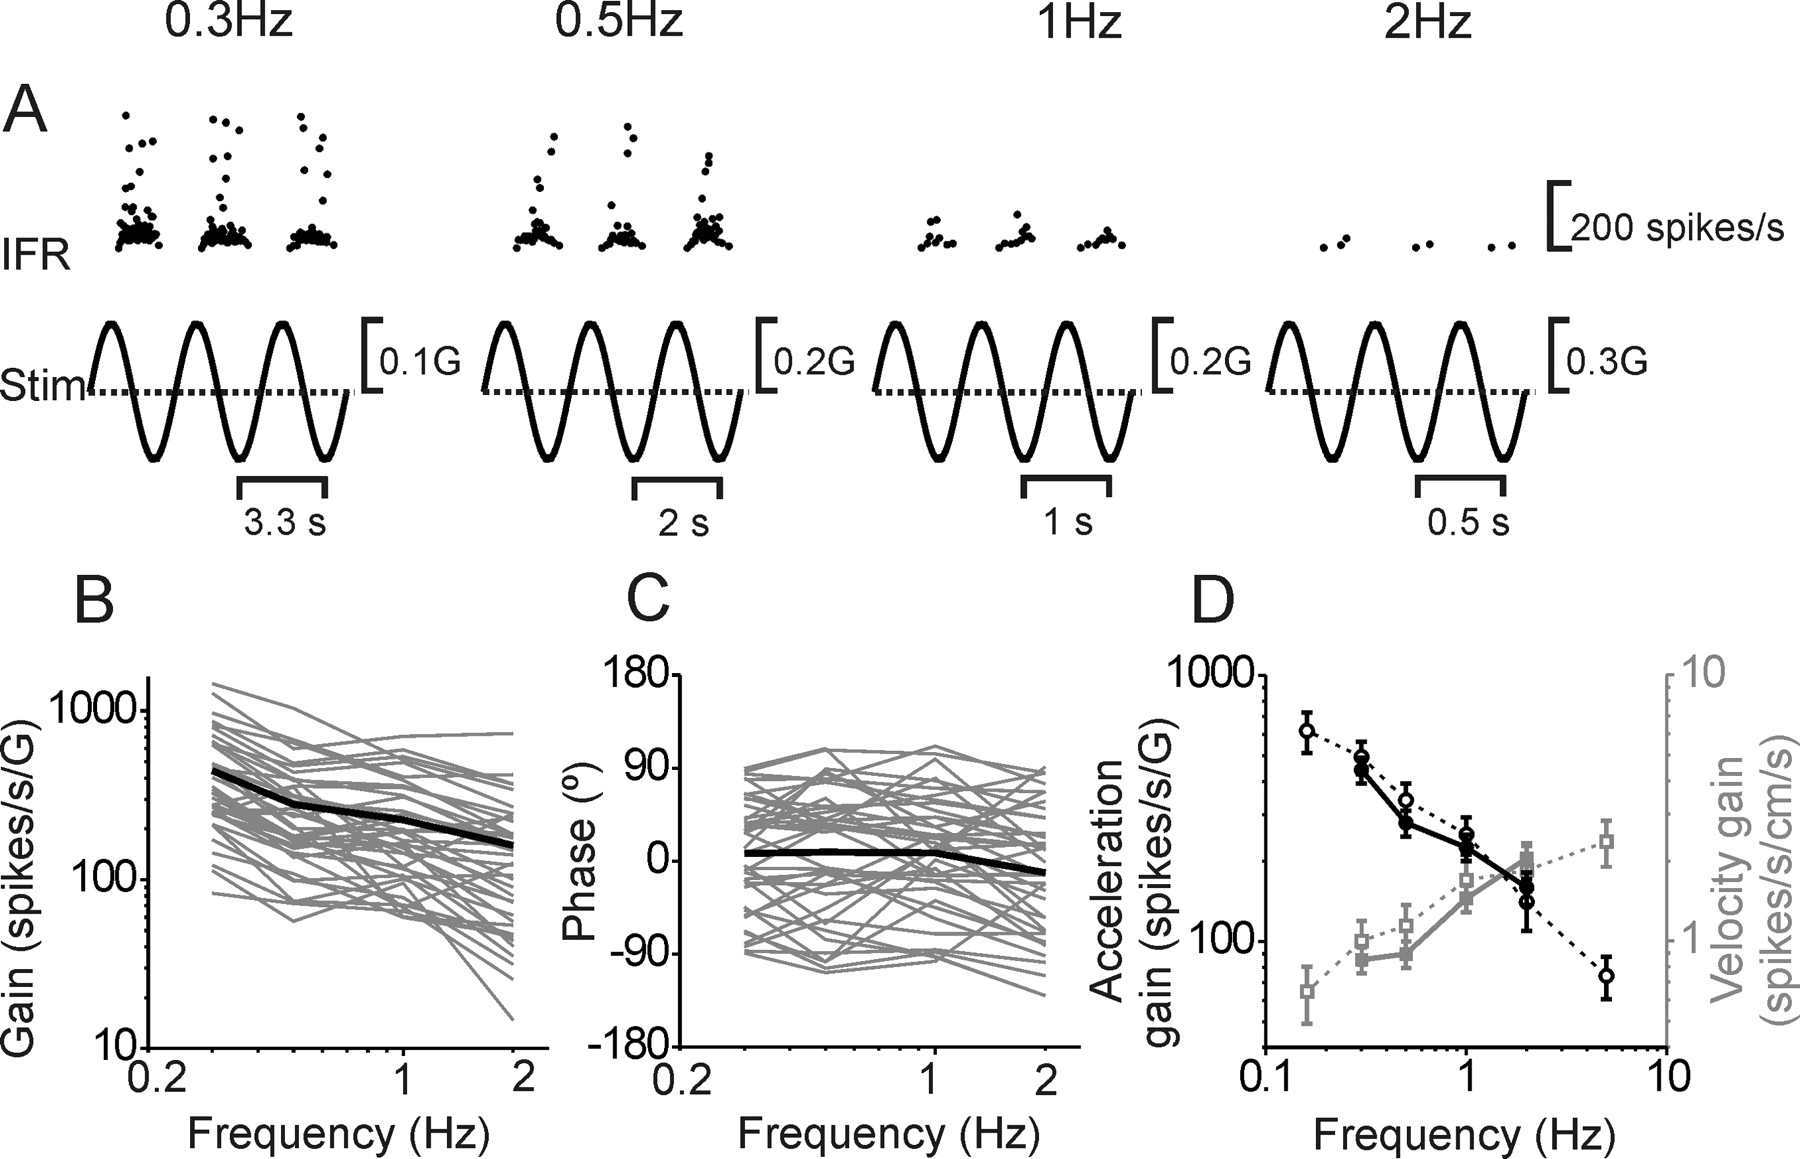
- Figure 6.
Response dynamics of MSTd neurons during translation. A , Example of translation responses at different frequencies. B , C , Neuronal gain and phase (expressed relative to linear acceleration and computed along the preferred direction; see Materials and Methods) plotted versus frequency. Thin gray lines show data from individual neurons (n = 40). Thick black lines illustrate averages. D , Average MSTd gains (filled symbols, solid lines) are compared with corresponding data from nodulus/uvula Purkinje cells (open symbols, dashed lines). Both acceleration (black symbols/line, left ordinate) and velocity (gray symbols/line, right ordinate) gains are shown. Note that neural response gains are computed along the preferred direction. Purkinje cell data are replotted with permission from Yakusheva et al., 2008 (copyright Society for Neuroscience).
- Figure 7.
Summary of rotational preferred directions. A , Instantaneous firing rate of an example MSTd cell during EVR with the monkey either upright (yaw) or statically tilted ±45°, bringing the plane of rotation half-way between yaw and roll or pitch (see diagram drawings; note that the animal was tilted in the pitch plan to provide an EVR stimulus in a yaw+roll plane; and vice versa). B , C , Polar plots of rotational preferred directions in the sagittal and frontal planes (computed from EVR stimuli, similar to those in A ). Each data point corresponds to a cell, with distance from the origin reflecting its gain (in units of spikes/s/°/s). Asterisk marks the cell whose responses are shown in A . D , E , Comparison of the pitch (circles) and/or roll (squares) gains predicted from the EVR spatial tuning with those measured during pitch/roll tilt. Dotted lines illustrate unity-slope lines.


