

Article Figures & Data
Figures
- Figure 1.
WM paradigm. The visual delayed discrimination task using abstract shapes is shown. WM load was varied by presenting either one, two, or three objects for encoding for 600 ms each with an interstimulus interval of 400 ms. After a 12 s delay interval, a probe stimulus was presented for 3 s. Participants had to judge whether or not it was part of the initial sample set by pressing a button. The intertrial interval (ITI) was 12 s.
- Figure 2.
Behavioral data (reaction time and number of successfully encoded items). The mean reaction time (top) and number of successfully encoded items (bottom) in response to a WM load of one, two, or three in controls (black line) and patients (gray line) are shown. Error bars represent SE. NC, Normal controls; SCZ, patients with early-onset schizophrenia.
- Figure 3.
Evoked oscillatory activity during WM encoding. Evoked beta (top), alpha (middle), and theta (bottom) activity after WM load 1 (left), WM load 2 (center), and WM load 3 (right) is shown for the encoding period of 3 s at posterior electrodes for controls (NC, blue, top row) and patients with EOS (red, middle row) and the group comparison in the frequency range and time window of interest (bottom row). The frequency range and the window of interest (the first sample stimulus for WM load 1, the second stimulus for WM load 2, and the third stimulus for WM load 3 are denoted in bars) are shown. On the far right, mean amplitudes in response to WM load 1, 2, or 3 are shown for the anterior and posterior ROI for patients with EOS (red) and controls (NC, blue). Error bars represent SE.
- Figure 4.
Induced oscillatory activity during WM maintenance. Induced alpha activity (top) at posterior electrodes and gamma activity (bottom) at anterior electrodes during the maintenance following the offset of the first sample stimulus for WM load 1 (left), the offset of the second stimulus for WM load 2 (center), and the offset of the third stimulus for WM load 3 (right) are shown for the early delay (500–2500 ms) and the late delay (2500–4500 ms) periods for controls (NC, blue, top row) and patients with EOS (red, middle row) and the group comparison in the frequency range of interest (bottom row). On the far right, mean amplitudes in response to WM load 1, 2, or 3 during early and late delay are shown for the anterior and posterior ROI for patients (EOS, red) and controls (NC, blue). Error bars represent SE.
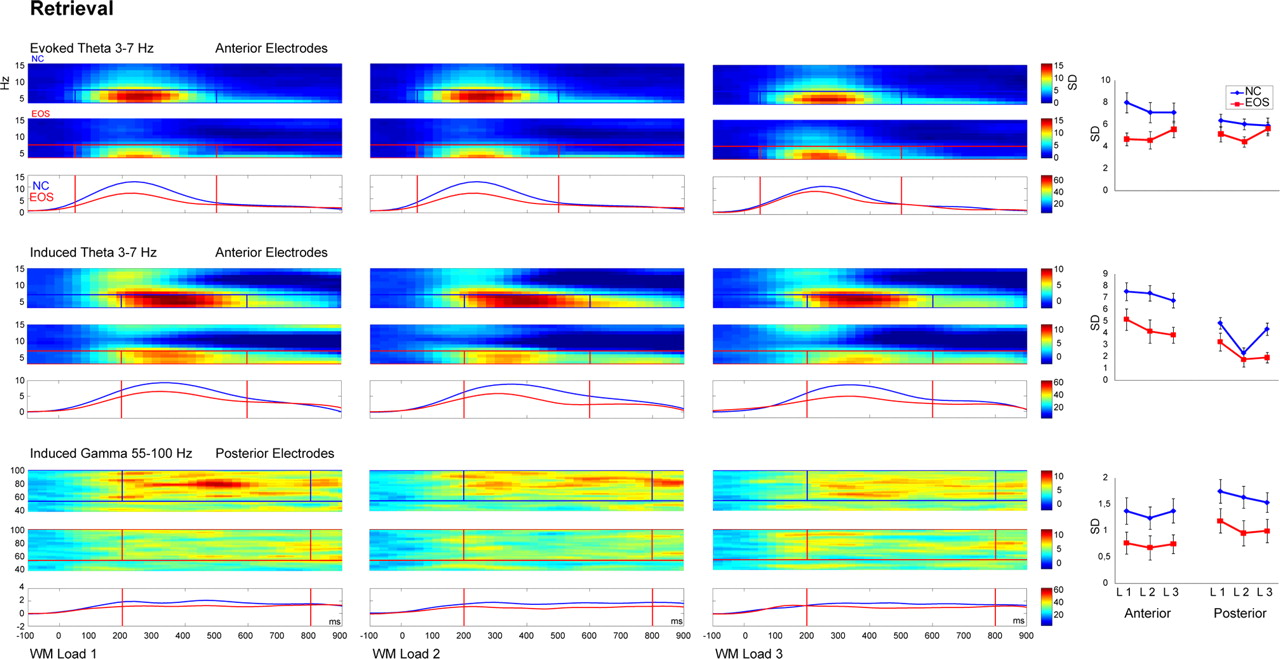
- Figure 5.
Induced oscillatory activity during WM retrieval. Evoked (top) and induced (middle) theta activity at anterior electrodes and induced gamma activity (bottom) at posterior electrodes following the test stimulus for WM load 1 (left), WM load 2 (center), and WM load 3 (right) are shown for the retrieval period of 1 s for controls (NC, blue, top row) and patients with EOS (red, middle row) and the group comparison in the frequency range and time window of interest (bottom row). The frequency and latency range of interest are denoted in bars. On the far right, mean amplitudes in response to WM load 1, 2, or 3 are shown for the anterior and posterior ROI for patients (EOS, red) and controls (NC, blue). Error bars represent SE.


Additional Files
Supplemental Data
Files in this Data Supplement:
- supplemental material - Supplemental Tables


