

Abstract
Recent findings have revealed the importance of orthonasal and retronasal olfaction in food memory, especially in conditioned odor aversion (COA); however, little is known about the dynamics of the cerebral circuit involved in the recognition of an odor as a toxic food signal and whether the activated network depends on the way (orthonasal vs retronasal) the odor was first experienced. In this study, we mapped the modulations of odor-induced oscillatory activities through COA learning using multisite recordings of local field potentials in behaving rats. During conditioning, orthonasal odor alone or associated with ingested odor was paired with immediate illness. For all animals, COA retrieval was assessed by orthonasal smelling only. Both types of conditioning induced similarly strong COA. Results pointed out (1) a predictive correlation between the emergence of powerful beta (15–40 Hz) activity and the behavioral expression of COA and (2) a differential network distribution of this beta activity according to the way the animals were exposed to the odor during conditioning. Indeed, for both types of conditioning, the aversive behavior was predicted by the emergence of a strong beta oscillatory activity in response to the odor in the olfactory bulb, piriform cortex, orbitofrontal cortex, and basolateral amygdala. This network was selectively extended to the infralimbic and insular cortices when the odor was ingested during acquisition. These differential networks could participate in different food odor memory; these results are discussed in line with recent behavioral results that indicate that COA can be formed over long odor-illness delays only if the odor is ingested.
Introduction
During food consumption, the experience of the aliment is achieved through different sensory channels. Olfaction is as such a dual modality in that it allows the organism to explore the food at once via external (distal) and internal (proximal) pathways (Rozin, 1982). Odorant molecules of the aliment could indeed reach the olfactory epithelium either via the nose (orthonasal olfaction) or via the nasopharynx when food is introduced into the mouth (retronasal olfaction) during eating and drinking (Pierce and Halpern, 1996). Psychophysical data indicate that the same odor delivered through the two routes could have different perceptual qualities (Rozin, 1982; Sun and Halpern, 2005; Hummel et al., 2006). This assumption was recently supported by dissimilarities in functional MRI brain activations (Small et al., 2005) and in event-related potentials (Hummel and Heilmann, 2008) according to orthonasal or retronasal odorant stimulations.
The sensorial image of the aliment can be associated with the consequences of food ingestion as a gastric malaise. It was previously claimed that food aversion learning depends exclusively on the taste modality (Garcia and Koelling, 1966); however, recent findings challenge this assumption and support the idea that the retronasal olfaction is also well suited to be associated with delayed postingestive consequences (Slotnick et al., 1997; Chapuis et al., 2007). Moreover, once this odor–malaise association has been established, distal odor cues are sufficient to recognize toxic food (Chapuis et al., 2007). The focus of this study is to understand how conditioned odor aversion (COA) changes the neural processing of food odor (which shifts from a neutral to a negative hedonic valence) and to what extent these modifications depend on how the odor was first experienced (either as an orthonasal or as an orthonasal and retronasal cue).
Cerebral processes supporting perception and memory can be investigated through the study of transient oscillations that reflect synchronous activities in large-scale neural assemblies (Tallon-Baudry et al., 1999; Engel and Singer, 2001; Varela et al., 2001). In rodents, both gamma (60–90 Hz) and odor-induced beta (15–40 Hz) oscillatory activities of local field potentials (LFP) have been reported to be associated with perception and the cognitive processing of olfactory stimulus (Ravel et al., 2007, Beshel et al., 2007). In a go–no-go task, beta oscillatory activity was shown to be specifically correlated with olfactory recognition in a cerebral network including both olfactory and limbic areas (Martin et al., 2004a,b, 2006, 2007) and was proposed to functionally and selectively bind areas engaged in the same stimulus representation. These studies pointed to oscillatory activities as a good way of mapping learning-induced plasticity in a network. Thus, we used them to address the question of how the mode of odor presentation could influence the extent of the network recruited by learning.
Using eight-site recordings of LFP in behaving rats, we compared the distribution of odor-induced oscillatory activity in the same neural network before and after COA in animals conditioned with only orthonasal or with both orthonasal and ingested odor. The attribution of an aversive hedonic valence to the conditioned odor was accompanied with a strong amplification of beta oscillatory activity in a network including the olfactory areas [olfactory bulb (OB) and piriform cortex (PC)], the orbitofrontal cortex (OFC), and the basolateral amygdala (BLA) for both types of conditioning. Moreover, the insular and infralimbic cortices (IC and ILC, respectively) selectively joined the network when the odor was ingested during its first presentation.
Materials and Methods
Subjects
Experiments were performed in accordance with the European Directive 86/609/EEC regarding the care and use of laboratory animals. The subjects were 20 male Wistar rats (∼280 g) obtained from Charles River Laboratories. They were kept in a temperature (22 ± 0.5°C) and humidity (50 ± 5%) controlled room, and maintained on a 12 h light/dark cycle (lights on at 7:00 A.M.). All experimental sessions were performed during the light portion of the cycle between 9:00 A.M. and 2:00 P.M. Animals were housed in groups (4–6 rats) until the surgical procedure and isolated afterward. Food and water were available ad libitum, except during the behavioral procedure when access to water was given twice a day (20 min in the experimental chamber and 30 min in the home cage at 6:00 P.M.). Subjects were handled (5 min/d) and weighed daily to assess their adaptation to hydric restriction.
Behavioral procedure
The experimental setup and the training procedure have been described in detail previously (Chapuis et al., 2007).
Apparatus
The experimental cage (Fig. 1 a) was equipped on one wall with a self-delivery drinking system constituted by a port coupled with a mobile drinking spout (1 cm below the port). Deodorized air constantly flowed through the port. The detection of a rat nose poke by optical detectors situated on the bottom of the port triggered odor delivery: a controlled fraction of odorized air was added to the main flow for a given period. After a controlled delay, the spout was introduced into the cage. Each lick given by the rat to the spout initiated a pump, which delivered a calibrated volume of solution (∼200 μl). Thus, the device allowed a rat to be exposed to the odor before having access to the water solution and to remain exposed to the odor while drinking the solution from the spout. A vacuum system ensured the odor remained confined to the port–spout ensemble. The whole set-up was controlled by C++ custom software.

Behavioral data. a , Each trial was initiated by the detection of a nose poke in the port, which triggered olfactory stimulation (30 s in total). After a delay of 4 s after odor onset, the drinking spout (containing pure water for the distal condition or odorized water for the distal–proximal condition) was made available until odor offset. During this 4 s delay, video analysis allowed us to determine the real duration of odor sampling (black bar), i.e., the minimal time spent at the vicinity of the odor port. b , Mean (+SEM) liquid consumption for each experimental session and each group (see Table 1 for details on conditions of olfactory stimulation). An asterisk indicates a significant decrease of consumption between conditioning and test sessions (paired t test; p < 0.01, at least). The D-D-a and DP-D-a groups (“aversive groups”) developed a strong odor aversion, contrary to the DP-D-n and D-D-n groups (“nonaversive groups”) and to the control group. c, Examples of licking patterns during conditioning (top) and test (down) sessions for a DP-D-a rat. Each trial (thin bars) could be followed by drink intake or no intake, expressed in terms of number of licks (black histograms). Asterisks indicate trials with very weak or no water intake.
Behavioral task
Preoperative shaping.
During 1 week, each rat was accustomed to drink from the spout 20 min per day in the experimental chamber. During each daily session, the animal was trained to initiate the introduction of the spout by making a nose poke deep into the port. The spout was available for 26 s and then retracted. After a refractory period of 5 s, the animal could initiate a new trial. During this phase of shaping, we progressively increased the delay between nose pokes and spout introduction to train the animal to wait in front of the port.
Postoperative COA training.
COA training began after a recovery period of 2 weeks. Animals were first habituated to be connected to the recording device. For each daily session, data concerning the total volume of fluid consumed, the number of trials initiated, and the licks per trial were collected. This phase was continued until the animals stabilized their water consumption (days 1–3) and performed at least 10 trials per session.
The following day (day 4) was taken as a reference session for both behavior (basal water intake measurement) and electrophysiological recordings (basal activity after a nose poke in the absence of any odor stimulation). During the conditioning session (day 5), the conditioning stimulus (CS), isoamyl acetate (Iso; Sigma-Aldrich), was introduced for 30 s in the port. Approximately 4 s after odor onset, the drinking spout was made available for 26 s, i.e., until odor offset. As during the shaping phase, a new trial could be then initiated after 5 s. Two modes of CS presentation were used in this study. For a first group of animals (D-D; n = 8), Iso was given via the port (10% of saturated vapor introduced into the air flow), while the drinking solution consisted of pure water (distal presentation). For a second group of animals (DP-D; n = 8), Iso was given via the port (10% of saturated vapor), while the spout contained an odorized but tasteless (Slotnick et al., 1997) Iso solution (0.01% in water) (distal–proximal presentation). Five minutes after the end of the drinking session, each rat was given an intraperitoneal injection of lithium chloride (LiCl; 0.4 m, 125 mg/kg, 0.75% body weight; Sigma-Aldrich) inducing a gastric malaise (US) and returned to its home cage. A control group (control; n = 4) followed the same protocol as the DP-D group, except that the animals received an equivalent volume of NaCl (0.9%) instead of LiCl.
After a recovery period to re-establish the mean baseline water intake (days 6–7, 20 min of access to water similarly to the reference session), animals were re-exposed to the CS odor during two test sessions (days 8–9). During this phase, for D-D, DP-D, and control groups, Iso was only presented in a distal way. For each animal, a decrease of at least 50% of its total consumption during test sessions compared with conditioning was used as a measure of global aversion.
On the next day (day 10), COA specificity was tested by exposing both DP-D and D-D groups to a new, distally presented odor [geraniol (Ger); Sigma-Aldrich; 44% of saturated vapor, a concentration judged similar in intensity to 10% of Iso by several experimenters]. During the following sessions (days 11–13), extinction of COA was performed by repeating test sessions with Iso on successive days. During this phase, a distal presentation was used for both groups.
The different conditions of odor stimulation during COA training are summarized in Table 1.
Conditions of olfactory stimulation according to the different experimental sessions and groups
Surgery
Based on data from the literature detailed in the discussion, we chose to study the activity of the following structures: the olfactory areas (olfactory bulb and piriform cortex), some frontal areas that are the targets of olfactory inputs (orbitofrontal, insular, and infralimbic cortices), and the basolateral amygdala, which is critical for aversive learning. We have particularly tagged the anterior and posterior parts of the piriform cortex (aPC and pPC, respectively) and the granular and agranular zones of the IC, as functional and anatomical distinctions between these divisions have been previously suggested.
Anesthesia was induced and maintained by intraperitoneal injections of equithesin (a mixture of chloral hydrate and sodium pentobarbital, 3 ml/kg). For the D-D and DP-D groups, eight monopolar recording electrodes (80 μm; 100–500 kΩ) assembled in pairs (except for the OB and the ILC sites) were all positioned in the left hemisphere according to the following coordinates (Paxinos and Watson, 1998): Posterior part of the OB (7 mm anterior relative to the nasal suture, 1.3 mm lateral and 4.5 mm ventral to bregma); aPC and the ventrolateral part of the OFC (3.2 mm anterior, 3 mm lateral, and 5.5–6.8 mm ventral to bregma, with an intertip distance of 1.5 mm); ILC (2.7 mm anterior, 0.4 mm lateral, and 5 mm ventral relative to bregma); medial part of the IC, one electrode in the granular zone (gIC) and the other in the agranular zone (aIC) (0.7 mm anterior, 5.6 mm lateral, and 5.5–7 mm ventral to bregma, with an intertip distance of 1.5 mm); pPC and BLA (2.8 mm posterior, 5.1 mm lateral, and 8–9.5 mm ventral to bregma, with an intertip distance of 1.7 mm). In the OB, the electrode was placed at the level of the mitral cell layer using electrophysiological monitoring of the characteristic large multiunit mitral cell activity (Pager, 1974). In aPC and pPC, the electrode tip was positioned at the vicinity of the pyramidal cell layer using the reversal point of the evoked potential induced in this structure in response to electrical stimulation of the OB electrode (0.1 ms pulse, 300 μA). To ensure a correct positioning in the IC, the electrode tip was first carefully lowered in the underlying piriform cortex (as previously explained) and then positioned 1.3 mm above this position. Extensive preliminary experiments were performed to determine the optimal intertip distance for the aPC–OFC, aIC–gIC, and pPC–BLA pairs of electrodes. As a consequence, once the deepest electrode of the pair was positioned in the targeted structure, we maximized the chance that the more superficial one was also correctly situated. For the control group, we limited recordings to OB, aPC, and pPC sites, since these regions were previously reported to exhibit a learning-induced modification of oscillatory activity (Martin et al., 2004a). In all rats, the reference electrode was positioned in the skull bone above the contralateral cortical hemisphere at 5 mm posterior to bregma. All electrodes were connected to a miniature socket fixed onto the rat's head by dental cement. Two weeks of recovery separated surgery from COA training.
Histological identification of recording sites
At the end of the experiment, rats were injected with a lethal dose of pentobarbital, and an electrocoagulation (1 mA; 6 s) was performed through each electrode. Animals were then transcardially perfused with physiological saline, followed by 10% formal saline. The brains were removed and postfixed before being cryoprotected by immersion in a 25% sucrose solution. Coronal brain sections (40 μm thick) were performed using a freezing microtome (−20°C) and stained with Cresyl Violet. For each rat, we were able to determine the position of each recording electrode (Fig. 2).

Schematic representation of localization of the eight recording sites [adapted from Paxinos and Watson (1998)]. Numbers on the left of the slices indicate the anteroposterior distance relative to the bregma suture. The shaded zone summarizes the extension of recorded sites obtained from all rats (OFC, most dorsal shaded zone of the slice; aPC, most ventral shaded zone; BLA, most dorsal shaded zone; pPC, more ventral shaded zone).
Electrophysiological recordings
LFPs were continuously recorded during each 20 min session of COA training. The entire experimental arena was placed in a Faraday cage. Unipolar recording of neural activity was acquired in parallel for each electrode with respect to a reference electrode. The cable was connected to a swiveling electrical connector that allowed free movements of the animal. Unitary gain field effect transistors positioned in the headstage allowed the reduction of movement and cable artifacts. The LFP signals, together with event markers (odor onset and offset, nose pokes, and licks), were recorded full-band (0–5 kHz), digitized (sampling frequency, 3 kHz), and stored on a personal computer using Tucker Davis Technologies equipment (TDT, System 3).
Video acquisition and analysis
Each 20 min session of COA training was video recorded by two cameras (acquisition rate, 25 images/s; RS170): one camera provided an overview of the entire cage, while the other focused on the port–spout ensemble. Videos were acquired and analyzed with the Video Off-Line and Comportment Analysis Software (VOLCAN; http://olfac.univ-lyon1.fr/unite/equipe-07/activite/volcan.html). Our aim was to precisely correlate animal odor sampling behavior to the electrophysiological recordings. Thus, and according to previous pilot studies, we defined a zone in the vicinity of the port–spout ensemble where the probability for the animal to be exposed to the odor was maximal despite being out of the triggering zone (deep in the port). Indeed, once the animal had triggered the odor by putting its nose deep in the odor port, it usually moved between one or two centimeters away and sampled the odor. For this reason, we performed a postacquisition analysis comprising of two steps: (1) we coded for each trial of the COA training sessions the rat's nose position relative to the odorized zone (Fig. 1 a) or to the same (odorless) spatial region for the reference session, and (2) we used this code to precisely classify epochs of electrophysiological signals to analyze.
Data computation
Behavioral markers (odor onset and offset, nose pokes, licks, nose position relative to the odorized zone), electrophysiological data, and video-LFP signals synchronization parameters were exported and stored in a MySQL engine database. All subsequent analyses were performed with software written in the Python language and its scientific data processing module (SciPy).
LFP analysis
Raw data were first visually inspected, and only the electrodes presenting a good signal-to-noise ratio were kept for analysis; any trial showing artifacts was discarded. The time window of analysis was centered on the first nose poke detection of each trial (triggering odor onset). Two temporal periods were determined: a 1 s baseline period extending from 1.5 to 0.5 s before the trial initiation and an odor period (from 0 to 4 s max) between the trial initiation and the drinking spout access, which coincided for all behavioral groups with the moment when the odor was distally presented. For each trial, the duration of the odor period was determined by the duration of odor sampling (i.e., the time spent by the animal in the odorized zone) (Fig. 1 a); however, trials in which odor sampling lasted for <100 ms were excluded. The same procedure was used for the reference session (the period of analysis corresponding then to the time spent in the same but non-odorized zone) to determine the basal activity in the absence of olfactory stimulation.
Signal analyses were performed with the OpenElectrophy Software (http://neuralensemble.org/trac/OpenElectrophy). The first step of signal analysis consisted of extracting the spectral components of the signal by applying a continuous wavelet transform (Mallat, 1989) between 0 and 100 Hz. The wavelet used here was the Morlet wavelet (Kronland-Martinet et al., 1987), defined in the time domain by Ψ(t) = (1/2π) e −i2πf0t e −t2/2 and in the frequency domain by Ψ(f) = (1/2π) e −2π2(f − f0)2. This transformation leads, for each trial, to a time frequency matrix where each point represents the level of energy for a given instant and a given frequency: hot color spots represent transitory oscillations. The method used to quantify changes in the beta (15–40 Hz) frequency band is based on the wavelet ridge extraction previously described by Roux et al. (2007) and applied to biological signals by Cenier et al. (2008). For each trial, a power threshold (mean + 3 STD) was calculated between 15 and 40 Hz on the baseline period. Wavelet ridge extraction allows for the detection of bursts of oscillation above this threshold and gives their energy, their precise temporal position, and their instantaneous frequency and phase (features exported in the MySQL database). Only bursts presenting at least three oscillatory cycles were considered as relevant and kept. Evoked potentials were discarded of the analysis. For each trial, we obtained a value of energy corresponding to the averaged power of all oscillations detected during the odor period. To allow interstructure comparisons, this value was normalized for each trial by the mean power of the baseline period in the beta frequency band.
Gamma band activity (60–90 Hz) was analyzed by extracting the mean power between 60 and 90 Hz for the reference and the odor periods. As described previously (Ravel et al., 2003; Martin et al., 2004a,b), we observed a reproducible depression of power during the odor period relative to the baseline period in the OB, aPC, pPC, and also in the OFC and ILC (data not shown); however, this decrease was constant over the different sessions (conditioning, test, and extinction), the learning criterion (aversive or not), and the odor (Iso or Ger). As a consequence, data are not presented here.
Because of the difficulty of interpreting the origin of theta rhythm (respiratory activity or endogenous theta from the limbic system share the same frequency domain) in behaving animals, the 0–15 Hz band has not been analyzed. However, modulations of OB signals in this band have been used punctually to estimate qualitatively changes in respiratory rhythm.
Statistical analyses
In regard to behavioral results, we assessed whether the total consumption, the total number of trials, or the total number of licks per trial were different according to experimental sessions and groups of animals. For a particular experimental session, the different groups of animals were compared with a Kruskal–Wallis test. Within-group comparisons were analyzed with paired t tests.
Concerning electrophysiological data, for each rat, we obtained a variable amount of trials corresponding to each of the recording sessions (reference, conditioning, test, geraniol, and extinction). Effects of the following factors were assessed on mean power values in the beta (15–40 Hz) frequency band: session, recording sites (OB, aPC, pPC, ILC, OFC, aIC, gIC, and BLA), learning (aversion or no aversion), and odor mode of presentation during conditioning (distal or distal–proximal). As the distribution of power value is not normal, statistical comparisons were performed with nonparametric tests. One-way ANOVAs were performed using the Kruskal–Wallis test to support the influence of a given factor. Then, all pairwise differences were tested using the Mann–Whitney U test for unmatched samples.
Results
Behavioral task
As described previously (Chapuis et al., 2007), a rat was considered to exhibit an aversive behavior when a reduction in consumption of at least 50% was observed on the test session compared with the conditioning session. According to this criterion, six of the eight animals of each of the D-D and DP-D groups developed an odor aversion. As a consequence, animals of the DP-D and D-D groups were allocated to four subgroups: DP-D aversive (DP-D-a; n = 6), DP-D nonaversive (DP-D-n; n = 2), D-D aversive (D-D-a; n = 6), and D-D nonaversive (D-D-n; n = 2). Moreover, a control group (n = 4) followed the same protocol as the DP-D group but was not conditioned (they received an injection of physiological saline instead of LiCl during the conditioning session) and consequently did not exhibit any aversion during testing. The consumption behavior of the different subgroups was then separately analyzed for all of the experimental phases. Results concerning the mean liquid consumptions are illustrated in Fig. 1 b, whereas those concerning the mean number of trials and licks/trial are represented in Table 2. Since the three variables showed similar trends, only the consumption data are described in detail.
Mean (±SEM) number of trials and licks per trial for each experimental session and group
Water baseline
A Kruskal–Wallis test applied to the reference session did not reveal differences between groups in baseline water intake (p = 0.7750).
COA acquisition
During the conditioning session (first presentation of the CS), all the animals drank the same amount of liquid: water for the D-D-a and D-D-n groups or odorized tasteless water for the DP-D-a, DP-D-n, and control groups (Kruskal–Wallis; p = 0.8711). As illustrated with the licking pattern presented in Figure 1 c, the animals performed trials that were regularly distributed throughout the session and were followed by comparable drink intakes. Paired t tests reveal no difference between the reference and the conditioning sessions (p > 0.05 for all groups), which could indicate an absence of neophobia against Iso (no matter how it was presented). During the next 2 d between conditioning and the tests, all groups showed a normal consumption of water (data not shown).
COA retrieval
Aversive groups.
All of the animals of both the D-D-a and DP-D-a groups presented a strong decrease (>50%) of their consumption of water between the conditioning and test sessions, which demonstrates a clear aversion to Iso. No difference was found between the two test days (p > 0.05 for both groups), which indicates an absence of extinction between these two sessions. The intensity of odor aversion was similar for the two groups (for the two tests together, decreases in water intake of 73 ± 7% and 78 ± 7% were measured for the D-D-a and DP-D-a groups, respectively). This result confirms that, in the case of a short CS–US delay, no behavioral difference is detectable during the retrieval phase between animals that have or have not ingested the odorant tasteless solution during acquisition (Chapuis et al., 2007).
An animal is classically judged as aversive on the basis of its decrease of consumption measured during the entire session (Ferreira et al., 2005; Chapuis et al., 2007); however, our experimental design allowed us to distinguish, within aversive groups, two behavioral responses across the different trials of the same test session. As illustrated by the examples of licking pattern (Fig. 1 c), some trials were characterized by a severe decrease or an absence of drink intake, whereas in others, the animal exhibited a drink intake similar to the trials of the conditioning session. When compared with average values observed during conditioning, water intake on a given trial during the two test sessions was considered as reduced if one of the following criteria was fulfilled: the number of licks was lower than the average value SD, the latency of the first lick once the spout was made accessible was >5 s, and the interval between two licks trains was >10 s. If none of these criteria was met, the trial was classified as “normal intake.” “Decreased intake” trials represented averages of 73 ± 5% and 67 ± 6% of the total number of trials (tests 1 and 2, respectively) for the D-D-a group and 68 ± 7% and 64 ± 5% of the total number of trials (tests 1 and 2, respectively) for the DP-D-a group. Animals of D-D-n and DP-D-n groups presented <10% of trials classified as decreased intake.
Nonaversive and control groups.
During the two successive test sessions, neither the control group nor the D-D-n and DP-D-n groups exhibited a decrease of consumption compared with conditioning.
COA specificity
A Kruskal–Wallis test applied to the geraniol session did not reveal differences between groups in baseline water intake (p = 0.6000). For the D-D-a and the DP-D-a groups, there was no significant difference of consumption between the geraniol and the reference sessions (paired t test, pD-D-a = 0.5341; pDP-D-a = 0.1210) or the conditioning session (pD-D-a = 0.5965; pDP-D-a = 0.2387), which indicates that animals did not generalize their odor aversion against Iso to Ger. The pattern of licking was also stable across trials for all the groups during the geraniol session.
COA extinction
After 3 additional days of extinction tests (tests 3, 4, and 5), animals of both the D-D-a and DP-D-a groups had recovered their level of consumption measured during the conditioning session. The same time course of extinction was observed for both groups (data not shown).
Electrophysiological outcomes
The positioning zones of the different electrodes are summarized on Figure 2. For each experimental group (D-D-a and DP-D-a) and each daily session, data for a given recording site concerned at least n = 4 rats and m = 81 trials. For each D-D-n and DP-D-n group, data concerned n = 2 rats and at least m = 40 trials per daily session (data of the BLA for the D-D-n group and the OFC and pPC for both groups are not shown because they only concerned one rat). For the control group, data concerned n = 4 rats and at least m = 72 trials per daily session for the three recorded sites (OB, aPC, and pPC).
A total number of 1689 signal epochs has been analyzed. The percentage of trials eliminated attributable to recording noise or artifacts is inferior to 2.5% and evenly distributed across the different phases of conditioning. LFP analysis consisted in the detection of oscillatory bursts activities during the first seconds of sampling of the distal odor cue (before the spout was made available). Regarding the duration of odor sampling, there was no significant difference between the different experimental sessions or between the different groups. The median value of the sampling duration (measured by the time spent in the odorized zone) was 2.9 ± 0.7 s.
Modulation of odor-induced beta oscillatory activity through COA learning
Examples of the LFP signals recorded during odor sampling are illustrated in Figure 3. As explained in Materials and Methods, we focused on the quantitative analysis of data extracted in the beta frequency band from the wavelet analysis. They are presented in Figures 4 ⇓ ⇓–7. To compare the beta-band activity elicited by odor sampling across the different structures, we express the amplitude of the signal as an average ratio of the power of the odor sampling period over the baseline period. Statistical analyses per formed on the power of the odor-induced beta oscillatory activity reveal a significant effect of the session (reference, conditioning, test, geraniol, and extinction; Kruskal–Wallis test, p < 0.00001), the behavioral response (aversion or no aversion, Mann–Whitney U test, p < 0.0033), the odor mode of presentation during conditioning (distal or distal–proximal, Mann–Whitney U test, p < 0.012), and the recording site (Kruskal–Wallis test, p < 0.00001). Details of these effects are explained hereafter.
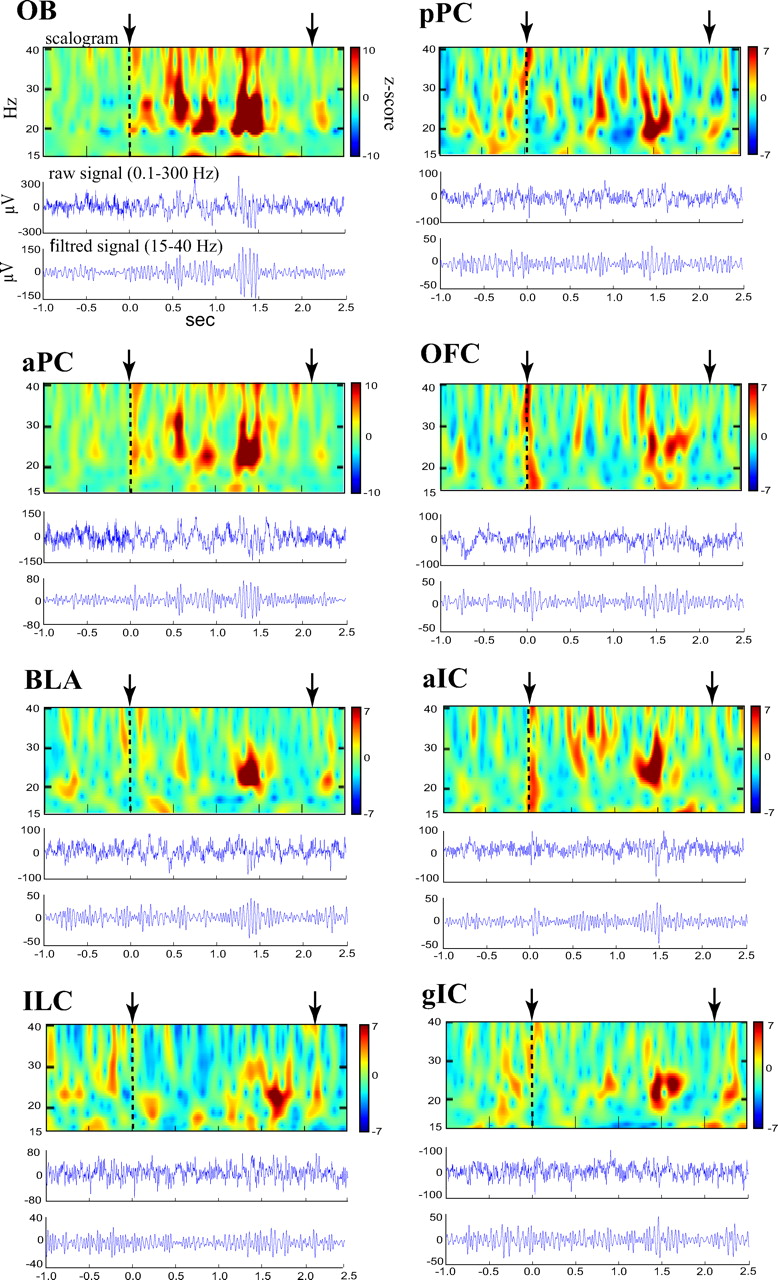
Representative local field potentials preceding and during odor sampling for the eight recording sites in parallel. The example shown represents a trial of a DP-D-a rat during test (1) for which odor sampling was followed by an absence of drink intake. For each site, we present the raw signal (middle trace), the signal filtered in the beta frequency band (bottom trace), and the corresponding time–frequency decomposition between 15 and 40 Hz (scalogram, top of each figure). To visually compare beta power values across structures, normalization by the mean power of the baseline period was applied to the scalograms. Odor onset (time 0) is indicated by the dashed line. In each recording site, the odor sampling period (time between the vertical arrows) is associated with a transient increased amplitude in beta band activity.

Modulation of beta oscillatory activity through odor aversion learning in the eight recording sites. Results concerned animals of the D-D-a (in white) and DP-D-a (in black) groups, which developed a strong odor aversion after CS–US pairing (Fig. 1 b). On each graph, the y-axis represents the average (+SEM) values of the ratio of amplitude of the beta response during odor sampling on the power relative to the preceding baseline period value. The x-axis represents the experimental session. Since no extinction of odor aversion was measured between tests 1 and 2 (Fig. 1 b), trials of the two sessions were pooled. Data of the reference session represent beta-band basal activity in the absence of olfactory stimulation. For each group, an asterisk indicates an increase in power ratio compared with the reference session (Mann–Whitney U test; p < 0.03, at least). Significant differences between conditioning and test sessions for each group are elucidated by vertical bars (Mann–Whitney U test; p < 0.01, at least). A star indicates a significant difference between the two groups for a given condition (Mann–Whitney U test; p < 0.01, at least). A triangle indicates for each group a significant increase in power between the first presentation of Iso (during conditioning) and Ger odor (Mann–Whitney U test; p < 0.05). The extinction histograms correspond to the data collected when all the animals of both groups recovered the consumption measured during the conditioning period, i.e., preceding the CS–US pairing (Fig. 1 b).

Changes in beta power are predictive of the strength of aversive behavior. Mean (+SEM) power ratio in the beta frequency band during the test sessions of the D-D and DP-D aversive groups. Here, trials were separated according to the type of drink intake (normal or decreased) (Fig. 1 c). A star indicates a significant difference between the two categories of trials for the D-D-a (in white) and DP-D-a (in black) groups (Mann–Whitney U test, p < 0.05, at least). The dashed line reports the mean level of energy during the conditioning session.

Beta oscillatory activity is not amplified in absence of odor aversion learning. Mean (+SEM) power ratio in the beta frequency band. Results presented in a concern animals of the D-D-n (in white) and DP-D-n (in black) groups, which had received a CS–US pairing but had developed no odor aversion (Fig. 1 b). Results presented in b concern control animals, which received an injection of physiological saline. An asterisk indicates a significant increase of power ratio between the reference session (in white) and the first (in gray) and the second (in black) Iso presentation (Mann–Whitney U test; p < 0.05 at least).
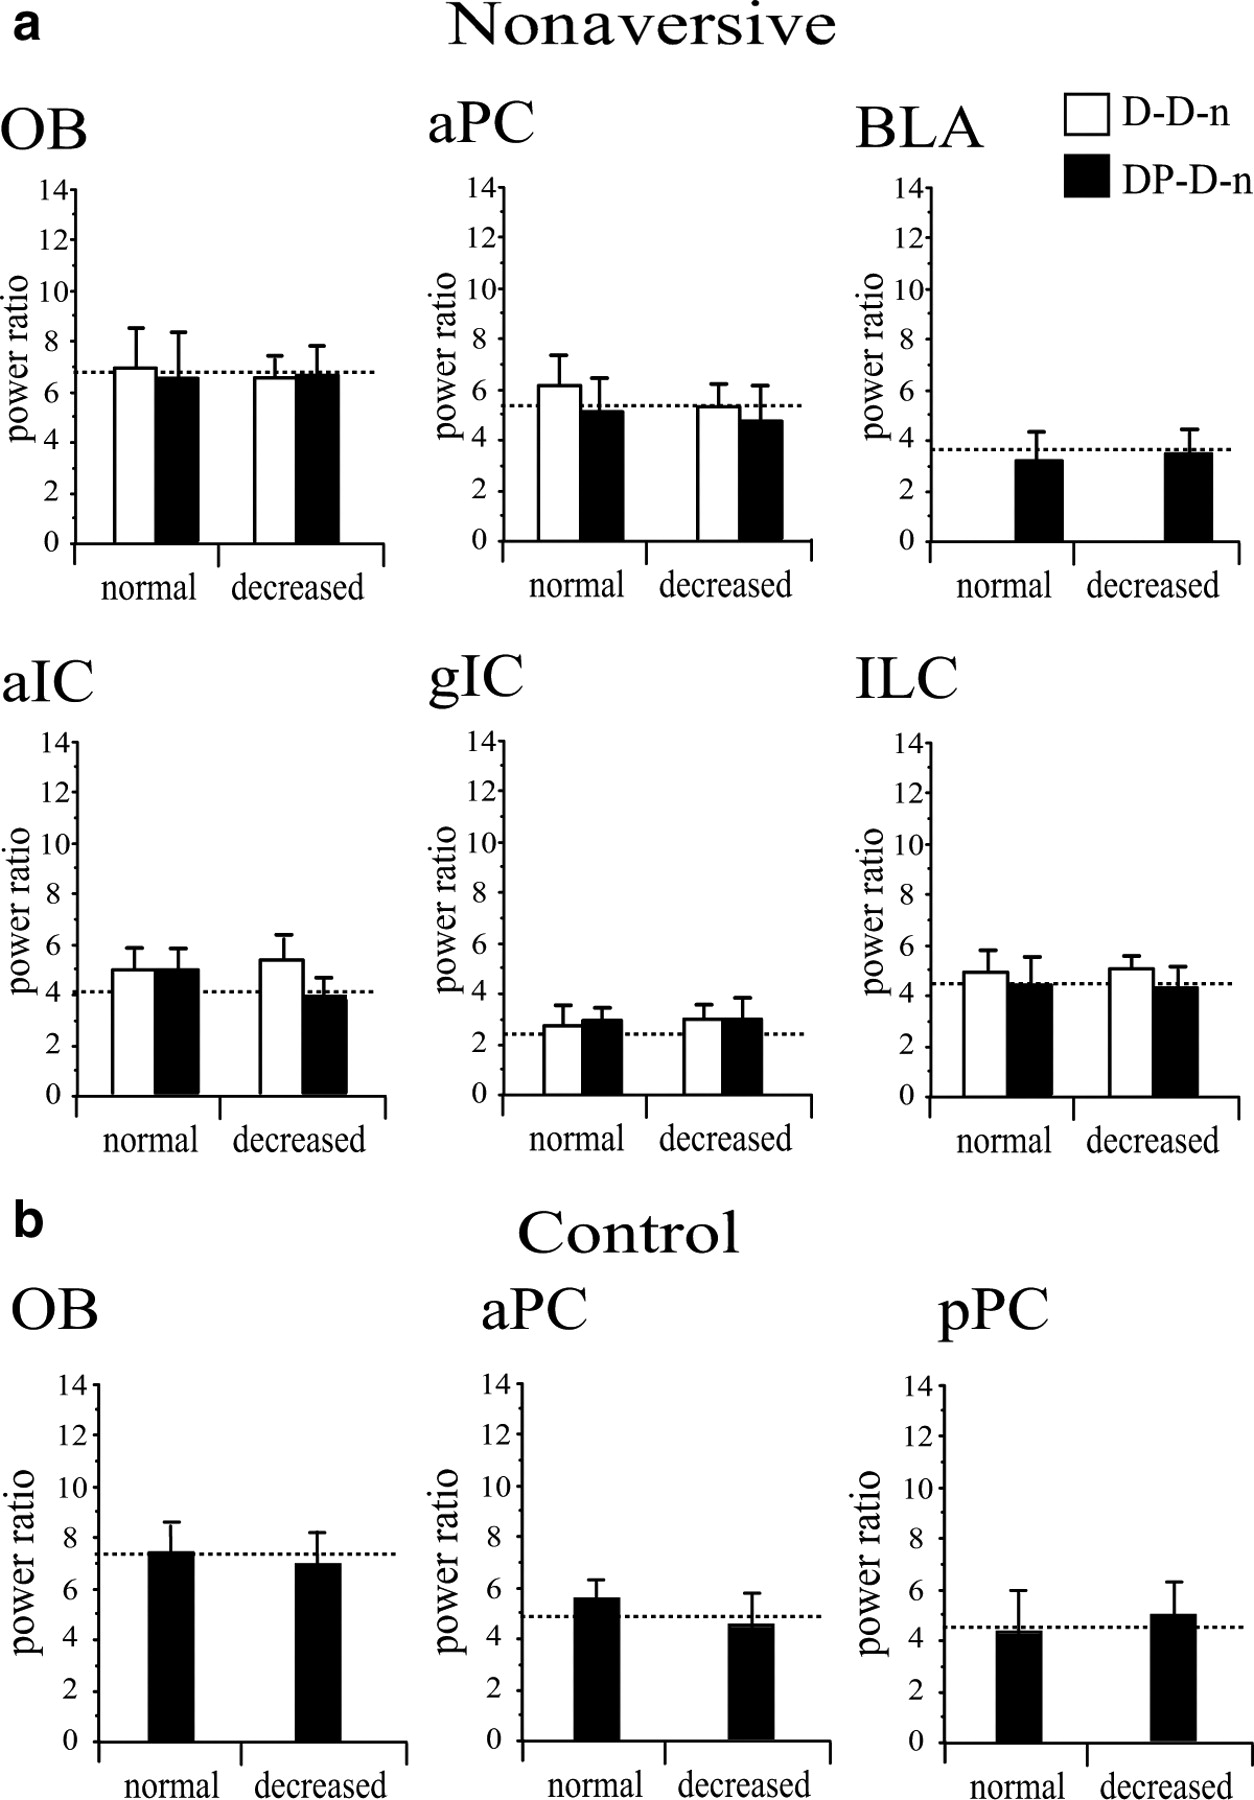
Mean (+SEM) power ratio in the beta frequency band during the test sessions of the D-D and DP-D nonaversive ( a ) and control ( b ) groups. As for the aversive groups (Fig. 5), trials were separated according to the type of drink intake (normal or decreased). The dashed line reports the mean level of energy during the conditioning session. No significant difference of beta power was found between the two types of trials for any group (Mann–Whitney U test; p > 0.05).
Oscillatory response to Iso during the first presentation
During its first presentation, the sampling of Iso induced an increase of power in the beta frequency band in all of the recording sites (compared with the basal activity of the reference session, Mann–Whitney U test, p < 0.0001 for each site), except for the granular zone of the IC (Mann–Whitney U test, p = 0.594). This was true both for the aversive (Fig. 4), nonaversive, and control groups (Fig. 6). For all of the considered sites, there was no difference of power between the D-D groups and the DP-D groups (Mann–Whitney U test, p > 0.05 for all sites).
Oscillatory response to Iso during subsequent presentations
Aversive groups.
In the absence of behavioral extinction of odor aversion between tests 1 and 2 (Fig. 1 b) (see above, Behavioral task), all trials from these two sessions were pooled. The odor-induced response observed in the conditioning session was greatly amplified in animals that expressed a strong odor aversion during the test (Fig. 4); however, this amplification was not the same for each structure and also differed according to the CS experience during conditioning. Indeed, intragroup comparisons showed a significant increase in the power ratio between the conditioning and test sessions in the OB, aPC, pPC, OFC, and BLA (Mann–Whitney U test, p < 0.01), regardless of the mode of CS presentation; however, in the ILC and both zones of the IC, significant changes in power were selective of the DP-D-a group (pILC = 0.011; pGIC = 0.009, pAIC = 0.008). No such changes were observed in the D-D-a group (Mann–Whitney U test, p > 0.05). Intergroup comparisons between D-D-a and DP-D-a groups revealed no difference in power ratio in the OB, aPC, pPC, and OFC (Mann–Whitney U test, p > 0.05) and a significant difference in the ILC, aIC, and gIC (p < 0.03).
Changes in beta power are predictive of the strength of aversive behavior. We examined the correlation between performance and beta activity power modulations across all trials for which a beta burst has been detected (n = 1069). The variable chosen to estimate performance was the number of licks. After normalization of both variables, beta power values were found negatively correlated with the number of licks. Despite not very high, this correlation was highly significant (Pearson coefficient: −0.135, p < 0.0001) and in a similar range with what we have described in a previous study using a go-no-go paradigm (Martin et al., 2004a). Moreover, when the correlation analysis was done for each cerebral site, it is only significant for the olfactory bulb and the anterior part of piriform cortex (r = −0.177, p < 0.01, n = 218; r = −0.272, p < 0.005, n = 159, respectively).
In animals classified as aversive, we nevertheless observed a normal water intake in few trials (Fig. 1 c) (see above, Behavioral task). To know whether the amplitude of the odor-induced beta activity matched with the decision of normal or reduced water intake when the spout became available, we analyzed trials classified as normal intake separately from those classified as decreased intake (Fig. 5). We observed that the strongest amplifications were associated with decreased intake trials (Mann–Whitney U test, p < 0.00001); however, this effect was modulated by the recording site and the mode of CS conditioning. There was a significant difference between the two categories of trial in the OB, aPC, BLA, and OFC for both the D-D-a and DP-D-a groups and in the aIC, gIC, and ILC for only the DP-D-a group. No significant enhancement effect was observed in the pPC for both groups.
Nonaversive and control groups
During the second and third presentations of Iso, there was an increase of power in the beta frequency band compared with the reference session (Mann–Whitney U test, p < 0.0001 for each site, except the granular zone of the IC, p = 0.594) but no change of the power ratio compared with the first Iso presentation in nonaversive rats (which received a CS–US pairing but expressed no odor aversion in test sessions) (Fig. 6 a) and in rats belonging to the control group (which received an injection of physiological saline instead of LiCl in the conditioning session) (Fig. 6 b).
To control whether changes in power were predictive of aversive behavior rather than motor planning, we further analyzed power modulation in these groups by separating, for the analysis, trials with normal drink intake from those with a decreased consumption (in the same way that it was performed for the aversive groups). Results are presented Figure 7. No significant changes in power were found in any group, whatever the trials considered.
Oscillatory response to Ger
During the geraniol session, an odor-induced activity was observed in all of the sites (significant difference with the reference sessions, p < 0.01), except for the gIC (p > 0.05). This was true both for the aversive (Fig. 4) and the nonaversive groups (Fig. 6). For the aversive groups, geraniol induced power ratios similar to those of Iso during its first presentation (i.e., during conditioning) in all of the recorded sites, except in pPC for the DP-D-a group and in the BLA for the D-D-a group, where an enhancement of power was observed for Ger (compared with the first presentation of Iso, p < 0.02) (Fig. 4). For the nonaversive group, no difference was noticed between the Iso conditioning and the geraniol sessions for the recorded sites (p > 0.05).
Oscillatory response to Iso after COA extinction
Analysis of data after complete behavioral extinction of odor aversion still revealed for both the D-D-a and DP-D-a groups the odor-induced effect of the olfactory stimulation (significant difference of power ratio compared with the Reference session) in all the sites, except for the gIC; however, the amplitude of the odor-induced activity after extinction returned to the levels measured during the first presentation of Iso (p > 0.05 for all of the sites), and remained below what was measured when animals were aversive during test sessions (p < 0.05 for the sites presenting an increase in power during tests).
Results summary
The present study examined how the perceptual properties of an odor cue evolve through aversive food learning and to what extent this effect depends on the way in which the odor was first perceived and learned. The behavioral procedure was designed to be close to natural conditions of food experience. Thus, rodents first smelled a distal odor cue, then might or not experience it as a proximal cue while consuming the solution. When the odor was presented for the first time (as it was in the case for Iso on the conditioning day), sampling it as a distal cue increased the oscillatory activity power in the beta (15–40 Hz) frequency band in the olfactory areas (olfactory bulb and piriform cortex), some frontal areas (orbitofrontal and infralimbic cortices), the basolateral amygdala, and the agranular zone of the insular cortex. During this first olfactory experience, the consumption of the odorized solution across trials did not influence the characteristics of beta oscillatory activity induced by the distal odor. This oscillatory activity was also in response to Ger odor when presented for the first time or in response to Iso odor in D-D-n, D-DP-n, and control groups. After pairing with illness, the distal odor cue was recognized and was sufficient for the animals to avoid the related toxic solution (see also Chapuis et al., 2007). In rats expressing a clear odor aversion, the distal odor cue induced much more powerful beta oscillatory activities than those during the first odor experience in the olfactory areas (BO, aPC, and pPC), the OFC, and the BLA. In these structures, the power increase was directly related to the strength of aversion, whether the odor was or was not ingested during conditioning. On the contrary, in the ILC and IC, odor-induced oscillatory responses were modified only if odor had been ingested during conditioning.
Discussion
Functional interpretation of oscillatory activity changes
The present work reports, for the first time, learning-related changes in beta oscillatory dynamics within a large cerebral network associated with COA learning. A first level of increase in beta oscillatory activity have been observed in response to odors presented for the first time and is likely to reflect coherent activity of neural populations sensitive to odor stimulation contributing to LFP. Once the COA was established, on the retrieval session, beta oscillatory power further increased selectively in some parts of the network according to the conditioning mode (distal vs distal–proximal) and the behavioral response (aversive or not). We propose that areas where beta power is increased are those where neuronal populations might have enhanced the temporal coherence of their activity which could lead to a higher level of oscillatory activity. Thus, we propose that beta oscillatory activity evoked by the CS presentation would be the signature of a network supporting odor representation as a consequence of the animal experience. This could explain why the neural assemblies revealed in D-D and DP-D group are different.
Both the correlation study and the analysis of beta activity in the different experimental groups as a function of their licking behavior suggest that strength of the beta activity observed in response to the odor was predictive (on a trial-by-trial basis) of the decrease of consumption of aversive animals once they had access to the liquid. Amplification of beta power was never observed in animals that did not develop an aversion, either because the CS–US association failed or because they received a saline injection instead of LiCl. Moreover, when the odor had lost its signal property for toxic food (after extinction), the beta response returned to preconditioning values. Finally, sampling a new odor never associated with a gastric distress, like geraniol, was not correlated with an amplification of beta activity, indicating the specificity of the beta power modification.
Changes in sampling behavior could account for the observed differences between D-D and DP-D groups. Inspection of OB activity in the theta band revealed that both D-D and DP-D groups switched from a theta/respiratory modulation ∼2–3 Hz to a more rapid sniffing mode ∼10 Hz while approaching the odor port. Thus, it is very unlikely that changes in sniffing behavior could explain the differences observed in the network according to the conditioning mode. Moreover, if it was the case, there is no reason why sniffing behavior would affect selectively odor processing in the insular and infralimbic cortices without affecting activity in the olfactory bulb or piriform cortex.
As correct odor signification recognition is associated with a decrease in water intake, it is very difficult to completely exclude the possibility that beta oscillation has something to do with motor planning. However, results from nonaversive group (D-D-n, DP-D-n, and control) (Fig. 7) showed that beta oscillatory activity was never observed in these groups, whatever the animal's motor response. As a consequence, we propose that the increased beta oscillatory activity observed in the network is the signature of a correct odor processing in aversive animals which will allow them to produce an adaptative behavioral response.
Orthonasal odor experience during odor–malaise association was associated during COA retrieval with the activation of an OB–PC–BLA–OFC network. Interestingly, when this distal odor experience was accompanied by the ingestion of the odor during COA acquisition, this network of activated structures was extended to ILC and IC during retrieval. Although the neuronal substrate sustaining COA is probably not restrained to the areas recorded here, the interpretation of these changes within each structure will be discussed in light of the literature on aversive learning.
An effective CS–US association during COA is supported by a basic network, including olfactory areas, the basolateral amygdala, and the orbitofrontal cortex
An increasing amount of findings show that the first stages of olfactory processing, the olfactory bulb and the piriform cortex, take part into the circuit of olfactory memory (Haberly and Bower, 1989; Calu et al., 2007; Sevelinges et al., 2007, 2008). According to the alimentary status of animals, mitral cells of OB present increased activity in response to an odor associated to toxicosis (Pager and Royet, 1976). Fos immunoreactivity in PC increased during the retrieval of taste potentiated odor aversion (TPOA) (Dardou et al., 2006, 2007). Our data show that COA learning clearly modified odor-induced oscillatory activity in these structures.
The amygdala, and especially its basolateral nucleus, plays a prominent role in the processes of acquisition, consolidation, and retrieval of the COA (Bermúdez-Rattoni et al., 1986; Ferry and Di Scala, 1997; Miranda et al., 2003; Desgranges et al., 2008; Sevelinges et al., 2009). This study to our knowledge is the first report that COA training strongly changes BLA response to odors. As this structure was identified to integrate the affective salience of chemosensory stimuli (Nishijo et al., 1998; Winston et al., 2005), we hypothesize that it participates in the representation of a general aversive connotation of the odor cue.
The OFC is known to integrate the inputs of various food-related sensory stimulations and has been suggested to play an important role in flavor perception in humans, primates, and rodents (Rolls and Baylis, 1994; Schul et al., 1996; Small et al., 2007). Dardou et al. (2007) have shown that both olfactory and taste cues activate this structure during TPOA retrieval. Several studies have shown the existence of both anatomical and functional connectivity between the PC, the BLA, and the OFC (Shi and Cassell, 1998; Schoenbaum et al., 1999; Majak et al., 2004; Illig, 2005; Cohen et al., 2008). Thus, this network could be a good candidate for the integration of both sensory and affective signals about food odor cues.
A network extended to insular and infralimbic cortices after the distal–proximal experience of the odor
The prefrontal cortex, and especially the ILC, receives direct olfactory projections from the piriform cortex (Datiche and Cattarelli, 1996). The blockade of the prefrontal cortex was reported to disturb olfactory associative learning (Tronel et al., 2003, 2004; Boix-Trelis et al., 2007; Carballo-Márquez et al., 2007) and the acquisition and extinction of gustatory aversion (Hernádi et al., 2000; Mickley et al., 2005; Akirav et al., 2006). It is also activated during TPOA retrieval (Dardou et al., 2007). Its role in COA appears more complex, since amplification of beta oscillatory activity after learning in ILC is observed only when the odor has been ingested during the conditioning phase.
The primary gustatory cortex is identified as the area overlapping the granular and the disgranular zones of the insula (Ogawa et al., 1990). The more ventral agranular zone of this cortical area is a particular target of projections for primary olfactory areas (Shipley and Geinisman, 1984; Krushel and Van Der Kooy, 1988; Sewards and Sewards, 2001). The absence of increase in oscillatory activity in the granular zone contrary to the agranular zone in response to the first odor presentation confirms the functional heterogeneity of this cortex; however, a major finding is that IC (both aIC and gIC) presented a selective increase of beta oscillatory activity in response to the distal cue when the odor was ingested before intoxication. Although IC is strongly involved in gustatory food aversions (Bermúdez-Rattoni, 2004), its lesion or inactivation has been reported without effect on COA (Kiefer et al., 1982; Roman et al., 2006; Desgranges et al., 2009) and has led to ambiguous results on TPOA (Kiefer et al., 1982; Lasiter et al., 1985; Inui et al., 2006). Methodological differences used in these and our studies could account for the observed differences. Lesion studies presented either a distal odor alone or an ingested odor but never proposed a combination of the two situations (i.e., exposure to distal odor alone and then access to an odorized solution). Food behavior combines two perceptive phases: the distal exploration of the food and the consumption in itself. Through experience and associative processes, the distal properties of the food could acquire a predictive value of sensations perceived during the ingestion. In our study, presentation of the conditioned distal odor cue during the retrieval session could thus reactivate memories of previous distal–proximal odor cues associations, which would involve both infralimbic and insular cortices. Whether activity in these cortices is critical for COA acquisition and retrieval remains to be addressed experimentally in our experimental conditions.
Conclusion
Oscillatory activities have been suggested to support transient information exchanges between different cerebral areas through long-range synchronization and desynchronization processes (Varela et al., 2001; Gruber et al., 2004; Martin et al., 2007; Melloni et al., 2007; Sehatpour et al., 2008). Studying beta oscillatory activities, we described two differential subnetworks involved in COA according to primary odor experience. The present study strongly suggests that structures in the network communicate during olfactory processing as suggested by other studies (Ferreira et al., 2005; Grossman et al., 2008). In the future, we would address the hypothesis of temporal interactions in the beta range within these networks and evaluate how critical they could be used for aversive olfactory learning.
Footnotes
-
This work was supported by Centre National de la Recherche Scientifique, by the Ministère de l'Education Nationale, de la Recherche et de la Technologie, and by Aromalim Grant Agence National de la Recherche 05-PNRA-002. We also warmly thank Claire Dawson for the review of the English.
- Correspondence should be addressed to Julie Chapuis, CNRS UMR 5020 Neurosciences Sensorielles Comportement Cognition, Université Lyon 1, 50, avenue Tony Garnier, F-69366 Lyon cedex 07, France. jchapuis{at}olfac.univ-lyon1.fr


