

Article Figures & Data
Figures
- Figure 1.
Spike RF structures of presumptive excitatory neurons in the V1 of wild-type mice. A, An example S-RF cell. B, An O-RF cell. C, An On-dominating cell. Left, An example spike waveform. The dotted line marks the position of the peak. Calibration: horizontal, 1 ms; vertical, 88 pA (A), 48 pA (B), 25 pA (C). Middle left, On and Off responses to all the stimuli. The trace in each pixel represents the PSTH for spike responses (generated from all the trials) to a unit On or Off stimulus at the corresponding location. Each pixel represents visual space of 4° (A), 5° (B), and 4° (C). Red and blue ovals depict the two-dimensional Gaussian fit of the On and Off subfield, respectively. Calibration: horizontal, 200 ms; vertical, 14 Hz (A), 22 Hz (B), 23 Hz (C). Middle right, Superimposed color maps for spike On (red) and Off (green) responses. The brightness of the colors represents the evoked firing rate. The maps were smoothed by bilinear interpolation. The one-dimensional map below the square color map in C represents superimposed On and Off responses to flashing bars of the preferred orientation (indicated by the white bar) at various locations. The brightest color represents 13.7 Hz. Note that there was no Off response. Right, PSTH of spike responses evoked by the drifting sinusoidal grating at optimal spatial frequency within one cycle. The modulation ratio is 1.2 (A), 0.33 (B), or 1.67 (C). D, Gaussian fits of On (red) and Off (blue) subfields for the population of excitatory neurons, grouped according to their laminar locations and RF types. Scale bar, 10°. L2/3, Layer 2/3; L4, layer 4. E, Histogram of strength ratio between the maximum On and maximum Off response within the identified RF. The ratio was derived by dividing the smaller value by the larger value. Most On- or Off-dominating cells had no response to one sign of contrast.
- Figure 2.
Relationship between OI, correlation coefficient, and modulation ratio of excitatory neurons. A, Plot of correlation coefficient (r) against OI. Each data point represents values obtained in the same cell. The red line is the best-fit linear regression line. Dashed lines mark OI 0.3 and r = 0, respectively. Note that these two measures give similar grouping results. B, Histogram of OI for the population of excitatory neurons exhibiting both On and Off subfields. The dashed line marks OI 0.3. C, Plot of modulation ratio (F1/F0) against OI. The red line is the best-fit linear regression line. r = −0.69. The dashed line marks OI 0.3 and F1/F0 = 1 (which separates simple from complex cells), respectively. Note that cells in space b will be grouped differently according to different measures. D, Plot of modulation ratio against correlation coefficient. r = −0.60.
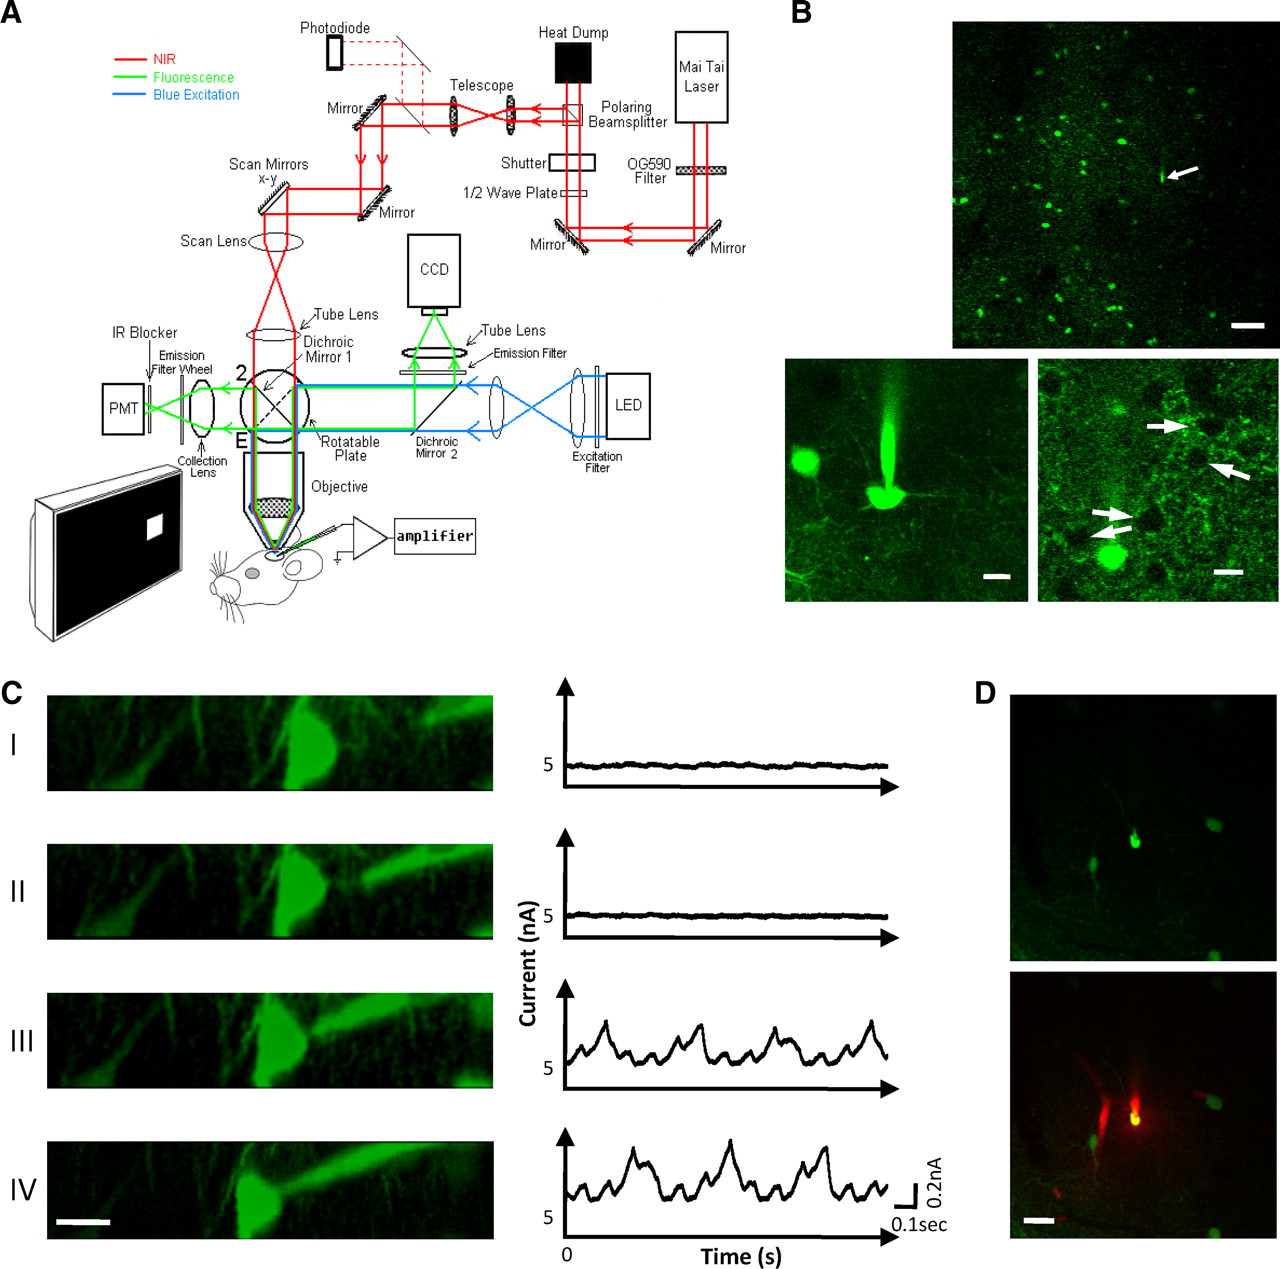
- Figure 3.
Two-photon imaging guided cell-attached recording. A, Schematic diagram for our customized two-photon imaging system. Red beams indicate the optic pathway of the two-photon laser. The power of the laser beam is controlled by a ½ waveplate coupled with a polarized beam splitter. A PMT coupled with an emission filter wheel allows detection of six different types of fluorescence emission. An epifluorescence imaging system with a CCD camera was incorporated for directly viewing GFP fluorescence (green beam). Excitation (blue beam) was provided by a blue light-emitting diode lamp. Dichroic mirror 1 was designed to switch between two-photon mode (2) and epifluorescence mode (E). B, Top, Two-photon image of V1 in a GAD67-GFP mouse at a depth of ∼150 μm below the pial surface. The arrow points to the tip of the recording pipette, which was filled with ACSF containing calcein. Scale bar, 50 μm. Bottom left, A loose patch was formed on a GFP-positive cell body. The primary dendrites of the target cell could be identified, and the surface of the soma was depressed by the pipette tip. Scale bar, 10 μm. Bottom right, leakage of calcein over time increased fluorescence of the extracellular space, and GFP-negative cell bodies appeared as dark shadows (arrows) that could be targeted as presumptive excitatory neurons. Scale bar, 10 μm. C, Progression of a targeted patch. Left, Images (y-projection) showing progressive movement of the pipette tip toward the target cell. Scale bar, 10 μm. Right, Traces of leak current under −40 mV for the corresponding time point. Note that the proximity of the pipette tip to the cell membrane coincided with the appearance of large oscillatory current changes (III). Additional pressing of the cell by the pipette tip reduced the leak current. D, Example experiment of a targeted whole-cell patch, with the pipette loaded with a red dye (rhodamine B). Top, Image in green channel. Bottom, Superimposed image in both green and red channels. Note that the target cell was stained by the red dye and appeared yellow. The red signal to its left was caused by a blood vessel. Scale bar, 20 μm.
- Figure 4.
TPTP identified three neuronal types. A, Left, Example traces of recorded spikes from a GFP(+) FS neuron (top) and a GFP(+) RS neuron (bottom), evoked by a bright square displayed for 200 ms (top trace). Right, Spike shape for four example FS neurons (top) and RS neurons (bottom). For each cell, 50 individual spikes (black) and their average (red) were superimposed. Dotted lines mark the trough and the peak, the amplitudes of which are represented by P1 and P0, respectively. The peak–peak interval was measured between the two dashed lines. Note that fast spikes are characterized by a relatively larger P0 and relatively shorter peak–peak interval. Calibration: horizontal, 1 ms; vertical, 30, 24, 80, and 50 pA (top) and 60, 36, 50, and 70 pA (bottom). B, An example experiment showing that spike shape remained relatively stable as seal resistance changed. Spike shapes were shown for different time points during the recording. Calibration: horizontal, 1 ms; vertical, 36, 60, and 80 pA (from top to bottom). C, Scatter plot of P0/P1 ratio versus peak–peak (P-P) interval for the identified inhibitory and excitatory neurons. The dotted line indicates the boundary between FS and RS cells. GFP(+) and GFP(−) neurons were marked in green and black, respectively. D, Average firing rate (spontaneous and evoked) for the three groups of neurons. For evoked response, the strongest response in RF mapping was used. Error bars indicate SE. *p < 0.05, Tamhane T2 multiple comparison test. n = 21, 20, and 20 for GFP(+) FS, GFP(+) RS, and GFP(−) RS neurons, respectively.
- Figure 5.
Spike RF structures of identified excitatory and inhibitory neurons in layer 2/3. A, B, Spike RFs of an example GFP(+) inhibitory neuron (A) and a GFP(−) excitatory neuron (B). Plotting is similar to that in Figure 1A. Left, Traces of example spike waveforms. Calibration: horizontal, 1 ms; vertical, 100 pA (A) and 60 pA (B). Middle, PSTH for On and Off responses to all the stimuli. Red and blue ovals depict the Gaussian fits of the On and Off subfields, respectively. Each pixel represents 5° in visual space. Calibration: horizontal, 200 ms; vertical, 36 Hz (A) and 16 Hz (B). Right, Superimposed color maps for On (red) and Off (green) responses. C, Outlines of Gaussian fits of spike On and Off subfields for the three types of neurons. Red and blue ovals represent On and Off subfields, respectively. RFs were binned according to their OI values. Bin size, 0.2. Scale bar, 10°. D, Distribution of OI (triangle) and correlation coefficient (circle) for different groups of neurons. n = 18, 17, and 17 for GFP(+) FS, GFP(+) RS, and GFP(−) RS neurons, respectively. *p < 0.001, Tamhane T2 multiple comparison test. E, Distribution of subfield size. For S-RF and O-RF cells, subfield size was the average of On and Off subregions. n = 21, 20, and 20 for GFP(+) FS, GFP(+) RS, and GFP(−) RS neurons, respectively. *p < 0.001. F, Distribution of modulation ratio. n = 25 and 24 for GFP(+) and GFP(−) neurons, respectively. *p < 0.001, t test. Solid symbols indicate mean value, and error bars indicate SD.
- Figure 6.
Orientation tuning of identified inhibitory and excitatory neurons in layer 2/3. A, Spike responses to moving gratings of 12 directions in an example GFP(−) RS excitatory neuron (Ex.) and a GFP(+) FS inhibitory neuron (In.). Blue traces are recorded spike responses (in one trial) under each drifting grating. The corresponding PSTH for each orientation (5 repeats) is plotted below. B, Polar plots of visual responses for six cells. Numbers in parentheses represent the axial scale, the average number of spikes evoked after baseline subtraction. The first two inhibitory neurons (In.) were FS neurons, and the third was a RS neuron. C, Distribution of OSI for the three groups of neurons. n = 22, 15, and 33 for GFP(+) FS, GFP(+) RS, and GFP(−) RS neurons, respectively. *p < 0.001, Tamhane T2 multiple comparison test. D, Distribution of tuning width. *p < 0.05. E, Distribution of global OSI. *p < 0.001. F, Plot of OSI versus OI. Excitatory neurons include GFP(−) neurons in TPTP experiments and those recorded blindly in wild-type mice. Solid symbols indicate mean value, and error bars indicate SD.
- Figure 7.
Comparison of RF properties of excitatory neurons between the transgenic and wild-type mice. A, Distribution of OI. n = 17 and 25 (from left to right). p = 0.61, t test. B, Distribution of subfield size. n = 20 and 37. p = 0.87. C, Distribution of global OSI. n = 33 and 33. p = 0.65.


Additional Files
Supplemental Data
Files in this Data Supplement:
- supplemental material - Supplemental Figures


