

Article Figures & Data
Figures
- Figure 1.
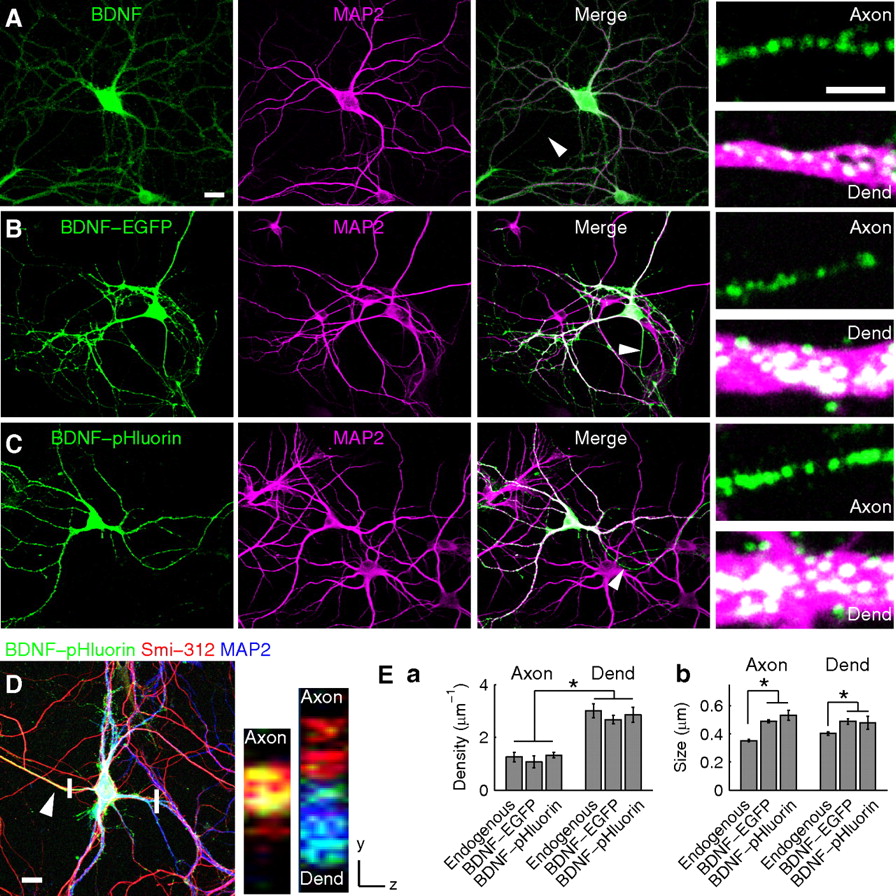
Expression and localization of endogenous BDNF and BDNF–EGFP/pHluorin in cultured hippocampal neurons. A, Coimmunostaining of endogenous BDNF (green) and MAP2 (magenta) in cultured hippocampal neurons. Arrowhead, Axon. Small panels, Higher-magnification images of an axon and a dendrite (Dend). Scale bars: left, 20 μm; small panels, 2 μm. B, C, Neurons expressing either BDNF–EGFP (B) or BDNF–pHluorin (C) were immunostained for EGFP (green) and MAP2 (magenta). Arrowheads, Axons. Small panels, Higher magnification of axons and dendrites. Scale bars are the same as in A. D, A neuron triple immunostained with antibodies to EGFP (green), axon (arrowhead)-specific Smi-312 (red), and MAP2 (blue). Small panels, Reconstructed images along the axial plane (at regions marked by white bars) of a single BDNF–pHluorin-expressing axon (left) and of an axon not expressing BDNF–pHluorin (right) together with a BDNF–pHluorin-expressing dendrite (right). Scale bar, 20 μm. E, Bar graphs showing the density (Ea) and size (Eb) of BDNF-containing fluorescence puncta. *p < 0.01, significant difference between axon and dendrite by two-way ANOVA and t test.
- Figure 2.
Activity-induced fusion of BDNF-containing vesicles in axon and dendrite. A, B, a, Wide-field fluorescence microscopic images of BDNF puncta at the axon (A) and dendrite (B) of cultured hippocampal neurons expressing BDNF–pHluorin. Insets, Magnified views of BDNF–pHluorin puncta in boxed areas at 1 s before and 1 and 200 s after field stimulation (at 10 Hz for 300 pulses). Scale bar, 20 μm. b, Sample traces depict the fluorescence change (ΔF) with time at individual puncta at the axon (A) and dendrite (B). Numbers refer to the corresponding numbered puncta shown in the images above. c, Fluorescence changes normalized by the basal fluorescence (F0) and the average below traces represent the mean ± SEM pHluorin fluorescence change at the axon (A; n = 594 puncta, 16 cells) and dendrite (B; n = 300 puncta, 7 cells). No Stim, No field stimulation applied, showing insignificant bleaching over the 4 min recording period. C, D, TIRF microscopic images and pHluorin fluorescence changes at axon and dendrite. a, Images of BDNF–pHluorin puncta at 1 s before and 1 and 40 s after field stimulation. b, c, Same as in A and B, except that the fluorescence changes (ΔF) were monitored with TIRF microscopy.
- Figure 3.
NH4Cl and acid perfusion of neurons expressing BDNF–EGFP/pHluorin. A, Representative images of the axon and dendrite (Dend) of neurons expressing either BDNF–EGFP or BDNF–pHluorin, after the perfusion of various solutions. Scale bar, 10 μm. B, Time course of the fluorescence changes of BDNF–EGFP or BDNF–pHluorin, averaged over 50 puncta in single neurons, induced by the perfusion with NH4Cl (pH 7.4) or MES-buffered acidic solution (pH 5.2). C, a, Schematic diagram depicting the measured quantities (ΔFNH4Cl and ΔFMES) in perfusion-induced changes in the pHluorin fluorescence. Because pHluorin is completely quenched at pH 5.2 (Sankaranarayanan et al., 2000), ΔFNH4Cl represents the total amount of BDNF–pHluorin in the vesicular compartment that was unquenched by perfusion with NH4Cl. ΔFMES represents the quenched surface fraction (fsur) of BDNF–pHluorin by perfusion with MES-buffered acidic solution (pH 5.2). The surface fraction thus can be calculated as fsur = ΔFMES/(ΔFNH4Cl + ΔFMES). b, Bar graph showing the calculated fraction (mean ± SEM) for BDNF–EGFP and BDNF–pHluorin on the cell surface, from measurements of ΔFNH4Cl and ΔFMES.
- Figure 4.
Partial versus full fusion of BDNF–pHluorin vesicles at axon and dendrite. A, C, Wide-field fluorescence images of an axon expressing BDNF–pHluorin and fluorescent debris from a broken cell nearby (dashed circle, A) or in the same field of view (box, C). Trace below, BDNF–pHluorin puncta fluorescence changes with time (normalized by the basal fluorescence) at a single axon (black) and at a piece of cell debris (blue), before and after field stimulation (10 Hz, 300 pulses) or in response to extracellular perfusion with an MES-buffered acidic solution (pH 5.2; open bars). Numbers refers to the time the images above were collected. B, D, The average trace of the changes in pHluorin fluorescence after field stimulation at time marked as “10 Hz”, showing the sensitivity of the fluorescence decay at the axon (B) or of the tail of fluorescence reduction at the dendrite when the cultures were treated with bafilomycin-A1 (Baf), dynasore (Dyn), and K252a. Dynasore and K252a applied 20 min before and bafilomycin applied immediately before stimulation. Error bars indicate SEM.
- Figure 5.
TIRF video recording of the fusion of single BDNF–pHluorin vesicles. A, C, Sample traces of BDNF–pHluorin fluorescence changes (ΔF) measured at the center of each vesicle at the axon (A) and dendrite (C) of control neurons, neurons perfused with TrkB-Fc-containing solution (4 ng/ml), or neurons pretreated with dynasore (Dyn; 80 mm) or TeNT (10 nm). Each line represents a single vesicle. Bar indicates field stimulation at 10 Hz for 300 pulses. B, D, Average traces of BDNF–pHluorin fluorescence transients at axon (B) and dendrite (D) as those shown in A and C, normalized by the basal fluorescence of each puncta (F0) and with the onset time of the transients aligned. E, F, Representative images of single vesicles at the axon (E) and dendrite (F) under 10 Hz (300 pulses) stimulation. a1, Consecutive images of a fusion event at the axon taken at 4 s interval. Scale bar, 2 μm. a2, Pseudo-line scan images for 12 s along the center of the spot for the vesicle shown in a1. b, c, Two other examples of vesicles undergoing fusion events. Repeated opening of the fusion pore was found for the vesicle shown in c. Arrowhead, Opening of fusion pore.
- Figure 6.
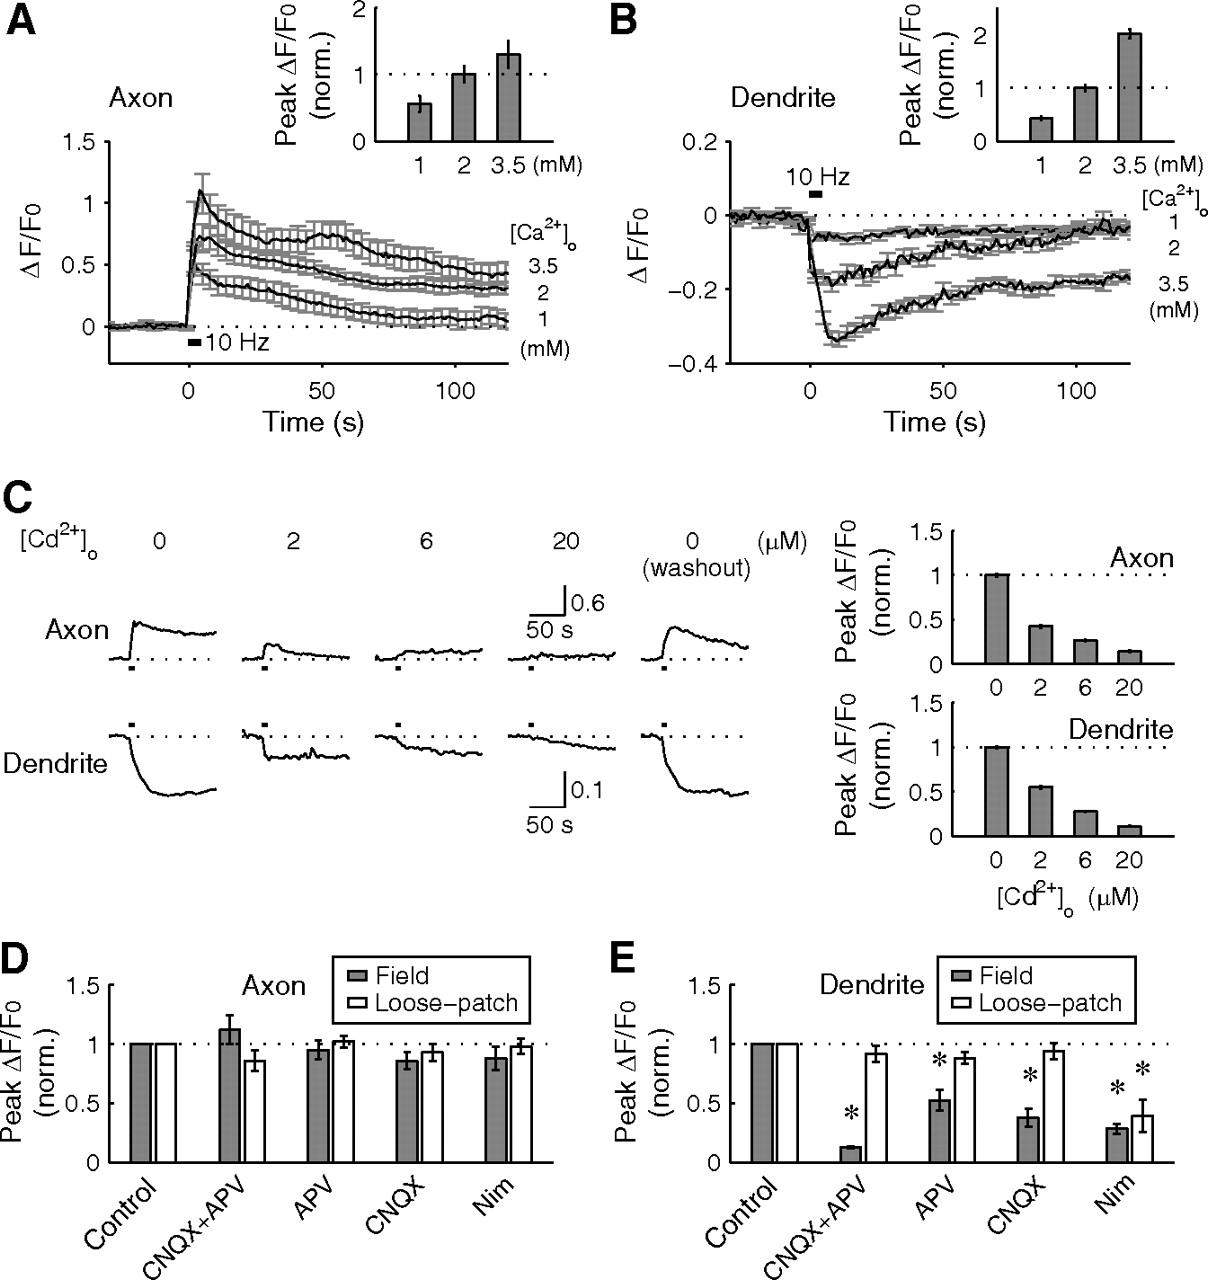
Calcium dependence in activity-induced fusion of BDNF–pHluorin vesicles. A, B, Average changes of BDNF–pHluorin puncta fluorescence changes induced by field stimulation (40 pulses, 10 Hz) at different [Ca2+]o at axons (±SEM; n = 215 puncta in 9 axons) and dendrites (n = 231 puncta in 8 dendrites). Insets, Average peak fluorescence change, normalized to that observed at 2 mm [Ca2+]o. C, Average changes of BDNF–pHluorin puncta fluorescence recorded from a single axon and dendrite, in the presence of various concentrations of Cd2+ in the culture medium. Bar graphs, Average peak fluorescence change, normalized to that at 0 mm [Cd2+]o. D, E, Average changes of peak BDNF–pHluorin puncta fluorescence at axons and dendrites induced by either field stimulation of the culture or loose-patch stimulation of individual soma, in the presence of various blockers of glutamate receptors and L-type Ca2+ channels, and normalized by those observed in the absence of drug treatment (n = 3–7 neurons for each group). Nim, Nimodipine.
- Figure 7.
Activity pattern-dependent partial and full fusion of BDNF–containing vesicles. A, B, Average changes of BDNF–pHluorin puncta fluorescence evoked by various conditions of stimulation at axon (A) and dendrite (B). C, Peak amplitude of BDNF–pHluorin fluorescence changes plotted against the frequency of tonic field stimulation and after TBS (1 min). +APV, TBS applied in the presence of APV (50 μm). D, The fraction of BDNF–pHluorin puncta exhibiting partial fusion, full fusion, and no fusion at axon and dendrite, under different stimulation conditions. Error bars indicate SEM. E, Average changes of BDNF–pHluorin puncta fluorescence at the axon, in response to tonic stimulation at 50 Hz (a) and TBS (b) for three different durations (n = 3–5 neurons each).
- Figure 8.
Endogenous BDNF exhibits similar activity-induced secretion as BDNF–pHluorin. A, B, Sample traces of fluorescence changes at individual BDNF–pHluorin puncta induced by 1 or 3 min TBS at axon (A) and dendrite (B), before immunostaining for endogenous BDNF. C, Neurons in the same culture as those in A and B were immunostained for endogenous BDNF immediately after 1 or 3 min TBS. Open arrowheads, Puncta of immunostained endogenous BDNF. Filled arrowheads, Green fluorescent beads added to the culture after immunostaining for normalization. Scale bar, 2 μm. D, E, Bar graphs showing the density of endogenous immunostained BDNF puncta (D) and the intensity of endogenous BDNF puncta fluorescence, normalized by that of the microspheres (E), with or without exposure to 1 or 3 min TBS, for axons (n = 5 neurons) and dendrites (n = 5 neurons). Error bars indicate SEM.


Additional Files
Supplemental Data
Files in this Data Supplement:
- supplemental material - Supplemental Material
- supplemental material - Supplemental Movie 1
- supplemental material - Supplemental Movie 2


