

Article Figures & Data
Figures
- Figure 1.
Schematic illustration of the region of the brain where neurons were recorded in hypocretin knock-out mice. A provides an overall view of the location of the region of interest (Franklin and Paxinos, 1997). B is a photomicrograph of a Nissl- stained tissue section (neutral red) from a representative hypocretin knock-out mice with the microwire tip marked by Perl's Prussian blue staining (arrow). C and D schematically depict the location of recorded neurons. The four REM sleep active neurons bordered the LDT. AQ, Aqueduct; DR, dorsal raphe; LDT, laterodorsal tegmentum; vlPAG, ventrolateral periaqueductal gray. Scale bar: B, 100 μm.
- Figure 2.
Discharge patterns [firing rate (spikes/s)] of 44 neurons recorded from the pons during wake, non-REM, REM sleep, and cataplexy (CAT). The figures in the left panel summarize the activity of all 44 recorded neurons while the bar graphs summarize the mean (±SEM) discharge rate during the four behavioral states. *p < 0.01 versus non-REM sleep; #p < 0.01 versus wake; $p < 0.03 versus REM sleep.
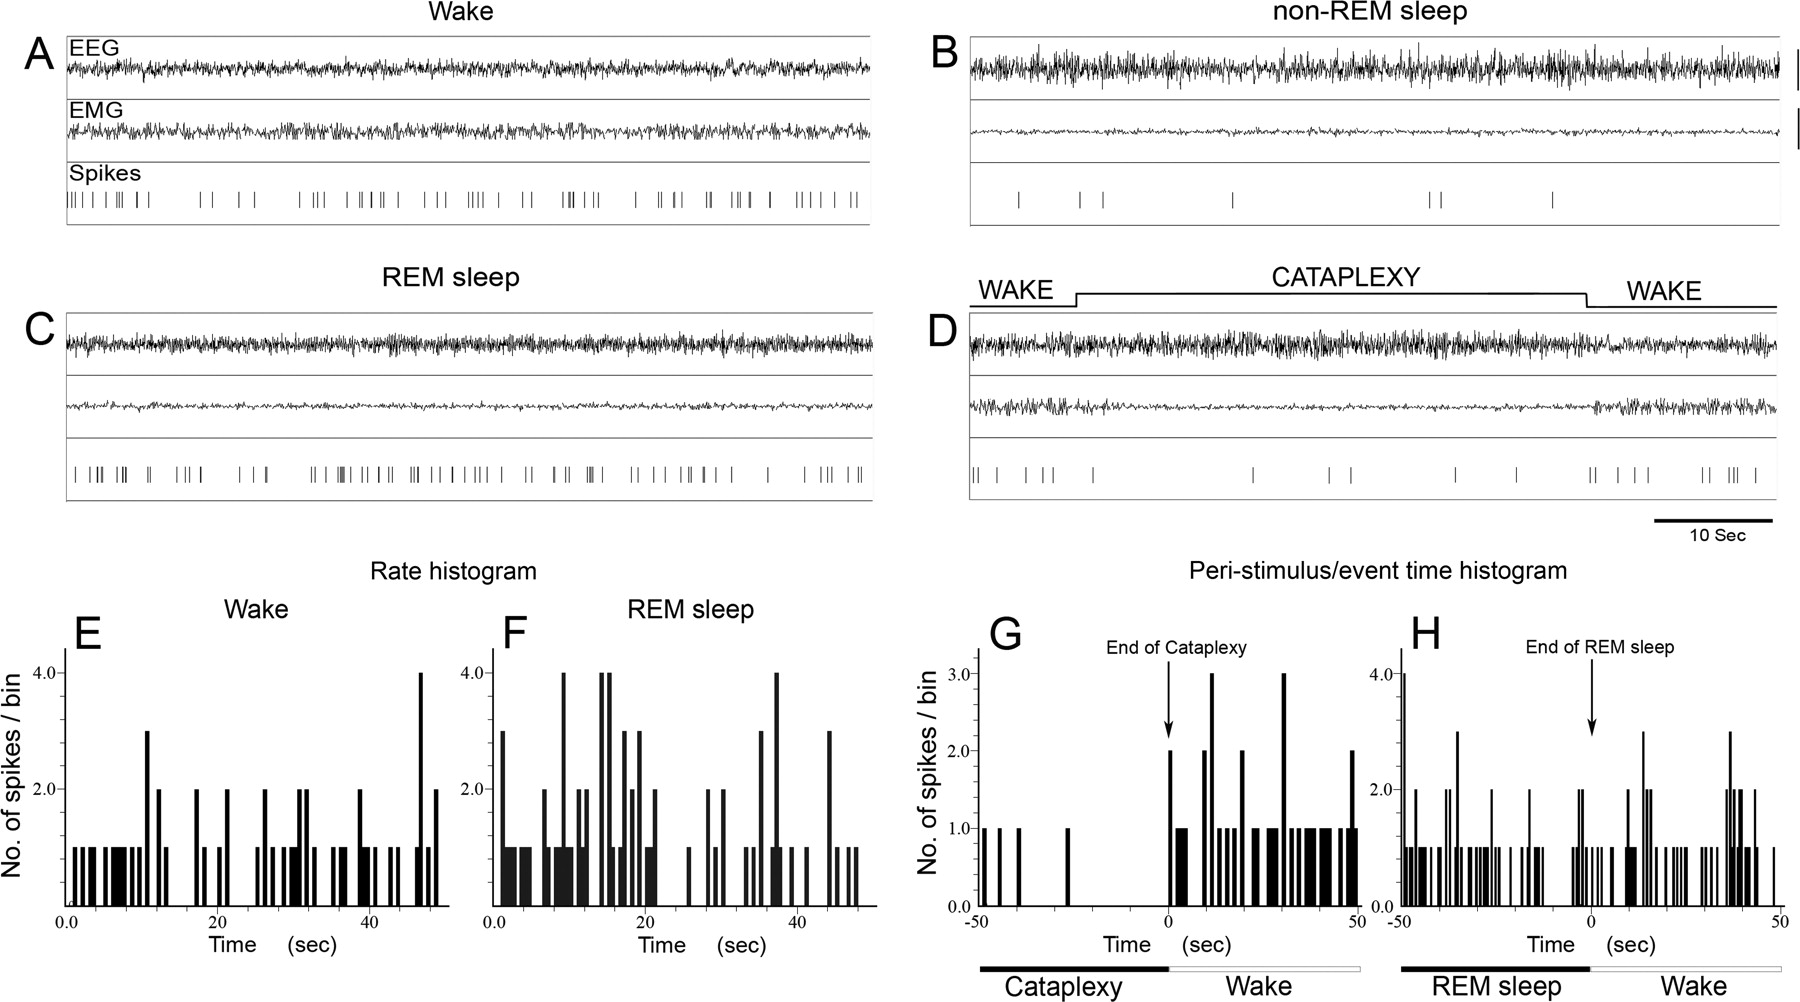
- Figure 3.
Activity of a representative single wake/REM sleep active neuron across various sleep–wake behaviors. A–D, The activity of the same neuron is depicted during wake (A), non-REM sleep (B), REM sleep (C), and cataplexy (D). E, F, Rate histograms summarizes the discharge rate (number of spikes/bin; bin width = 500 ms) during wake (E) and REM sleep (F) and demonstrates that this neuron was active during both wake and REM sleep. G, H, Peristimulus/event time histogram summarizes the change in discharge rate (spikes/bin; bin width = 500 ms) of this neuron during transition from cataplexy to wake (G) and from REM sleep to waking (H). As can be seen in G and H, this neuron increased firing from cataplexy (no muscle tone) to waking, but its activity did not change from REM sleep (no muscle tone) to wake. Calibration: 100 μV.
- Figure 4.
Activity of a representative REM sleep active neuron across sleep–wake behaviors. A–D, The activity of the same neuron is depicted during wake (A), non-REM sleep (B), REM sleep (C) and cataplexy (D). E, F, Rate histograms summarizes the discharge rate (number of spikes/bin; bin width = 100 ms) during wake (E) and REM sleep (F) and demonstrates that this neuron was more active during REM sleep compared with wake. G, H, Peristimulus/event time histogram summarizes the change in discharge rate (spikes/bin; bin width = 100 ms) of this neuron during transition from cataplexy to wake (G) and from REM sleep to waking (H). As can be seen in G and H, this neuron's activity did not change from cataplexy (no muscle tone) to waking, but it decreased firing from REM sleep (no muscle tone) to wake. Calibration: 100 μV.


