

Abstract
The human cerebellum contains approximately half of all the neurons within the cerebrum, yet most experimental work in human neuroscience over the last century has focused exclusively on the structure and functions of the forebrain. The cerebellum has an undisputed role in a range of motor functions (Thach et al., 1992), but its potential contributions to sensory and cognitive processes are widely debated (Stoodley and Schmahmann, 2009). Here we used functional magnetic resonance imaging to test the hypothesis that the human cerebellum is involved in the acquisition of auditory and visual sensory data. We monitored neural activity within the cerebellum while participants engaged in a task that required them to discriminate the direction of a visual or auditory motion signal in noise. We identified a distinct set of cerebellar regions that were differentially activated for visual stimuli (vermal lobule VI and right-hemispheric lobule X) and auditory stimuli (right-hemispheric lobules VIIIA and VIIIB and hemispheric lobule VI bilaterally). In addition, we identified a region in left crus I in which activity correlated significantly with increases in the perceptual demands of the task (i.e., with decreasing signal strength), for both auditory and visual stimuli. Our results support suggestions of a role for the cerebellum in the processing of auditory and visual motion and suggest that parts of cerebellar cortex are concerned with tracking movements of objects around the animal, rather than with controlling movements of the animal itself (Paulin, 1993).
Introduction
The cerebellum has an important and well known role in the control and coordination of movements (Thach et al., 1992). In recent years, a number of researchers have also pointed to a growing body of evidence for a role of the cerebellum in such functions as cognitive control, attention, emotional processing, language, working memory, and spatial tasks (Stoodley and Schmahmann, 2009). In contrast, considerably less attention has been devoted to investigating the role of the cerebellum in sensory processing. One reason for this is that the cerebral projections of the cerebellum have long been thought to be restricted to the motor cortex. It is now known that multiple areas of the cerebral cortex maintain both feedforward connections with the cerebellum via the pons and feedback connections via the thalamus. These complex connections imply a cerebellar role for a wide range of cognitive and sensory tasks (Schmahmann, 2001).
Despite human neuropsychological (Ivry and Diener, 1991; Thier et al., 1999; Jokisch et al., 2005; Maschke et al., 2006; Parsons et al., 2009) and animal physiological evidence for a role of the cerebellum in sensory processing (Paulin, 1993; Xi et al., 1994), no previous brain imaging studies have focused exclusively on the contributions made by this structure in processing visual and auditory signals. We aimed to fill this gap by specifically testing the hypothesis that the cerebellum plays a role in the acquisition of auditory and visual sensory data. We also tested whether the level of cerebellar activity associated with processing visual and auditory stimuli scales with the computational complexity involved in extracting a target signal from a noisy background. We used high-field functional magnetic resonance imaging (fMRI) to monitor neural activity within the cerebellum while participants endeavored to discriminate the direction of a moving visual or auditory target in noise. We chose this task because Thier et al. (1999) found that cerebellar patients are impaired in their ability to extract a coherent visual motion signal embedded in noise. We optimized the temporal and spatial resolution of our imaging procedure by limiting MR acquisition to the cerebellum and by using a high magnetic field (4 tesla). We also exploited a new, spatially unbiased atlas of the cerebellum (Diedrichsen, 2006) to normalize the fMRI data and localize blood oxygen level-dependent (BOLD) activation clusters. Based on a meta-analysis by Petacchi et al. (2005), we expected to find a subset of regions in the cerebellar cortex (especially a left-hemispheric region extending from crus I to lobule VI) that should be active during auditory motion detection (Petacchi et al., 2005). We also expected, based on the work of Bower (1997, 2002), that the level of neural activity should be related to the perceptual demands of the sensory task, and specifically to the strength of the signal relative to the background noise in which it is embedded. Based on previous positron emission tomography (PET) data (Barbur et al., 1993; DuPont et al., 1994), we further expected that midline areas of the cerebellum would respond during the visual motion detection task.
Materials and Methods
Participants
Seventeen participants gave informed consent to the behavioral and brain imaging procedures, as approved by The University of Queensland Human Research Ethics Committee. The participants' ages ranged from 20 to 45 years (mean age, 29 years). Seven of the participants were female; all were right handed. Participants' performance on the experimental tasks was assessed in the laboratory before imaging, so that we could exclude individuals who were unable to maintain stable fixation. Three participants were excluded in the training session for this reason, leaving 14 to participate in the fMRI experiment.
Prescan training and eye movement assessment
Since we were unable to measure eye movements during scanning, participants were trained intensively and assessed in the psychophysical laboratory before imaging to ensure that all individuals recruited into the fMRI study were able to refrain from making eye movements during the experiment.
Visual stimulation
Participants stabilized their head on a chinrest and viewed the stimuli on a cathode ray tube monitor. The image was 26° of visual angle horizontally and 20° of visual angle vertically (i.e., 1600 × 1200 pixels) at a viewing distance of 65 cm. The stimuli were digital movies created with Matlab (version 7.6). The stimuli consisted of a white fixation dot (0.4°, 100 cd/m2) and 400 sparse gray background dots (0.4 ° of visual angle, 45 cd/m2) on a black background (0.5 cd/m2). The stationary fixation dot was displayed centrally. The background dots moved along random trajectories, creating a random-dot kinematogram. Three levels of motion coherence (0, 15, and 30%) were presented. The signal levels were chosen, based on pilot testing, to correspond approximately to levels of subjectively low (30% signal-strength) and high (15% signal-strength) difficulty. In the displays with 15 and 30% coherent motion, the coherent dots moved along the horizontal axis with a sinusoidal velocity profile, and with a maximum speed at the center of the display of 12.6° per second. The speed of the random-dot trajectories was distributed over the same range and had the same mean velocity as the coherent dots. The half-life of each dot (coherent or random) was 1 s, after which it was replaced by another dot with a new speed and direction. These transition periods were randomized over time, such that a steady migration of dots from random to coherent, or vice versa, occurred.
Auditory stimulation
The stimuli were digital sound files created with Matlab (version 7.6). The moving sound was a Gaussian white noise that was convolved with a generic head-related transfer function for positions ±12° of azimuthal angle, in discrete steps of 1°. The sounds were smoothed by a Hanning window to create the impression of a continuously moving sound source. The virtual sound source had the same sinusoidal velocity profile as the coherently moving dots in the visual displays. Three levels of auditory directional motion (0, 50, and 100%) were presented. As for the visual condition, the signal levels were chosen based on pilot testing, to correspond approximately to levels of subjectively low (100% signal-strength) and high (50% signal-strength) difficulty. The stationary sound (0%) was Gaussian noise, which was convolved with the same generic head-related transfer function for 0° of azimuthal angle (i.e., straight ahead). This manipulation yielded the impression of a stationary sound source located just in front of the listener. The virtual sound source with 50% coherent motion was created by averaging the sound files with 0 and 100% directional auditory motion. All three sound files had the same mean energetic profile. The amplitude was ∼76 dBA sound pressure level inside the headphones.
Task
Auditory and visual stimuli were presented in blocks of four trials each. Each trial lasted for 3 s (1 s for the target plus noise stimulus, followed by a response interval of 2 s). Participants received a cue before each block to indicate whether they were about to undertake the auditory or visual task. Participants were asked to judge whether they perceived a leftward or rightward moving target stimulus within the noise. They were instructed to press one of two buttons (using their right thumb) to indicate that the stimulus contained leftward or rightward coherently moving dots (in the visual condition) or contained a leftward or rightward moving sound (in the auditory condition). Participants were not informed that there would be trials in which there was no directional motion signal (the 0% coherence conditions). Instead, they were told that the signal would occasionally be below their perception threshold and that in these instances, they should make their best guess as to the direction of motion. Participants were instructed to withhold their response until the end of the stimulation period. Response times were thus determined from the offset of the stimulus to the onset of the button-press response. In all trials, participants responded within the 2 s time window allowed. Participants were instructed to maintain fixation centrally during the experiment and to avoid blinking during stimulus presentations. During the rest periods between trials, a blank screen containing the fixation dot alone was presented for 2 s. Thirty blocks (120 trials) were presented in each training session, and every participant completed at least two such training sessions. All aspects of stimulus delivery and response recording were controlled using Presentation software (version 14.0; Neurobehavioral Systems).
Recordings of eye movements
During the training session, eye movements were recorded to monitor fixation compliance using an Eyelink Gazetracker (SR Research). The sampling frequency of the eye-tracker signal was 1000 Hz, the spatial resolution was 0.05°, and the accuracy was ±0.125°. The eye-recording system was calibrated for each participant, to determine the exact deviation from central fixation. Using a custom Matlab program (version 7.6), we analyzed eye-position traces off-line and evaluated the fixation performance of the participants. At the end of the training session, only those participants whose maximum deviation during stimulus presentation was less than ±0.3° across all conditions were selected for the fMRI study. We also conducted statistical tests to determine whether the average maximum deviation differed for the visual and auditory conditions, the different signal levels, and for trials with leftward versus rightward motion. There were no significant differences for any of these comparisons (paired t tests; threshold, p = 0.05). Together, the results of the fixation training regimen verified that participants were able to maintain constant and reliable fixation under all experimental conditions.
fMRI experiment
Stimulation.
Participants were positioned supine in the scanner with their head tightly secured in the headcoil to minimize head movement. They viewed the stimuli with a mirror that reflected the image from the projection screen placed at the foot of the scanner bed. The auditory stimuli were presented using an amplifier and MRI-compatible sound-dampening headphones (both from MR Confon). The stimulus sequences had the same parameters as in the behavioral training study conducted outside the scanner.
Task.
The task was exactly the same as in the training session. Participants were instructed to maintain fixation centrally throughout each run. Auditory and visual stimuli were presented in blocks of four trials. Each experimental run contained 30 blocks, yielding 5 blocks per condition (visual: 0, 15, and 30%; auditory: 0, 50, and 100%). There were four experimental runs per participant, yielding 480 trials in total (80 per condition). The blocks were separated by rest intervals of 0–6.75 s, in which the display contained the central fixation dot alone. The temporal design of the stimulus sequence was optimized using the program optseq2 (Dale, 1999).
MRI acquisition.
Brain images were acquired on a 4T MedSpec MRI scanner (Brucker Biosciences) with a transverse electromagnetic headcoil. For the functional data, 32 axial slices were acquired in an interleaved order, using a gradient echo echo-planar T2*-sensitive sequence (repetition time, 2 s; echo time, 30 ms; flip angle, 90°; matrix, 64 × 64; field of view, 192 × 192 mm; voxel size, 3 × 3 × 3 mm). We used a local shim covering the cerebellum. We also acquired a field map [same resolution per slice as the echo-planar imaging; repetition time, 900 ms; echo time 1, 5.4 ms; echo time 2, 10.8 ms] and a T1-weighted structural 1 mm cubic inversion recovery prepared FLASH three-dimensional scan. A liquid crystal display projector (1024 × 768 resolution) back-projected the stimuli onto a screen positioned at the end of the scanner bed. Participants lay on their backs within the bore of the magnet and viewed the stimuli comfortably via a 45°-angled mirror that reflected the images displayed on the screen. The distance to the screen was 265 cm (15 cm from eyes to mirror) and the visible part of the screen encompassed ∼21 × 11° of visual angle (98 × 50 cm). To minimize head movement, all participants were stabilized with tightly packed foam padding surrounding the head.
Image processing and statistical analysis of fMRI data.
Image processing and statistical analyses were performed using SPM5 (Wellcome Department of Imaging Neuroscience, University College London, London, UK). Functional data volumes were slice-time corrected, unwarped using the individually acquired field maps, and realigned to the first volume. A T2*-weighted mean of the images was coregistered with the corresponding anatomical T1-weighted image from the same individual. The individual T1 image was used to derive the transformation parameters for the stereotaxic space and to create an individual binary mask to exclude areas that were not part of the cerebellum, using the spatially unbiased infratentorial template for the cerebellum and the associated normalization procedure (Diedrichsen, 2006). The transformation parameters and the mask were then applied to the individual coregistered echo-planar images. The binary mask and the resulting images were manually inspected using MRIcron (http://www.sph.sc.edu/comd/rorden/mricron) to ensure that the automatic segmentation process functioned properly. Images were then smoothed with an 8 mm full-width at half-maximum isotropic Gaussian kernel. Analyses using the general linear model (Friston et al., 1995) were conducted after applying high-pass filtering (cutoff, 128 s). In an event-related design analysis, responses during the 1 s stimulation periods were modeled with a boxcar function convolved with the hemodynamic response function separately for the six conditions (0, 15, and 30% coherently moving dots and 0, 50, and 100% directional moving sound source). The relevant conditions were contrasted using t statistics, generating the contrast images for second-level evaluation. These images were analyzed at the group level with SPM5 using t tests to test for differences between the visual and auditory conditions, as well as for linear effects of signal intensity (using factorial designs with subsequent t tests). Voxels surpassing a cluster-level statistical threshold of p = 0.05 (t contrast analysis, corrected for multiple comparisons; height threshold, p = 0.001) were identified as active. A probabilistic atlas of the cerebellum (Diedrichsen et al., 2009) and MRIcron (http://www.sph.sc.edu/comd/rorden/mricron) were used for the identification of anatomical locations. Figure 1 provides a detailed map of the human cerebellum, with key anatomical regions highlighted, following the nomenclature of Schmahmann et al. (2000).

Human cerebellar anatomy shown in sagittal and coronal planes. The locations of anatomical regions (nomenclature according to Schmahmann et al., 2000) were derived using the probabilistic atlas of the cerebellum by Diedrichsen et al. (2009).
Results
Behavioral data
The average accuracy rates for the fMRI study were >89% for all six conditions. A repeated-measures, 2 × 2 ANOVA with the factors modality (auditory or visual) and signal strength (low or high) revealed significant main effects for modality (F(1,13) = 18.31; p < 0.05) and signal strength (F(1,13) = 42.45; p < 0.05) but no significant interaction between them. The average accuracy rate was greater for the auditory task than for the visual task and greater for the high-signal condition than for the low-signal condition. In the visual and auditory conditions with no signal present (0% signal strength), the proportion of “left” responses was 48.49% (SE, 2.59%) for the visual condition and 49.52% (SE, 2.08%) for the auditory condition. There was no significant difference from 50% for either of the modalities (t test; threshold, p = 0.5). Together, the accuracy data indicate that stimuli in signal-present trials were detected at rates above chance in both the visual and auditory modalities. There was also a modest but significant increase in detectability with signal strength for both visual and auditory stimuli. As expected, accuracy in no-signal trials was at chance.
The average reaction times, measured from stimulus offset, are displayed in Figure 2. A repeated-measures, 2 × 3 ANOVA with factors of modality (auditory or visual) and signal strength (no, low, or high) revealed significant main effects for modality (F(1,13) = 10.91; p < 0.05) and signal strength (F(2,26) = 7.36; p < 0.05) but no significant interaction between them. Planned pairwise comparisons between the different signal levels, conducted separately for each modality, revealed significant differences between all signal strengths, with the exception of the low-level versus high-level visual motion conditions, which did not differ significantly from each other (threshold, p = 0.05; corrected for multiple comparisons). The longer response times with decreasing signal strength reflects an increase in the sensory demands of the perceptual task when less directional signal is present. The results also indicate that the visual task was somewhat more demanding overall than the auditory task.

Mean response times (±1 SE) for the visual and auditory conditions of the motion discrimination task.
fMRI data
Brain areas showing a stronger response to visual than auditory motion
By direct comparison of BOLD activity in trials in which participants were engaged in extracting a visual directional motion signal from noise, with that obtained for the analogous auditory condition, we aimed to identify brain regions that are significantly more involved in the processing of visual data. We found two regions of the cerebellar cortex that responded more strongly to visual stimulation (averaged over all three signal levels) than to auditory stimulation. These were the right-hemispheric lobule X (24, −40, −44; cluster size, 97) (Fig. 3a,b; Table 1) and vermal lobule VI (0, −72, −22; cluster size, 293) (Fig. 3c, Table 1). In humans, midline cerebellar regions have previously been reported to respond to visual stimulation (Barbur et al., 1993; DuPont et al., 1994). Using high-field MRI, we are now able to identify the anatomical location in a more spatially precise manner.
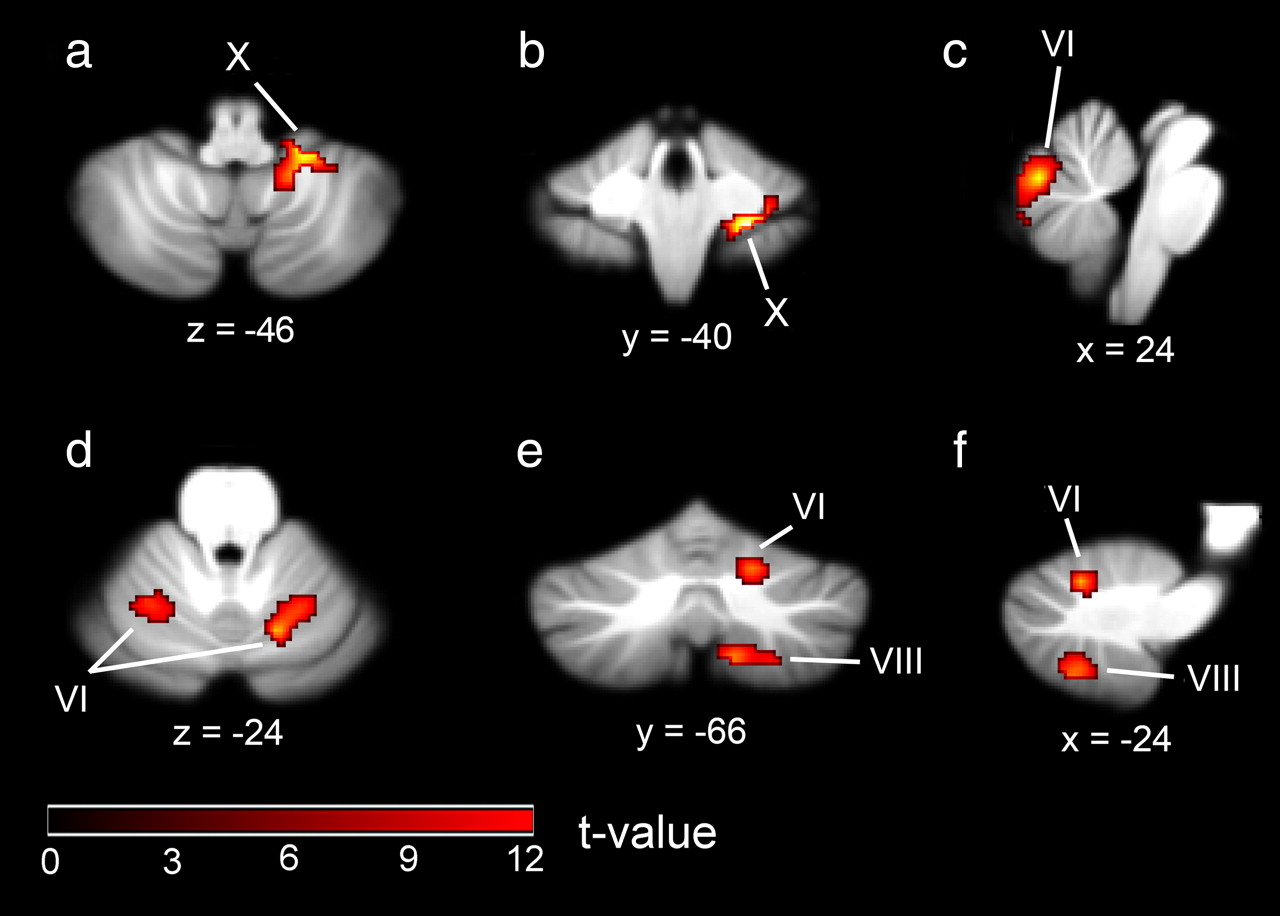
MR brain slices showing mean BOLD activity from the random-effects analysis comparing modality-specific effects. a–c, Visual motion > auditory motion. d–f, Auditory motion > visual motion.
Summary of fMRI findings for all contrasts
Brain areas showing a stronger response to auditory than visual motion
Using the complementary contrast, comparing BOLD activity for trials in which participants were engaged in extracting an auditory directional motion signal from noise (averaged over all three signal levels) with the analogous visual condition, we identified three cerebellar regions. These were the hemispheric lobules VI bilaterally (−24, −58, −24; cluster size, 106; 16, −66, −24; cluster size, 104) (Fig. 3d–f; Table 1) and the right-hemispheric lobules VIIIA and VIIIB (12, −64, −52; cluster size, 105) (Fig. 3e,f; Table 1). Lobule VI was among the regions that, based on the meta-analysis by Petacchi et al. (2005), were predicted to show a neural response to auditory stimulation. Although a direct comparison of the visual and auditory conditions permitted us to identify cerebellar regions that show different levels of BOLD activity depending on the stimulus modality (visual or auditory), this comparison cannot identify regions that respond to a similar extent in both modalities. We therefore also tested for cerebellar regions in which BOLD activity levels varied with respect to the strength of the visual and auditory motion signal, since regions that exhibit such a relationship are most likely to be involved in the processing of visual or auditory motion.
Increases in neural activity related to decreases in strength of the auditory and visual motion signal
Bower (1997, 2002) proposed that levels of cerebellar involvement, and therefore neural activity, should be higher for sensory tasks that are computationally more difficult and therefore require a fine level of sensory data analysis. We assume that the task of detecting a motion signal embedded in noise should become computationally more complex as the strength of the motion signal relative to the noise decreases. This, in turn, should require a greater involvement of relevant cerebellar subregions. For the visual motion condition, we found a region in the left crus I (−38, −64, −30; cluster size, 112 voxels) (Fig. 4a, Table 1) in which activity was correlated with decreases in the strength of the visual motion signal. In the auditory motion condition, we also found a region in left crus I (−38, −56, −32; cluster size, 192 voxels) (Fig. 4a, Table 1) in which the activity level was correlated with decreases in the strength of the motion signal. The maxima of the activations from the visual and auditory conditions were close to each other, and the clusters overlapped substantially, as shown in Figure 4a. The cerebellar region crus I was predicted to be involved in auditory processing based on the results of the meta-analysis by Petacchi et al. (2005). Our findings suggest that this region is also involved in visual processing, which raises the question whether crus I is a supramodal sensory region that is modulated by perceptual task demands.

MR brain slices depicting linear relationships between BOLD signal and the strength of the auditory and visual motion signals. a, Brain areas showing a negative correlation between BOLD signal and motion signal strength. Red shading represents activity for the visual motion condition; green shading represents activity for the auditory motion condition; yellow shading indicates activation overlap between the visual and auditory conditions. b, Brain areas showing a positive correlation between BOLD signal and auditory motion signal strength.
Increases in neural activity related to increases in strength of the auditory and visual motion signal
We did not have a specific hypothesis regarding regions in which the BOLD signal should show a positive relationship with the strength of the visual and auditory motion signals. According to the hypothesis of Bower (1997, 2002) and the results of Petacchi et al. (2005) and Thier et al. (1999), the supporting role of the cerebellum in sensory tasks, and therefore its level of involvement in them, should be higher for perceptually more difficult tasks. Nevertheless, we found two activation clusters in which the activity level was correlated with increases in the strength of the auditory motion signal; the first cluster was located in right lobule IX (6, −58, −42; cluster size, 353) (Fig. 4b, Table 1), and the second cluster was located in right crus I (34, −80, −36; cluster size, 174) (Fig. 4b, Table 1). There was no cerebellar region in which the activity level was significantly correlated with increases in strength of the visual motion signal.
Discussion
Using fMRI, we monitored the BOLD signal of the cerebellum while participants were engaged in a task in which they had to detect a directional visual or auditory motion signal in noise. Our study aimed to test the hypothesis that the cerebellum is involved in the acquisition of auditory and visual sensory data. We also tested the hypothesis that the cerebellum should be especially active for tasks that are computationally more difficult and that therefore require a fine level of sensory data control (Bower, 1997, 2002). We varied the signal-to-noise level of visual and auditory motion signals embedded in noise to test different levels of demand for sensory data control. The task of detecting weak visual and auditory motion signals in noise was therefore predicted to require a higher degree of cerebellar involvement.
Differential neural responses to visual and auditory stimulation
In a previous PET study by DuPont et al. (1994), vermal activity was observed in response to a moving dot pattern. Also, according to a PET study by Barbur et al. (1993), vermal activity in response to a small moving bar was observed in a blindsight patient (G.Y.), who has a unilateral lesion of the primary visual cortex (area V1). However, the poor resolution of PET did not allow precise determination of the locus of activation. Our approach, using high-field MRI and state-of-the-art normalization procedures, allowed us to identify vermal lobule VI and right-hemispheric lobule X as two structures that are significantly more active during visual stimulation than during auditory stimulation. It is unlikely that these activations were attributable to unexpected eye movements, since our participants underwent extensive training so that they could refrain from making eye movements during the MRI session. If eye movements or fixation suppression were the source of the observed activity, we would also expect to see a correlation between activity in these areas and the level of coherent visual motion, but this was not the case. Furthermore, an important cerebellar role in extracting motion signals embedded in noise, independent of impairments in eye movement control, has been shown previously in a study of cerebellar lesion patients (Thier et al., 1999). In nonhuman primates, both lobule X (Waespe et al., 1981; Zee et al., 1981) and the vermis (Suzuki et al., 1981) have been found to encode components of target motion. Most importantly, neuronal responses to the movement of large-field, random-dot background patterns have been observed in the primate lobule X as well as the vermis (Suzuki and Keller, 1988). Our observations of responses in vermal lobule VI and right-hemispheric lobule X during visual stimulation are, consequently, in line with previous findings in humans and nonhuman primates.
In the reverse contrast, testing for greater neural responses to auditory than to visual stimulation, we identified a symmetrical, bilateral activation in central parts of hemispheric lobule VI, as well as a right lateral cluster in hemispheric lobules VIIIA and VIIIB. As in the meta-analysis by Petacchi et al. (2005), all the clusters were hemispheric, with no consistent pattern of activation in the vermal or paravermal regions. Hemispheric lobule VI is one of the regions associated with auditory function in the meta-analysis by Petacchi et al. (2005). Furthermore, neural activity in right-hemispheric lobules VI and VIII has previously been associated with accuracy in a timbre discrimination task (Reiterer et al., 2008). The perception and discrimination of timbre, which allows the auditory system to distinguish sounds that have the same pitch and loudness, is an acoustically demanding but prelinguistic task (Grey, 1977). Our task of extracting an auditory motion signal from noise, and the timbre discrimination task of Reiterer et al. (2008), requires a fine level of sensory data control and therefore should involve cerebellar processing.
Neural responses to varying levels of sensory signal
We tested for cerebellar regions in which activity correlated with either increases or decreases in signal strength of visual or auditory motion. We hypothesized that any region that exhibits such a relationship is most likely to be involved in the processing of visual or auditory motion. We found a region in left crus I in which activity was negatively correlated with the strength of the motion signal for both the auditory and the visual conditions. Such a relationship can be interpreted as an increase in neural activity with increases in the perceptual demands of the task. The location of the activation cluster corresponds closely to the one identified in the meta-analysis of Petacchi et al. (2005) as having the highest probability of being involved in auditory perception. We found crus I was activated, to a similar extent, for both the auditory and visual conditions, with a slightly greater activation for auditory stimuli. This fits with the suggestion by Schmahmann (1996) that the cerebellar hemispheres have a crucial supramodal function in sensory processing, consistent with the finding that inputs from different association areas of the cerebral cortex converge on common areas within the neocerebellum.
In the reverse contrast, testing for brain regions in which activity levels were positively correlated with the strength of the auditory and visual motion signals, the only significant results were for the auditory condition. One cluster was located in right crus I, in a region corresponding to that identified in the meta-analysis of Petacchi et al. (2005). The second cluster was located in right lobule IX. These unexpected positive correlations suggest that neurons within right crus I and lobule IX increase their activity with increases in the strength of the auditory motion signal, as has been observed for visual motion processing in area MT (Britten et al., 1993; Rees et al., 2000).
Our findings leave open the question of whether distinct neuronal subtypes within the cerebellum contribute differentially to BOLD activity associated with changes in sensory signal strength. In a recent study of rat cerebellum, Howarth et al. (2010) found that the input-driven granule cells are responsible for 67% of the total signaling energy, whereas the principal Purkinje neurons are responsible for only 18% (with interneurons accounting for the remaining energy consumption). If this finding also holds in humans, the correlations we observed between BOLD activity and sensory signal strength within distinct subregions of the cerebellum might reflect a larger contribution from input-driven granule cells than from the principal output-related Purkinje neurons. This would be an interesting question to address in future fMRI studies of task-related cerebellar activity in humans.
It is also important to consider the possible contribution of attentional processes to cerebellar activity associated with sensory discrimination tasks (Allen et al., 1997; Le et al., 1998; Gottwald et al., 2004). Patients with cerebellar lesions are impaired in divided- and shifting-attention tasks but are apparently normal in selection tasks that do not require attention shifts (Gottwald et al., 2003). In contrast, Thier et al. (1999) showed that attentional effects alone are not able to account for all the visual deficits observed in cerebellar lesion patients. Since our tasks did not explicitly require participants to divide or shift attention, it is unlikely that the correlations we observed between BOLD activity and signal strength in subregions of the cerebellum are caused by attentional mechanisms alone.
Conclusions
We used fMRI to test the hypothesis that the human cerebellum is involved in the acquisition of auditory and visual sensory data. Our results confirmed this prediction by identifying a set of cerebellar regions that are activated during discrimination of both visual (vermal lobule VI and right-hemispheric lobule X) and auditory (hemispheric lobules VI and VIII) motion stimuli. We also tested the hypothesis that the cerebellum should be especially active for tasks that require a fine level of sensory data control (Bower, 1997, 2002). Consistent with this prediction, we found that activity within left crus I increased as signal strength decreased, for both auditory and visual motion tasks. Contrary to expectations, however, activity within right crus I and lobule IX increased as signal strength increased, but for the auditory task only. Our findings demonstrate that the cerebellum plays a crucial role in processing auditory and visual motion and suggest that parts of cerebellar cortex are concerned with tracking movements of objects around the animal, rather than with controlling movements of the animal itself (Paulin, 1993).
Footnotes
-
This work was supported by a University of Queensland New Staff Research Start-Up Grant to O.B. We thank Stefan Uppenkamp (Department of Physics, University of Oldenburg, Oldenburg, Germany) for providing the generic head-related transfer functions.
- Correspondence should be addressed to Oliver Baumann, Queensland Brain Institute, The University of Queensland, St. Lucia, Queensland 4072, Australia. o.baumann{at}uq.edu.au


