

Article Figures & Data
Figures
- Figure 1.
Schematic view of the experimental setup. A, Experiment 1. The hand pad was located at 30 cm from the subject. The turntable randomly presented the objects 30 cm ahead from the hand pad. A screen, made from switchable transparent glass, was positioned between the subject and the turntable to control precisely the timing of object presentation. B, Experiment 2. Subjects had to grasp and lift a manipulandum with force sensors measuring the GF (red) and LF (blue). A hole under the table beneath the manipulandum contained a hollow steel cylinder. A load of 300 g was placed inside the cylinder and could be attached to the manipulandum to increase its weight without the subject being aware.
- Figure 2.
Corticospinal excitability during movement preparation. TMS was delivered at three timings (x-axis) before subjects grasped and lifted the objects. The MEP ratio (y-axis) was obtained by dividing MEPs recorded when preparing lifts preceded by a heavy object by MEPs recorded when preparing a lift preceded by a light object. A, MEP ratio when preparing to lift objects of unknown weight. B, MEP ratio when preparing to lift objects of visible weight (light, white; heavy, gray). C, MEP ratio between MEPs recorded during preparation of lift of a heavy object and a light object but both preceded by an object of the same weight (light, white; heavy, gray). *p < 0.05.
- Figure 3.
Typical traces for lift of a light (A) and a heavy (B) object. Traces show the evolution of GF and LF (top traces) and of their derivatives (GF and LF rates; bottom traces). A, When lifting a light object after having picked up a heavy one (dotted lines), the GF peak and GF rate are higher than if the previous object was a light one (solid lines, see arrows *). B, When lifting a heavy object after having picked up a light one (dotted lines), the GF peak and GF rate are lower (see arrows *) and the loading phase longer (see arrows **) than if the previous object was a heavy one (solid lines). The horizontal dashed line represents the load of the light (A) and heavy (B) objects.
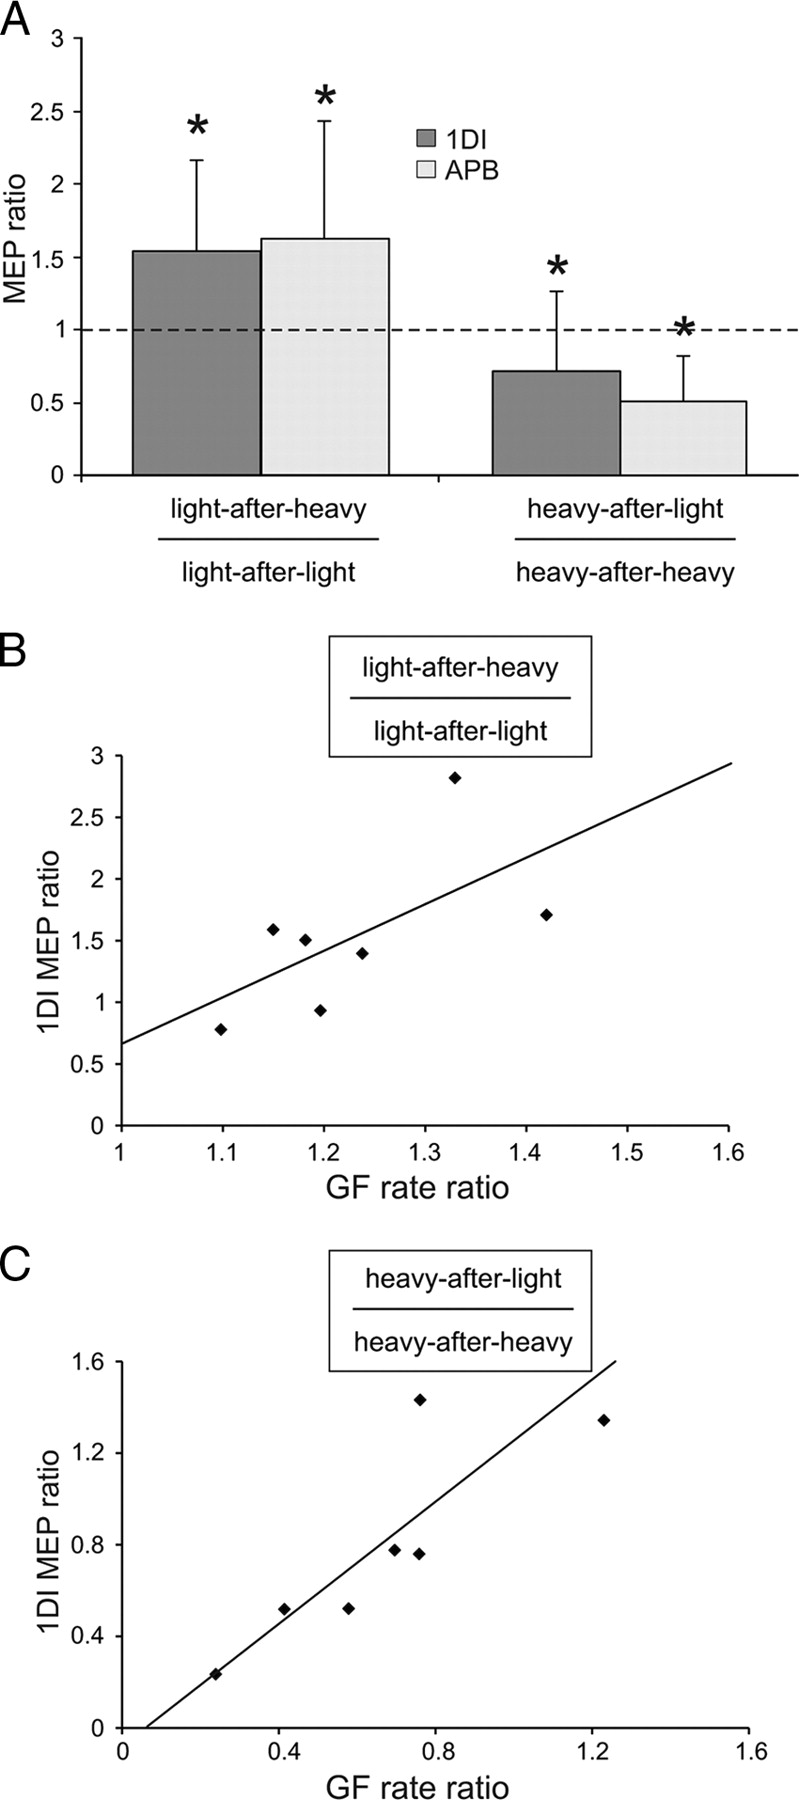
- Figure 4.
Relationship between the corticospinal excitability and the grip force. A, The y-axis represents the MEP ratio between lifts of a light object preceded by a heavy and a light object (left bars) and the MEP ratio between lifts of a heavy object preceded by a light and a heavy object (right bars). B, C, Correlations between the MEPs and the GF rate ratios for light (B) and heavy (C) objects. Note that the greater the MEP facilitation, the higher the GF rate. *p < 0.05.
- Figure 5.
Interaction between information based on internal object representation and visual cues. Top, Schematic representation of the MEP amplitude for the four different lift conditions (a–d) and for each TMS timing (50, 100, or 150 ms) during movement preparation based on the data of Figure 2, B and C. At 50 ms, the ratios between conditions light-after-heavy and light-after-light (b/a) and between heavy-after-heavy and heavy-after-light (d/c) are above 1, meaning that b or d are greater than a or c, respectively. In contrast, ratios between heavy-after-light and light-after-light (c/a) and heavy-after-heavy and light-after-heavy (d/b) are close to 1, meaning that MEP amplitudes in these conditions are comparable. At 150 ms, instead, the b/a and d/c ratios are now close to 1 and the c/a and d/b ratios are above 1, meaning that, whatever the previous lift, visibly heavier objects have a larger MEP than lighter ones. Intermediate values are found at 100 ms. Bottom, Schematic evolution of the CSE during movement preparation depending on the previous lift and the upcoming visual cues. For example, if the previous object was light (black dotted line), CSE is low and remains low if the visual cues about the upcoming object are indicating a light weight (gray dotted line) or increases if cues are informative of a heavy object (gray solid line).


