

Article Figures & Data
Figures
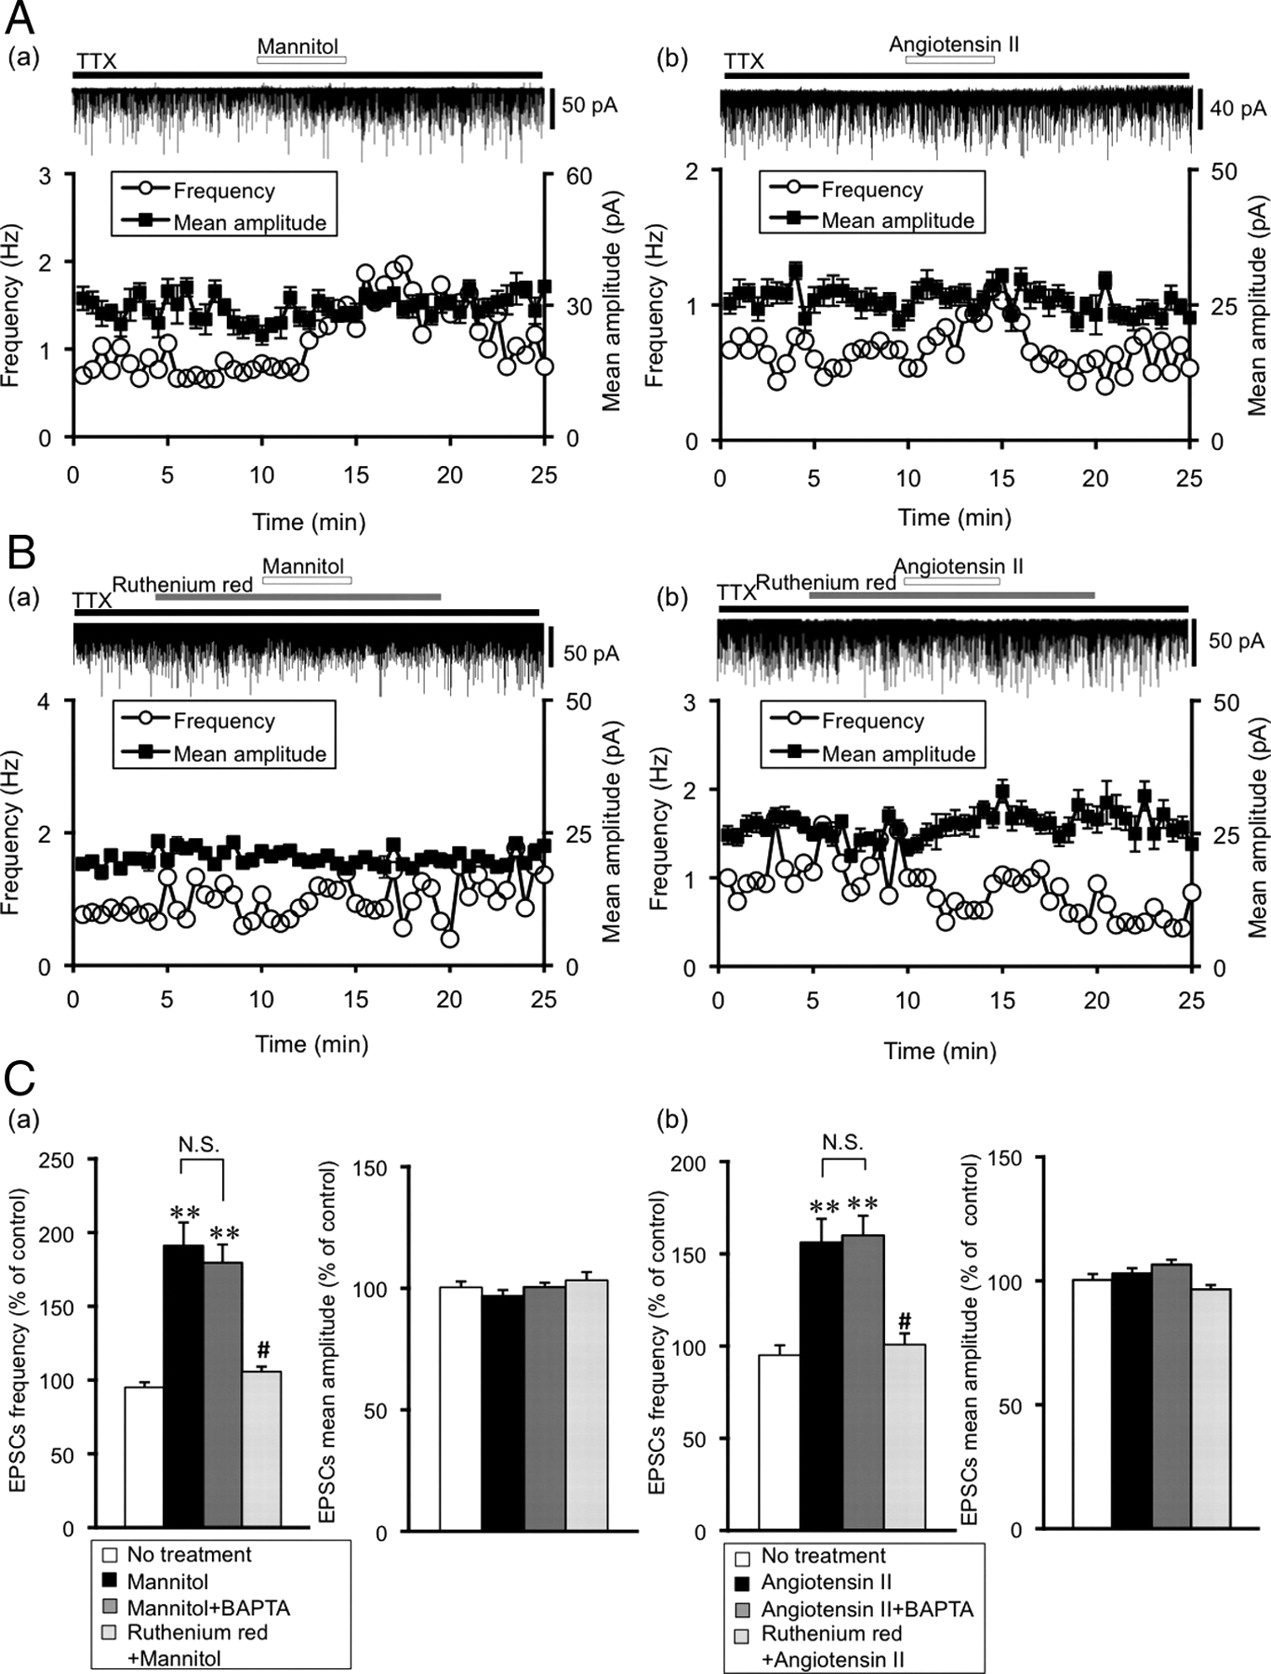
- Figure 1.
Effects of mannitol and angiotensin II on mEPSCs in the SON. A, Representative examples of mannitol (a) (60 mm, 360 mOsmol/kg) and angiotensin II (b) (0.1 μm) on mEPSCs. EPSCs were recorded in the presence of TTX (1 μm). The holding potential was −70 mV. Plots of frequency are single measurements, whereas plots of amplitude are mean ± SEM over 30 s. B, Representative examples of the effects of a nonspecific TRPV1 blocker, ruthenium red (10 μm) on mannitol (a)- and angiotensin II (b)-induced potentiation of mEPSCs. Mannitol- and angiotensin II-induced potentiation of mEPSCs was suppressed by ruthenium red. C, Summary data for the effects of ruthenium red on the frequency and amplitude of mEPSCs. a, Frequency (left) and amplitude (right) of mEPSCs. No treatment (n = 7), mannitol (n = 8), mannitol plus BAPTA (n = 8) and mannitol plus ruthenium red (n = 6), respectively. b, No treatment (n = 7), angiotensin II (n = 8), angiotensin II plus BAPTA (n = 9) and angiotensin II plus ruthenium red (n = 13). BAPTA in the pipette solution did not affect the potentiation of mEPSCs by mannitol and angiotensin II. Data are mean ± SEM. **p < 0.01, compared with no treatment. #p < 0.01, compared with mannitol or angiotensin II.
- Figure 2.
Pharmacological characterization of the presynaptic TRVP1 channel in the SON. A, Representative example of the effect of capsaicin (10 μm), a TRPV1 channel agonist, on mEPSCs. The holding potential was −70 mV. Plots of frequency are single measurements, whereas plots of amplitude are mean ± SEM over 30 s. B, Representative examples of the effect of selective TRPV1 channel blockers on mannitol-induced potentiation of mEPSCs. a, Capsazepine (10 μm); b, SB366791 (100 μm); and c, BCTC (10 μm). C, Summary data for the effects of TRPV1 selective blockers. Frequency (left) and amplitude (right) of mEPSCs. No treatment (n = 7), mannitol (n = 7), mannitol plus capsazepine (n = 8), mannitol plus SB366791 (n = 7) and mannitol plus BCTC (n = 11). Data are mean ± SEM. **p < 0.01, compared with no treatment.
- Figure 3.
Characterization of the mannitol- and angiotensin II-induced potentiation of mEPSCs. A, Representative examples of the effect of AM251, a cannabinoid type 1 receptor blocker, on the mannitol- and angiotensin II-induced potentiation of mEPSC. a, Mannitol; b, angiotensin II. The holding potential was −70 mV. Plots of frequency are single measurements, whereas plots of amplitude are mean ± SEM over 30 s. B, Summary data for the characterization of mEPSCs under mannitol and angiotensin II application. a, Frequency (left) and amplitude (right) of mEPSCs. mannitol (n = 8), mannitol plus AM251 (n = 8), mannitol plus PMP-AVP (n = 6), mannitol plus atosiban (n = 6) and mannitol (fluorocitric acid) (n = 5), respectively. b, Angiotensin II (n = 8), angiotensin II plus AM251 (n = 6), angiotensin II plus PMP-AVP (n = 4), angiotensin II plus atosiban (n = 6) and angiotensin II (fluorocitric acid) (n = 4). Data are mean ± SEM. *p < 0.05, compared with mannitol or angiotensin II. C, Mannitol-induced potentiation of mEPSCs is extracellular Ca2+ dependent. a, A representative example of the effect of mannitol (60 mm) on mannitol-induced potentiation of mEPSCs in the Ca2+-free perfusion medium. b, Summary data for the effects of mannitol on frequency (left) and amplitude (right) of mEPSCs in normal solution (n = 8) and in Ca2+-free solution (n = 8). Data are mean ± SEM. **p < 0.01, compared with no treatment.
- Figure 4.
Mannitol and angiotensin II independently modulate mEPSCs through PKC pathway and TRPV channels. A, Mannitol-induced potentiation of mEPSCs is not affected by pre-exposure to losartan, angiotensin II type 1 receptor antagonist. a, Representative example of the effect of losartan (10 μm) on mannitol-induced potentiation of mEPSCs. The holding potential was −70 mV. Plots of frequency are single measurements, whereas plots of amplitude are mean ± SEM over 30 s. b, Summary data for the effects of mannitol on the frequency and amplitude of mEPSCs in the presence of losartan (n = 12). Data are mean ± SEM. **p < 0.01, compared with no treatment. B, Representative examples of the effect of bisindolylmaleimide I (PKC inhibitor) on mannitol (a)- and angiotensin II (b)-induced potentiation of mEPSCs. C, Summary data for the effects of bisindolylmaleimide I and thapsigargin (calcium-ATPase inhibitor) on mannitol- and angiotensin II-induced potentiation of mEPSCs. a, Frequency (left) and amplitude (right) of mEPSCs. No treatment (n = 7), mannitol (n = 8), bisindolylmaleimide I (10 nm) (n = 4), thapsigargin (10 nm) (n = 4). b, Frequency (left) and amplitude (right) of mEPSCs. No treatment (n = 7), angiotensin II (n = 8), bisindolylmaleimide I (n = 7), thapsigargin (n = 5). Data are mean ± SEM. **p < 0.01, compared with no treatment. #p < 0.01, compared with mannitol or angiotensin II.
- Figure 5.
Effects of mannitol and angiotensin II on mEPSCs in the SON of wild-type and Trpv1−/− mice. Representative examples of the effects of mannitol (A) (60 mm, 372 mOsmol/kg) and angiotensin II (B) (0.1 μm) on mEPSCs in wild-type mice and Trpv1−/− mice (TRPV1KO). All experiments were recorded in the presence of TTX (1 μm). The holding potential was −70 mV. Plots of frequency are single measurements, whereas plots of amplitude are mean ± SEM over 30 s.


