

Article Figures & Data
Figures
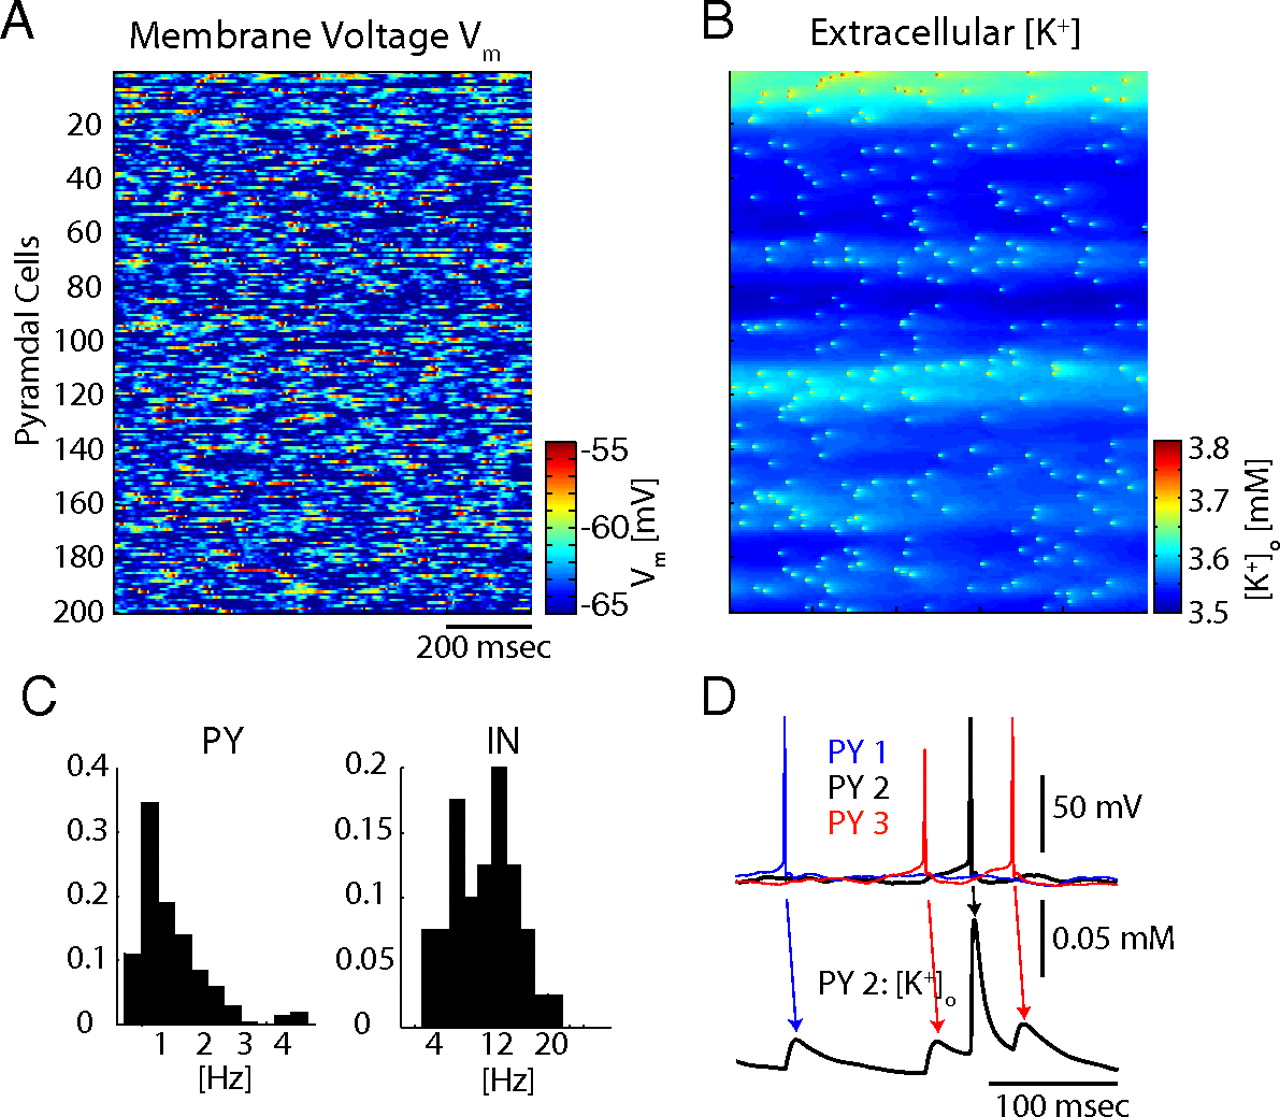
- Figure 1.
Physiological activity in cortical network with [K+]o dynamics. A, Color-coded activity map of 200 PYs (cool and hot colors indicate hyperpolarization and depolarization, respectively). B, Color-coded [K+]o map corresponding to activity in A. C, Firing rate histograms for pyramidal cells and inhibitory interneurons. D, Top, Overlaid membrane voltage traces of three neighboring pyramidal cells (PY 1, PY2, and PY 3 in blue, black, and red, respectively). Bottom, [K+]o in extracellular compartment surrounding PY 2. Minor deflections stem from action potentials in neighboring cells PY 1 and PY 3 (diffusion), major deflection from action potentials in PY 2.
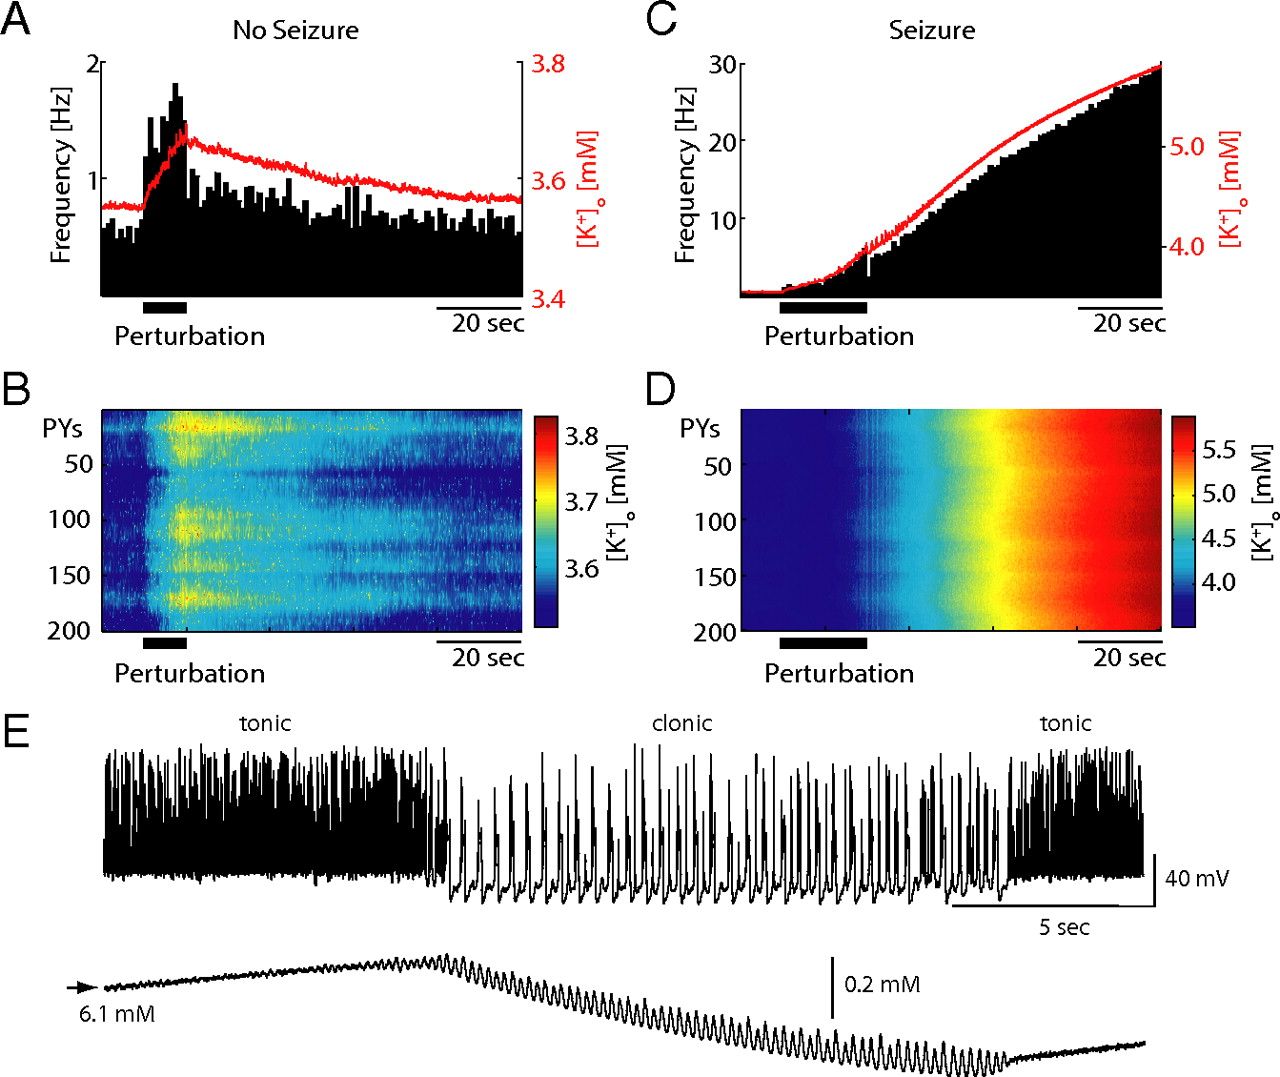
- Figure 2.
Transition from “physiological” to “pathological” activity. A, Average PY firing frequency (black histogram) and average [K+]o trace (red) for 10 s perturbation (increase in afferent input). The average firing frequency increased instantaneously while [K+]o increased and decreased only gradually. B, Color-coded [K+]o map. C, Same representation as in A but for a 20 s perturbation that is long enough to sufficiently increase [K+]o for seizure initiation. D, Color-coded [K+]o map. E, The pathological seizure state is characterized by epochs of tonic and clonic activity. Top, PY membrane voltage trace. Bottom, Corresponding [K+]o trace.
- Figure 3.
Threshold for seizure initiation. A, Average [K+]o traces for perturbation durations ΔT = 5, 10, and 15 s (no pathological activity induced) and ΔT = 16, 17, 18, 19, 20 s (transition into pathological seizure state). B, Same as in A but with increased temporal resolution. C, Histograms of [K+]o at perturbation offset across the PY network (averaged over 2 s) for ΔT = 15 and 16 s (“no seizure” and “seizure”). D, Network with frozen [K+]o exhibited constant activity level during perturbation without transition to pathological activity state. E, Prolonged reduction of the afferent input triggered switch back to physiological state. Left, Color-coded PY activity map. Right, Sample PY membrane voltage trace (top) and corresponding [K+]o trace (bottom). Plots show alternating epochs of tonic firing and slow bursting interrupted by reduction in afferent input (indicated by vertical arrow). At the onset of the input reduction, the network switched to bursting and [K+]o returned back to baseline.
- Figure 4.
Spatial network dynamics. A, Perturbation needs to span a substantial number of PYs for a transition into the pathological network state to occur. Perturbation that targeted 175 contiguous PYs elicited a transition from physiological to pathological network activity (top) whereas the same duration perturbation applied to 150 PYs failed to cause a transition (bottom). B, Critical perturbation duration to elicit state transition to pathological activity depends on the size of stimulated cell population (perturbation size). C, Color-coded [K+]o map for simulation critical stimulation (duration: 68 s; size: 75 cells). Note variability of the [K+]o across the network.
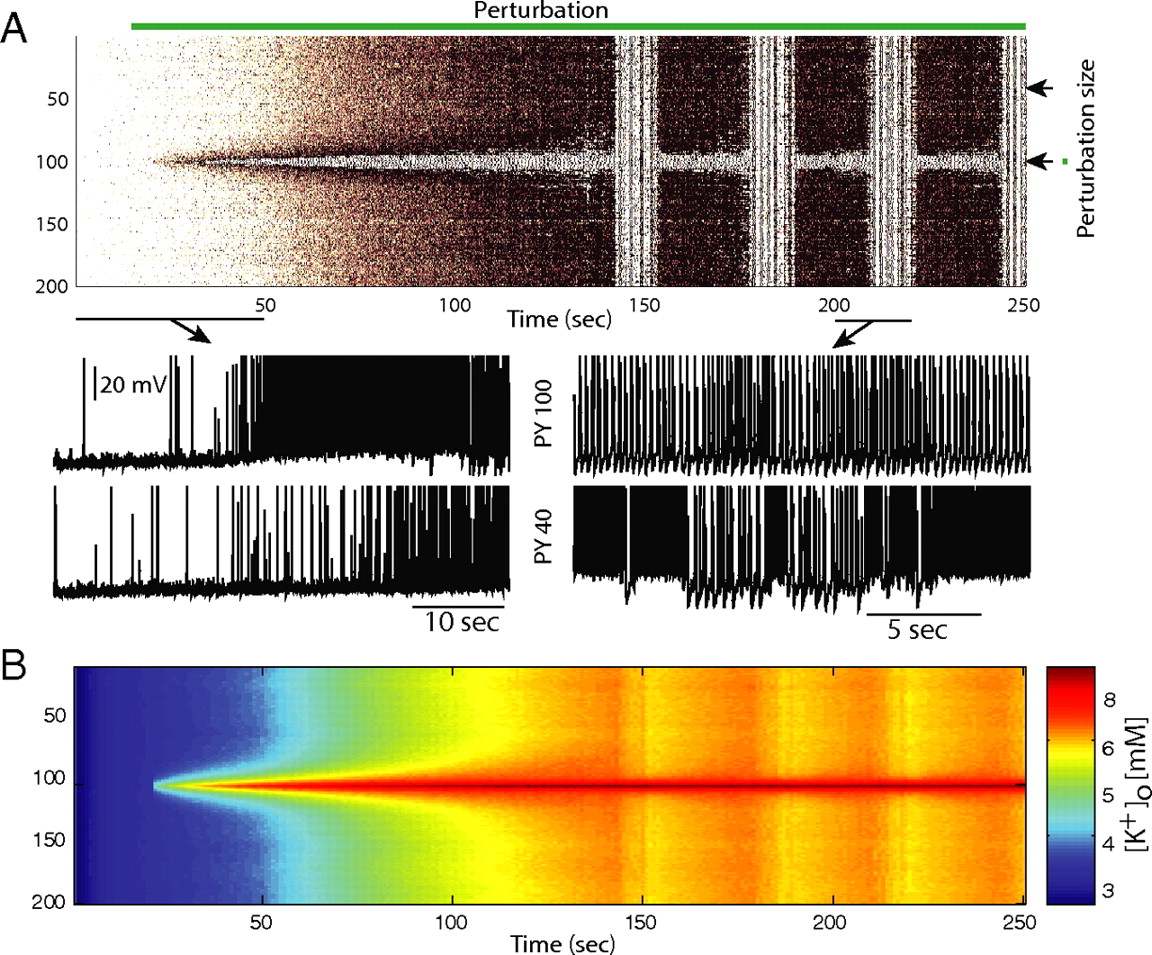
- Figure 5.
Pathological state initiation by local imbalance in [K+]o. A, Extracellular potassium source in the center of the network is sufficient to recruit the entire network into a transition to the pathological state. PYs in the areas of the [K+]o abnormality exhibit bursting behavior and do not show epochs of tonic firing as the remainder of the network. B, Color-coded [K+]o map.
- Figure 6.
Spontaneous transitions from physiological to pathological network state. Network responds with changes in firing rate to random changes in the afferent excitatory input without transition into the seizure state (top two traces). However, if random fluctuations cause a prolonged increase in afferent input, transitions into seizure state occur (bottom two traces).
- Figure 7.
Effect of glial buffering of excess K+ on network activity. Decreased effectiveness of the glial uptake system reduced the amount of excitatory input the network was able to withstand in the physiological state without switching to the pathological state. A, Critical stimulus duration required to trigger a transition to pathological network activity as a function of the threshold [K+]o(th) concentration (when [K+]o = [K+]o(th) the binding rate of the free extracellular K+ to the buffer is ½ of the unbinding rate). B, The same stimulus (20 s, shown with box) triggered a transition into the seizure state for [K+]o(th) = 17 mm but failed to do so for [K+]o(th) = 12 mm. Spikes are truncated at Vm = 0 mV for visualization purposes.
- Figure 8.
Conceptual model of bistability-mediated dynamic repertoire in cortical network mode with [K+]o dynamics. A, Physiological state is resilient to perturbations in afferent excitatory drive as long as duration, strength, and size are within limits. B, Schematic illustration of bistability between physiological and pathological network activity states. An epileptic seizure occurs as the network switches from the physiological to the pathological state (top). In nonepileptic brains, the basin of attraction of the physiological state is comparably bigger than the basin of attraction of the pathological seizure state (bottom). Perturbations in the form of transient increase in excitability are very unlikely to switch the network to the pathological seizure state. In the case of an epileptic brain, however, the domain of attraction of the seizure state is expanded at the expense of the physiological activity state. The same perturbation that failed to trigger a seizure in the nonepileptic brain suffices to trigger a seizure.


