

Article Figures & Data
Figures
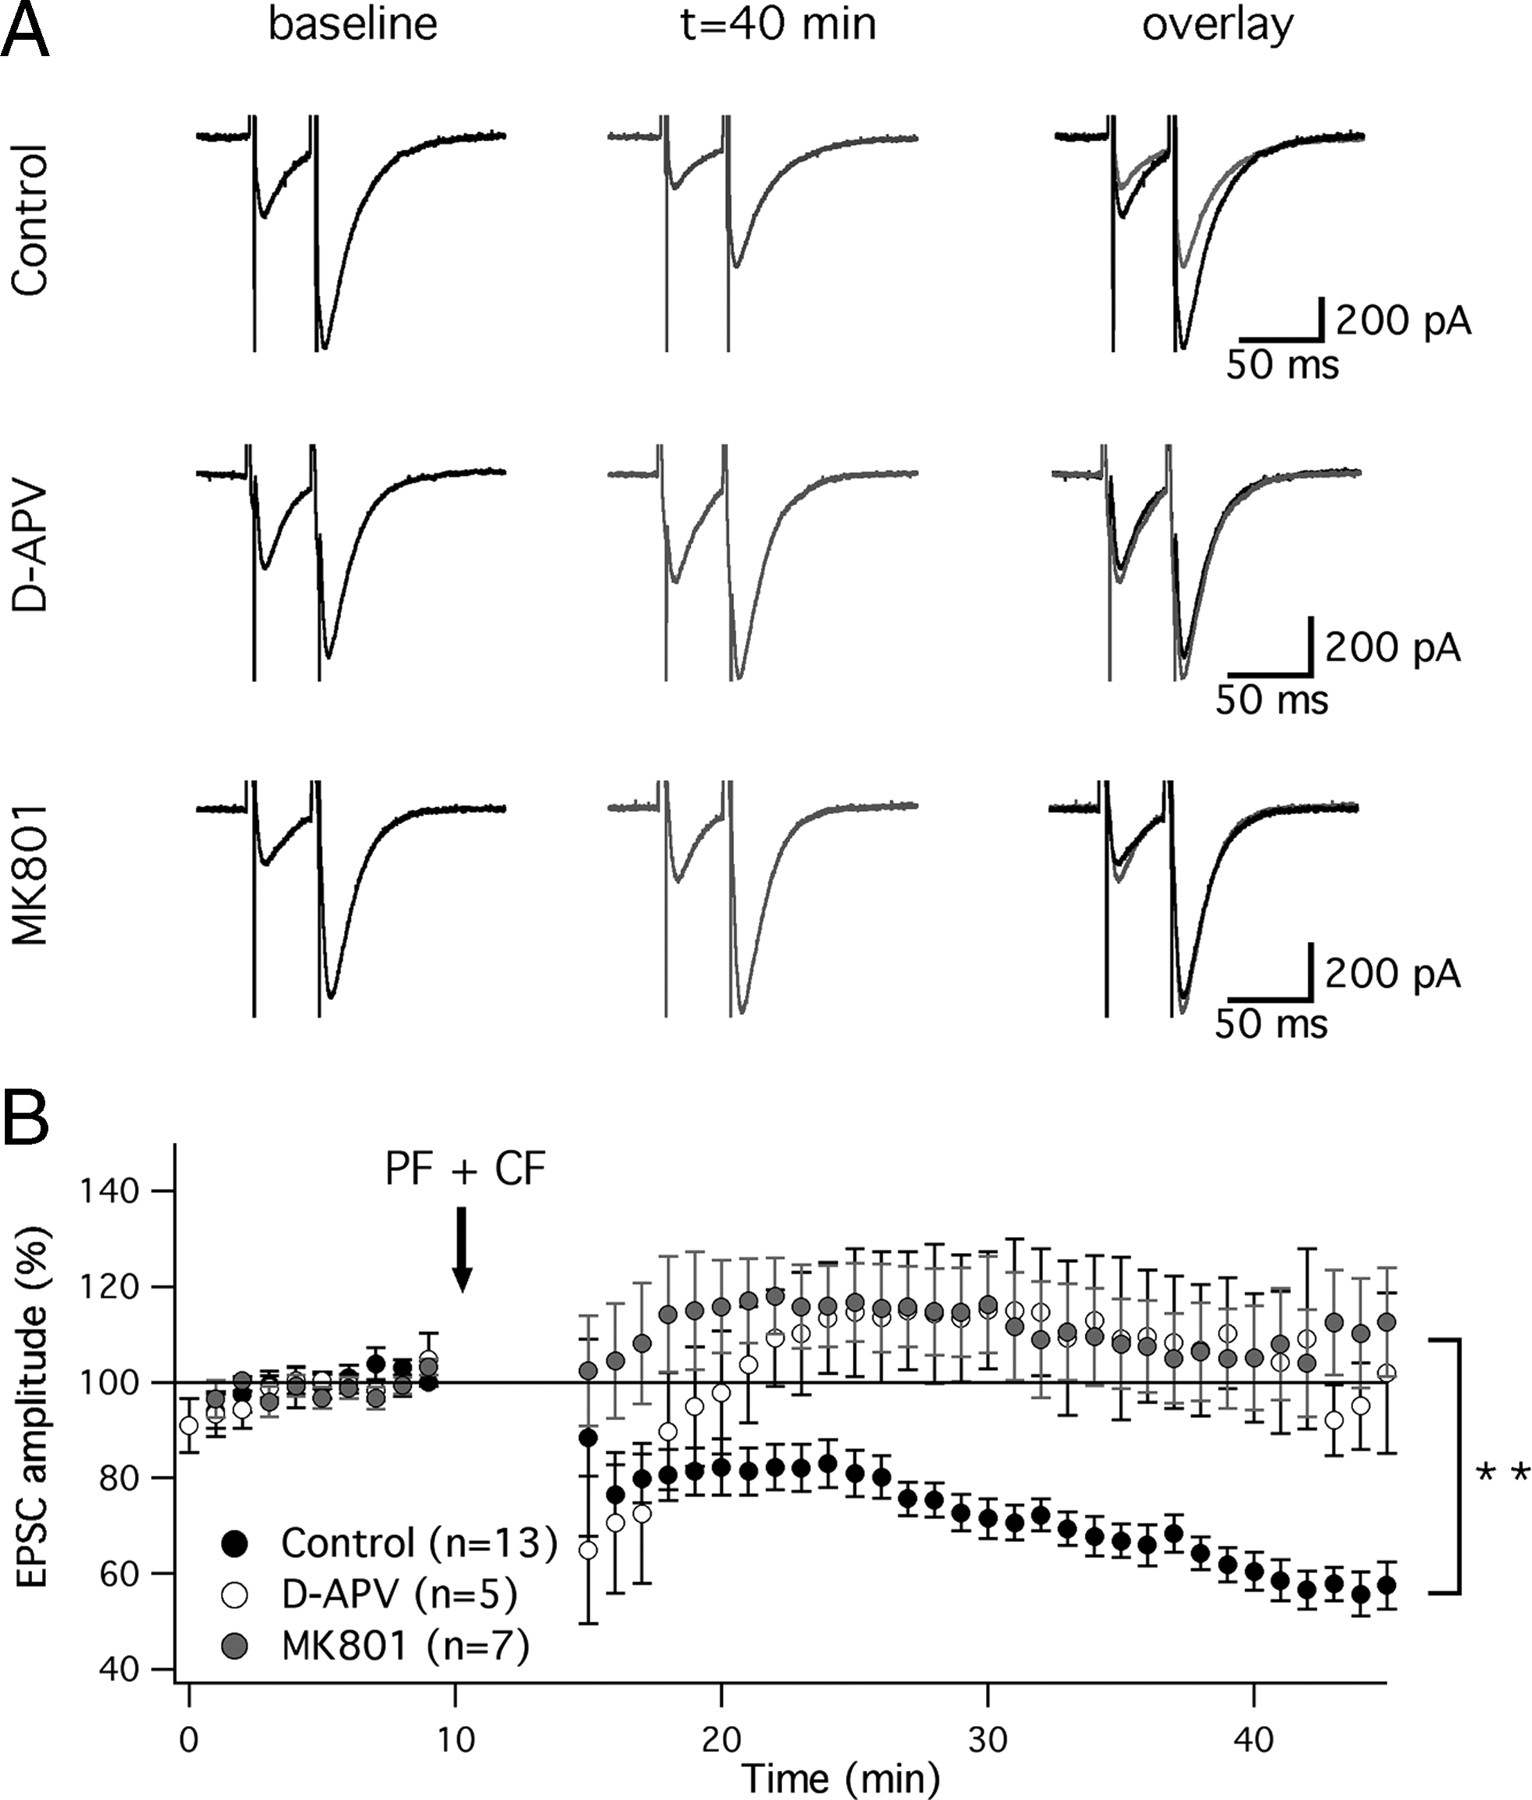
- Figure 1.
PF-LTD depends on the activation of NMDA receptors. A, Typical traces. PF-LTD is observed under control conditions (top), but is blocked in the presence of D-APV (50 μm; middle) and MK-801 (1 mm; bottom), respectively. B, Time graph showing LTD under control conditions (n = 13), and LTD blockade in the presence of D-APV (n = 5) and MK-801 (n = 7). The arrow indicates the time point of tetanization. Asterisks indicate significant differences between the control and the D-APV/MK-801 groups (**p < 0.01, Mann–Whitney U test). Error bars are mean ± SEM.
- Figure 2.
PF-LTP is NMDA receptor-independent. A, Typical traces. PF-LTP as recorded under control conditions (top) remains unchanged in the presence of D-APV (middle) and MK-801 (bottom), respectively. B, Time graph showing LTP under control conditions (n = 6) and in the presence of D-APV (n = 5) and MK-801 (n = 7). The arrow indicates the time point of tetanization. Error bars are mean ± SEM.
- Figure 3.
NMDA receptors contribute to CF-evoked spine calcium signaling. A, Confocal image of a 2.5 month-old mouse Purkinje cell filled with Oregon Green BAPTA-2 (200 μm). B, Area enlarged from the red box shown in A. The circle indicates the spine region of interest. Scale bars: A, 20 μm; B, 2 μm. C, Left, CF-evoked calcium transients (averages of 5 traces) recorded from the dendritic spine shown in B before and during application of D-APV (50 μm). Right, Corresponding complex spikes recorded from the soma. D, Bar graphs showing D-APV effects on the peak amplitude and area under the curve of the spine calcium transients (n = 9; control: n = 5; *p < 0.05; Mann–Whitney U test). Error bars are mean ± SEM.
- Figure 4.
Somatodendritic patch-clamp recordings from rat Purkinje cells reveal an NMDA component in the CF response. A, DIC image showing the typical electrode arrangement used for double-patch recordings. The arrowheads outline the course of the dendrite. Scale bar, 40 μm. B, Dendritically recorded CF responses (top) and somatically recorded complex spikes (bottom) before and during bath application of D-APV (50 μm). C, Bar graph summarizing D-APV effects on the peak amplitude of the CF response and the ADP, as well as the complex spike area (n = 6; control: n = 7; **p < 0.01; *p < 0.05; Mann–Whitney U test). Error bars are mean ± SEM. D, Example of a complex spike recording, in which D-APV application caused a reduction in the number of spikelets (arrow).


Additional Files
Supplemental Material
Files in this Data Supplement:
- supplemental material - Supplemental Figures


