

Article Figures & Data
Figures
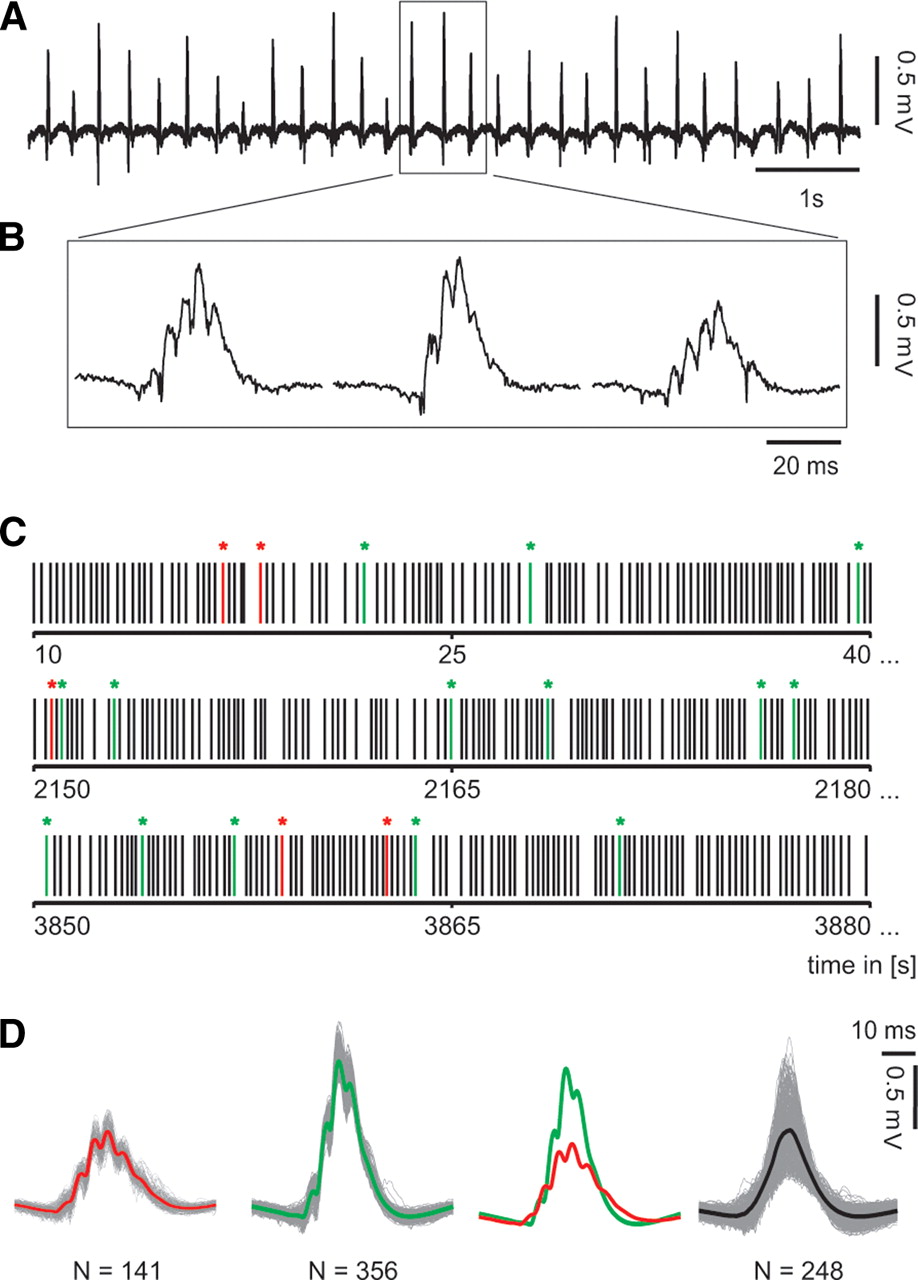
- Figure 1.
Spontaneous hippocampal SPW-R oscillations have distinct waveforms and can be sorted. A, Local field potential of SPW-R recorded in CA1 stratum pyramidale. B, Extended view of three consecutive SPW-R complexes demonstrating the heterogeneity of SPW-R waveform shapes. C, Certain SPW-R waveforms occur repeatedly over time. Visual inspection of time intervals from the beginning (first row), within (second row), and the end of the measurement (third row) reveals the reoccurrence of distinct SPW-R waveforms. D, These waveforms can be sorted according to their electrographic characteristics. Averaged waveforms show a congruent appearance compared with the same amount of averaged randomly chosen SPW-Rs.
- Figure 2.
Unit discharges in CA1 show preferences to certain SPW-R waveforms. A, Local field potential samples of SPW-R (top traces) and high-pass-filtered tetrode recordings (four bottom traces). The red ticks and highlighted data traces indicate the firing of one putative pyramidal neuron. B, Autocorrelation (top panel), coupling precision to the ripple cycle (middle panel), event cross-correlation and ripple troughs (bottom panel) for the unit shown in A. Note high precision of coupling to field ripples. C, Unit discharges (right panel, colored ticks) during the occurrence of two distinct SPW-R waveforms (left panel). The gray unit ticks indicate times when the unit was active during other SPW-R shapes. Note the specificity of units to different SPW-R waveforms.
- Figure 3.
Unit discharges in CA1 show preferences to certain SPW-R waveforms. A, SPW-R hit map (left) and unit hit map (right) for the unit shown in A and B. This unit discharges only on specific SPW-R waveforms, belonging to a distinct area of the SPW-R hit map. B, Information (top panel) and sparsity (bottom panel) for the unit shown in A and B reveal a significant difference between measured values and a random distribution based on unit firing frequency. C, Specificity of 283 SPW-R coupled units shows significant differences between measured and random values for information (top panel) and sparsity (bottom panel) revealing a specific coupling of units to certain SPW-R waveforms. D, Units in CA1 form multicellular activity patterns and show coupled discharge during SPW-R. Fourteen percent (n = 65) of all unit pairings (n = 461) show coincidences that are significantly different form the value expected from their individual firing rates (red plus signs, p < 0.05, Fisher's exact test with Bonferroni's correction); *p < 0.05.
- Figure 4.
Weak electrical stimuli in CA3 activate specific patterns in CA1. A, Activation of distinct neuronal subpopulations in CA3 activates different upstream neuronal cells resulting in different SPW-R waveforms. B, Comparison between spontaneous and evoked SPW-Rs reveals no difference in waveform and frequency components (for details, see supplemental Fig. S9, available at www.jneurosci.org as supplemental material). C, Weak activation of CA3 cells at 300 ms after a strong stimulation. Evoked SPW-Rs are confined to few, strongly connected areas within the SOM (left panel) created of spontaneous and evoked events. Furthermore, evoked SPW-Rs show clearly distinct, but reproducible stable waveforms at two different stimulation locations (middle). On a SPW-R hit map generated from spontaneous events (right panel), these elicited SPW-R events are homogenously distributed. D, The variance of evoked SPW-R events is significantly smaller than the variance of all SPW-Rs, indicating a specific interaction between stimulated cells in CA3 and resulting activated cells in CA1; *p < 0.05.
- Figure 5.
Modulation of SPW-R waveforms during propagation along CA1. A, Measuring field potentials at distant positions in CA1 allows analyzing the propagation of sharp waves along CA1. A given SPW-R waveform at tetrode position 1 is followed by well defined waveform patterns at tetrode 2. B, Left panel, Two different classes of SPW-Rs that were recorded at position lfp1 shown in A. The gray traces are the raw data of all events, the red traces are the means, and the hit maps show corresponding best matching SOM units. Right panel, Raw traces (gray), mean waveforms (red), and hit maps of all corresponding events at position lfp2. Note the sparse distribution of events in the downstream hit map indicating a strong correlation between waveforms at lfp1 and lfp2, but also some processing of SPW-Rs during propagation. C, Information and sparsity of the concurrent SPW-R distribution at tetrode 2 are significantly different from randomly chosen SPW-R; *p < 0.05.
- Figure 6.
SPW-R waveforms are stable over time and their number is limited. A, The whole data set was split into shorter segments that underwent SOM classification. Distance between resulting partial SPW-R maps and the whole data map is depicted (right) and was taken to assess waveform stability. B, Distance between partial SPW-R maps depends on sample size. For each length of partial data set, however, distance between partial data maps and whole data map is stable over time. C, Relationship between partial data map size and mean distance to whole data map. The sudden deviation from the logarithmic correlation at low partial data map sizes (<500) indicates incomplete representation of SPW-R waveforms.


Additional Files
Supplemental Material
Files in this Data Supplement:
- supplemental material - Supplemental Material


