

Article Figures & Data
Figures
- Figure 1.
Strong increase in quantal content but little change in paired-pulse ratio during presynaptic compensation. A, Example traces of mEPSCs recorded by TEVC in controls (black) and GluRIIB animals (gray). Asterisks above the current trace indicate detected mEPSCs. Calibration: 100 ms, 2 nA. B, Mean mEPSC amplitude in controls (black) and GluRIIB (gray; the number of experiments, n, is indicated throughout). C, Representative traces of EPSCs evoked by stimulating the motor nerve (eEPSCs). Stimulation artifacts are blanked for clarity. Calibration: 10 ms, 20 nA. D, Mean amplitudes, rise time (10–90%), decay time constants, and quantal content of eEPSCs in controls (black) and GluRIIB animals (gray). E, Representative traces of eEPSCs of conA-treated (10 μm) controls (black) and conA-treated GluRIIB animals (gray). Calibration: 10 ms, 20 nA. F, Mean mEPSC amplitude, eEPSC amplitude, and quantal content in conA-treated GluRIIB animals (gray) and conA-treated controls (black). G, PPR versus interstimulus interval at three different extracellular Ca2+ concentrations (as indicated) for control (black) and GluRIIB animals (gray) superimposed with corresponding exponential fits (left, n = 5 and 4; middle, n = 6 and 8; right, n = 6 and 6, respectively). Insets (top), Example traces of a 30 ms interstimulus interval for control (black) and GluRIIB animals (gray). Calibration: 5, 20, and 60 nA from left to right and 20 ms. Inset (bottom), Illustration of the method for determining the amplitude (vertical gray lines) of the first and second EPSC for short interstimulus intervals (10 ms interstimulus); dashed horizontal line, baseline; solid gray line, exponential decay of the first EPSC; white line, fit to the measured EPSCs (see Eqs. 1, 2).
- Figure 2.
Increased number of release-ready vesicles during presynaptic strengthening. A, Amplitudes of eEPSCs of a control example elicited at 0.2 Hz at the indicated extracellular Ca2+ concentrations. The brackets indicate regions used for subsequent analysis. B, EPSC mean amplitudes normalized to the amplitude at 1 mm Ca2+ plotted versus external Ca2+ concentration for control (black) and GluRIIB (gray) animals fitted with a Hill function according to Inorm([Ca2+]) = Inorm_max[1 + (EC50/[Ca2+])slope]−1, which yielded Inorm_max = 3.9 and 2.7, EC50 = 1.5 and 1.2 mm, and slope = 2.2 and 3.1 for controls and GluRIIB animals, respectively. The number of experiments for each concentration is indicated. C, Examples of variance–mean plots with parabolic fits in control (black) and GluRIIB (gray). D, Mean quantal parameters vesicular release probability (pvr) at 1 mm Ca2+, number of release-ready vesicles (N), and quantal size (q) estimated from fluctuation analysis in control (black) and GluRIIB (gray); the mean coefficient of variation of q (CVq) was determined from mEPSC amplitudes. E, Mean EPSC amplitudes during and at increasing intervals after high-frequency stimulation (60 Hz, 100 pulses) for control (black; n = 10) and GluRIIB (gray; n = 10) animals. Note the logarithmic timescale after the train (broken abscissa). Inset, Example current trace of the first 15 s of a control experiment. Calibration: 1 s, 30 nA. Error bars indicate SEM. F, Average cumulative quantal content in control (black; n = 9) and GluRIIB (gray; n = 10) animals for the first 500 ms of the experiments shown in E. Back-extrapolation of linear fits to the average cumulative quantal content at 300–500 ms (straight lines) yielded estimates for the readily releasable pool of 379 vesicles for control and 963 vesicles for GluRIIB animals. Top inset, Quantal content during the first 500 ms of the 60 Hz stimulus train in control (black) and GluRIIB (gray) animals. Bottom inset, Average release-ready vesicle estimates from back-extrapolation of the cumulative quantal content of single experiments in control (black) and GluRIIB (gray) animals (p = 0.001).
- Figure 3.
Quantal size is overestimated by mEPSC recordings. A, Example traces of mEPSCs recorded under conditions optimized for low noise. Calibration: 100 ms, 2 nA. Right, Noise level (SD) for standard control and GluRIIB and for low-noise mGluRIIB recordings. Calibration: 100 ms, 2 nA. B, mEPSC amplitude histograms and cumulative distribution of control (black), GluRIIB (filled gray), and GluRIIB low noise recordings (blue; Kolmogorov–Smirnov test, p < 0.001). C, Mean measured mEPSC amplitude and frequency in controls (black), GluRIIB (gray,) and GluRIIB low noise (blue). D, To reconcile the estimated quantal size q from fluctuation analysis (Fig. 2D) and from mEPSC amplitudes (Fig. 1B), a distribution of mEPSC amplitudes was adopted from Bekkers et al. (1990) (see Materials and Methods). Measured mEPSC distributions (B) are superimposed with these estimated distributions (thin lines) for control (black) and GluRIIB (dashed gray and blue). E, Left, The means of the estimated distributions (constrained to values obtained for q in fluctuation analysis). Right, Assumed frequencies for the distributions estimated from the measured frequency in control and the fraction of detected events. F, Estimated distributions as in D. Vertical lines indicate thresholds for detecting mEPSCs at average noise (black and gray lines) and low noise measurements (blue line). The detected fraction of the distribution is outlined by thick lines in the distribution for control (black) and GluRIIB low noise measurements (blue) and filled for GluRIIB (gray). G, Expected means and frequencies of detected mEPSCs, assuming that mEPSCs above the threshold level indicated in F would have been detected.
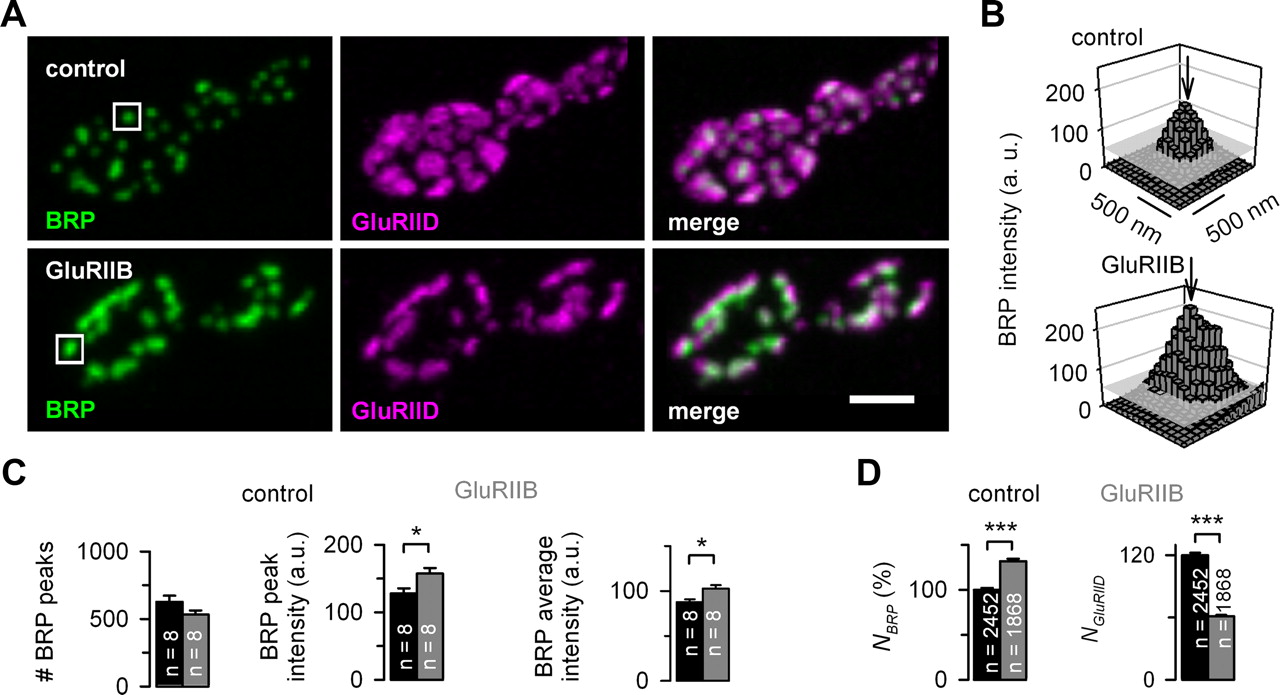
- Figure 4.
Increased amount of Bruchpilot during presynaptic strengthening. A, Examples of maximum projections of confocal Z-stacks of control (top) and GluRIIB (bottom) NMJs stained with Nc82 antibodies against the AZ protein BRP (green, left) and the postsynaptic GluRIID (magenta, middle) and merge of both (right). Scale bar, 5 μm. B, BRP intensity in arbitrary units of the areas indicated by the white boxes in A for control (top) and GluRIIB (bottom). The gray plane shows the threshold level (50 a.u.) used to isolate single BRP spots. Arrows indicate the estimated BRP peaks. C, Number of BRP peaks (left), mean intensity of the BRP peaks (middle), and mean BRP pixel intensity within BRP spots (right) in control (black) and GluRIIB animals (gray; n = 8 NMJs from 8 different animals each). D, Quantification of BRP and GluRIID amount at individual synapses in GluRIIB animals (gray; n = 1868 synapses from 5 NMJs and 3 animals) and controls (black; n = 2452 from 5 NMJs and 3 animals), calculated by integrating the fluorescence intensity over the synapse area: BRP amounts are displayed in percentage of the average amount in control synapses; the number of postsynaptic receptors (NGluRIID) was estimated assuming an average of 120 receptors at control postsynapses (Schmid et al., 2008).
- Figure 5.
STED analysis reveals increased BRP ring diameter during presynaptic strengthening. A, STED images of a bouton of a control (top) and a GluRIIB animal (bottom) stained with Nc82 antibodies. Note the ring-shaped BRP structures. Scale bar, 1 μm. B, Average ring frequency in GluRIIB animals (gray; n = 7 NMJs from 5 animals) and controls (black; n = 10 NMJs from 5 animals). C, The area of the BRP rings is increased in GluRIIB animals (gray; n = 1004 rings and from 7 NMJs and 5 animals) compared with control animals (black; n = 1280 rings from 10 NMJs and 5 animals). D, Intensity profile of the line in A. The ring diameter was quantified as the distance of the intensity peaks of a line profile through the center of the ring as illustrated by the brackets. E, The average ring diameter is increased in GluRIIB (gray; n = 93 rings from 5 NMJs and 5 animals) compared with control (black; n = 139 rings from 5 NMJs and 5 animals).
- Figure 6.
Increased number of release-ready vesicles during rapid presynaptic strengthening. A, Illustration of acute PhTx application and 10 min PhTx pretreatment experiments. Left (acute), Example of an experiment in which PhTx was bath applied during TEVC recordings at t = 0. The inset illustrates the recording condition in a larval preparation. eEPSC and mEPSC example traces before and 1 min after bath application of PhTx are shown below. Right (10 min), Semi-intact preparations of larvae were incubated for 10 min in either normal extracellular solution or 10 μm PhTx. Afterward, the preparation was completed and mEPSC and eEPSC amplitudes were measured without PhTx in the extracellular solution. The insets illustrate the PhTx application to the semi-intact larva and the TEVC recording in the complete preparation. Example eEPSCs and mEPSCs after 10 min of semi-intact incubation in controls and PhTx-treated animals are shown below. Calibration: 20 nA, 10 ms for eEPSCs; 2 nA, 30 ms for mEPSCs. Note the normal eEPSC but reduced mEPSC amplitudes after 10 min of PhTx treatment. B, mEPSC amplitude, eEPSC amplitude, and quantal content in percent of the corresponding control treatment (white and gray for acute and 10 min PhTx-treatment, respectively). The number of animals of the corresponding controls are indicated. C, Mean paired-pulse ratios versus interstimulus intervals fitted with a monoexponential function at 1 mm extracellular Ca2+ (left; n = 14 and n = 7) and at 3 mm Ca2+ (right; n = 6 and n = 4) for control (black) and PhTx (gray), respectively. Inset, Example traces at 30 ms interstimulus interval. Calibration: left, 20 nA; right: 60 nA, 20 ms. D, eEPSC amplitudes during and after high-frequency stimulation (100 pulses at 60 Hz) in control (black; n = 5) and PhTx-treated (gray; n = 5) animals. Note the logarithmic timescale after the train (broken abscissa). E, Average cumulative quantal content in control and PhTx-treated larvae (black and gray, respectively) during the first 500 ms of the 60 Hz train shown in D; back-extrapolation of linear fits to the average cumulative quantal content at 300–500 ms (straight lines) yielded estimates of 346 and 1012 release-ready vesicles for control and PhTx, respectively. Top inset, Quantal content during the first 500 ms in the 60 Hz stimulus train in control (black) and PhTx-treated (gray) animals. Bottom inset, Average release-ready vesicle estimates from back-extrapolation of the cumulative quantal content of single experiments in control (black) and PhTx-treated (gray) animals (p = 0.03).
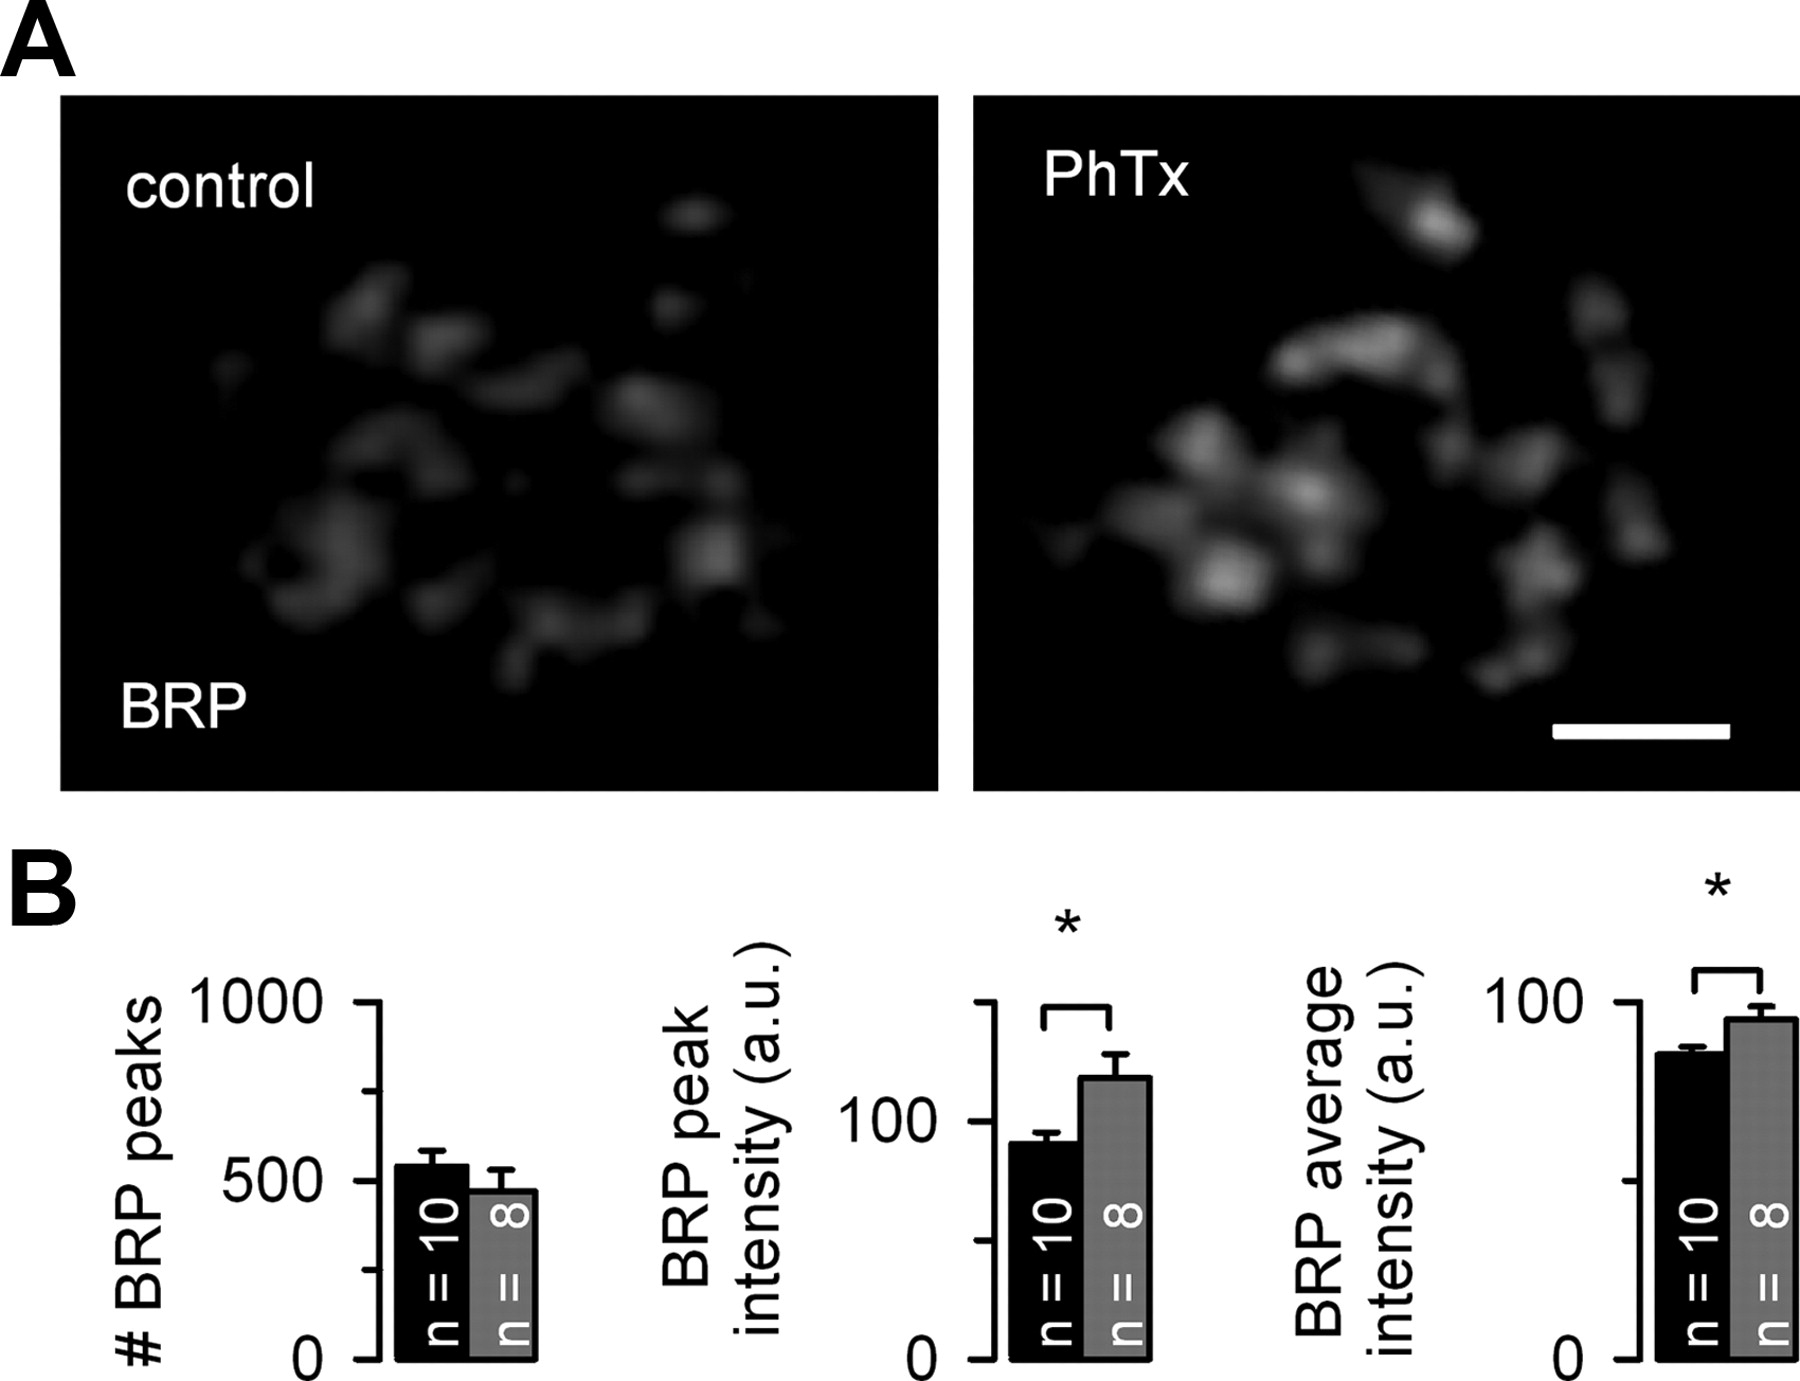
- Figure 7.
Increased amount of BRP during rapid presynaptic strengthening. A, Examples of maximum projections of confocal Z-stacks of control (left) and PhTx (right) NMJs stained with Nc82 antibodies against BRP. Scale bar, 1 μm. B, Number of BRP peaks (left), mean intensity of the BRP peaks (middle), and mean BRP pixel intensity within BRP spots (right) in control (black; n = 10 NMJs from 5 animals) and PhTx-treated (gray; n = 8 NMJs from 4 animals) animals.
- Figure 8.
Quantal short-term plasticity models confirm increased number of release-ready vesicles during presynaptic strengthening. A, Illustration of short-term plasticity models. B, Average EPSC amplitudes during and after the 60 Hz train in control (black) and GluRIIB (gray) animals superimposed with the predictions from model 1 (green) and model 2 (red). C, Corresponding illustration of model predictions for PhTx-treated animals and their controls. D, Average paired-pulse ratios at three different Ca2+ concentrations for control and GluRIIB animals superimposed with the model predictions (color codes as in B). E, Corresponding paired-pulse experiments in the indicated Ca2+ concentrations in PhTx-treated animals and their controls superimposed on the model predictions (color codes as in C). F, Estimates of the parameters pvr and N obtained by fitting single 60 Hz experiments with model 1 (left) and model 2 (right) for control (black) and GluRIIB (gray) animals. For model 2, N refers to N1 + N2 and pvr to the average release probability (pvr1N1 + pvr2N2)/(N1 + N2). G, The same data as in F for PhTx-treated animals (gray) and controls (black). H, Illustration of the hypothesized mechanism of presynaptic compensation. During lifelong and rapid presynaptic strengthening in GluRIIB and PhTx-treated animals, respectively, additional BRP molecules are recruited to the AZ, leading to a larger cytomatrix, more Ca2+ channels, and more release-ready vesicles.


