

Article Figures & Data
Figures
- Figure 1.
Adult-born DGCs in the septal and temporal hippocampus. Differences in morphology match local network activity. A, Schematic view of the mouse brain depicting the three-dimensional anatomy of the hippocampus and two coronal planes, examples of the septal (1) and temporal (2) areas analyzed in this work. B, Retrovirally labeled neurons at 21 dpi. Typical examples of newborn DGCs in the septal (1) and temporal (2) dentate gyrus of the same mouse, with the planes oriented as shown in A. Note that GFP+ neurons (green) in the septal section display more elaborated dendritic trees spreading the entire molecular layer, whereas those in the temporal section appear more immature. DAPI nuclear labeling is shown in blue. C, Representative images of Arc expression (red) in the septal (left panel) and temporal (right panel) dentate gyrus of the same mouse. ML, Molecular layer; GCL, granule cell layer; H, hilus. NeuN immunofluorescence is shown in blue. Inset, Higher magnification of a DGC expressing Arc, pointed by the arrow. Shown is a single plane overlay of Arc and NeuN labeling. D, Quantitative analysis of the total dendritic length of newborn DGCs at 21 dpi septal and temporal hippocampus after two-photon imaging of 400-μm-thick coronal sections. **p < 0.0015, Mann–Whitney test. The bars represent mean ± SEM with n = 7 septal neurons obtained from three mice and n = 12 temporal neurons from two mice. E, Arc expression in the GCL analyzed by pairing septal and temporal sections, where each pair of dots joined by a line represents data obtained from the same mice. **p = 0.002, Wilcoxon's test; n = 10 sedentary mice. Scale bars: 100 μm; inset, 10 μm.
- Figure 2.
Three-week-old neurons achieve distinct degrees of maturation that depend on their septotemporal localization. A, B, Examples of retrovirally labeled newborn DGCs expressing NeuN but not DCX in a septal section (A) and neurons expressing DCX in a temporal section of the same brain (B). Images display single optical sections of GFP (green), DCX (red), and NeuN (blue) channels shown separately. Their overlays and orthogonal projections are shown on the right top panel of each example. Scale bars, 10 μm. Note that neurons lacking DCX exhibited stronger NeuN expression, suggesting a more advanced degree of maturation in the septal region. C, Proportion of GFP+ neurons expressing DCX (DCX+). All DCX− neurons expressed NeuN. The bars denote mean ± SEM (n = 7 mice, with 191 GFP+ neurons in the septal region and 174 GFP+ neurons in the temporal region; p = 0.004, Mann–Whitney test, DCX septal vs temporal). D, Proportion of BrdU+ neurons expressing DCX. The colored bars show mean ± SEM obtained from five mice with n = 85 neurons (septal region) and n = 122 neurons (temporal region; p = 0.008, Mann–Whitney test). E, Representative traces of whole-cell current-clamp recordings in septal (top) and temporal (bottom) GFP+ neurons. Spiking was elicited by depolarizing current steps of increasing amplitude (step, 5 pA). Each panel shows a subset of four representative traces elicited by 10, 30, 50, and 70 pA steps (from bottom to top). Calibration: 100 mV, 50 ms. F, Number of action potentials elicited by injected current steps (Vresting kept at −70 mV). Data depict mean ± SEM, with n = 15 (septal) and 14 (temporal) new DGCs. G, Voltage-clamp recordings of sEPSCs recorded at −70 mV in presence of 100 μm picrotoxin. Traces correspond to six different 21 dpi neurons located in the septal (left) and temporal regions of the dentate gyrus (right). Calibration: 5 pA, 2 s. H, Septal neurons exhibit higher sEPSC frequency. *p = 0.032 for t test, with n = 14 (septal) and 12 (temporal) GFP+ DGCs. I, Cumulative histogram displaying similar sEPSC amplitudes for the recordings analyzed in H.
- Figure 3.
Neural progenitor cells of the septal and temporal hippocampus display similar timing to exit the cell cycle. A, Overview of the GCL of the septal dentate gyrus labeled with NeuN (blue) depicting subgranular labeling for BrdU (green) and the cell cycle marker Ki67 (red), shown 4 d after BrdU injection. Note the clusters of cells that continue to divide (yellow, double BrdU and Ki67 labeling). Scale bar, 50 μm. Inset, Orthogonal projection of the cell pointed by the arrow, displaying double BrdU and Ki67 labeling. B, Proportion of BrdU+ cells labeled with Ki67. No significant differences were found for septal versus temporal areas (p > 0.05, two-way ANOVA). The bars represent mean ± SEM, with n = 5 mice at each time point (>500 BrdU+ cells for each region and at each time point).
- Figure 4.
Slow rate of maturation for adult-born DGCs in the temporal dentate gyrus. A–D, Representative confocal images of newly generated DGCs in the septal and temporal dentate gyrus obtained at 21 and 56 dpi. GFP+ neurons (white) are shown in a DAPI (blue) background labeling the GCL. Scale bar, 50 μm. Note that the striking septotemporal differences seen at 21 dpi are no longer found at 56 dpi. E, F, Example dendritic segments obtained from septal and temporal newborn cells of the same mice, at the indicated times. Scale bar, 2 μm. Note the presence of dendritic varicosities (arrow) and the dendrite end in the middle molecular layer (arrowhead) found in the temporal region at 21 dpi, typical features of an immature neuron. G, Dendritic spine counts reveal low density in temporal DGCs at 21 dpi. n = 58 total fragments (septal plus temporal) taken from five mice at 21 dpi, and 26 fragments from three mice at 56 dpi. ***p < 0.001, ANOVA with Bonferroni's post hoc test. H, I, Example of 21 dpi neurons (green) obtained from the same mouse depicting a Cb+ (red) and NeuN+ (blue) expression in the septal dentate gyrus (H) and a Cb− with weak NeuN expression in the temporal region (I). Images show single optical sections for each channel and their overlay. Scale bar, 10 μm. J, Cb expression in developing DGCs. n = 4 mice and 257 neurons (14 dpi), 8 mice and 444 neurons (21 dpi), 5 mice and 279 neurons (28 dpi), 4 mice and 183 neurons (56 dpi). ***p < 0.001, ANOVA with Bonferroni's post hoc test. K, Input resistance in GFP+ neurons recorded in whole cell as a function of age in the septal and temporal dentate gyrus. **p < 0.01, two-way ANOVA followed by Bonferroni's post hoc test. All bars represent mean ± SEM.
- Figure 5.
Running increases network activity in the temporal GCL and accelerates neuronal maturation. A, Representative images of Arc expression (red) in the septal and temporal dentate gyrus of running mice. NeuN immunofluorescence is shown in blue. Note the similar level of Arc expression (red) in the septal and temporal GCL. Scale bar, 100 μm. B, Paired analysis of Arc expression in sections obtained from the same running mice. No significant differences were found (p = 0.73, Wilcoxon's test; n = 9). C, Running increases Arc expression in the temporal GCL. The bars combine the data shown in Figures 1E and 5B. **p < 0.01, Kruskal–Wallis followed by post hoc Conover's test. D, Examples of newborn DGCs (white) at 21 dpi in the septal and temporal dentate gyrus of the same running mouse. Note the similar degree of maturation in both regions. Sections were counterstained with DAPI (blue). Scale bar, 50 μm. E, Dendritic segments of 21 dpi neurons from the septal and temporal dentate gyrus in sedentary and running mice, as indicated. Scale bar, 2 μm. F, Running increases spine density in newborn DGCs of the temporal dentate gyrus. Spine count analysis in 21 dpi neurons, with n = 45 total (septal plus temporal) fragments taken from four running mice. Data for sedentary mice are the same as that shown in Figure 4G. **p < 0.01, ANOVA with Bonferroni's post hoc test. G, Newborn DGCs (green) at 21 dpi in the temporal dentate gyrus of a running mouse expressing both Cb (red) and NeuN (blue). Images are single optical planes for each channel and their overlay. Scale bar, 10 μm. H, Running increases Cb expression in 21 dpi neurons of the temporal hippocampus. The bars show the proportion of GFP+ cells that display Cb expression, with n = 462 neurons from eight running mice compared with data shown in Figure 4J for sedentary mice. ***p < 0.001, two-way ANOVA with Bonferroni's post hoc test. All bars denote mean ± SEM.
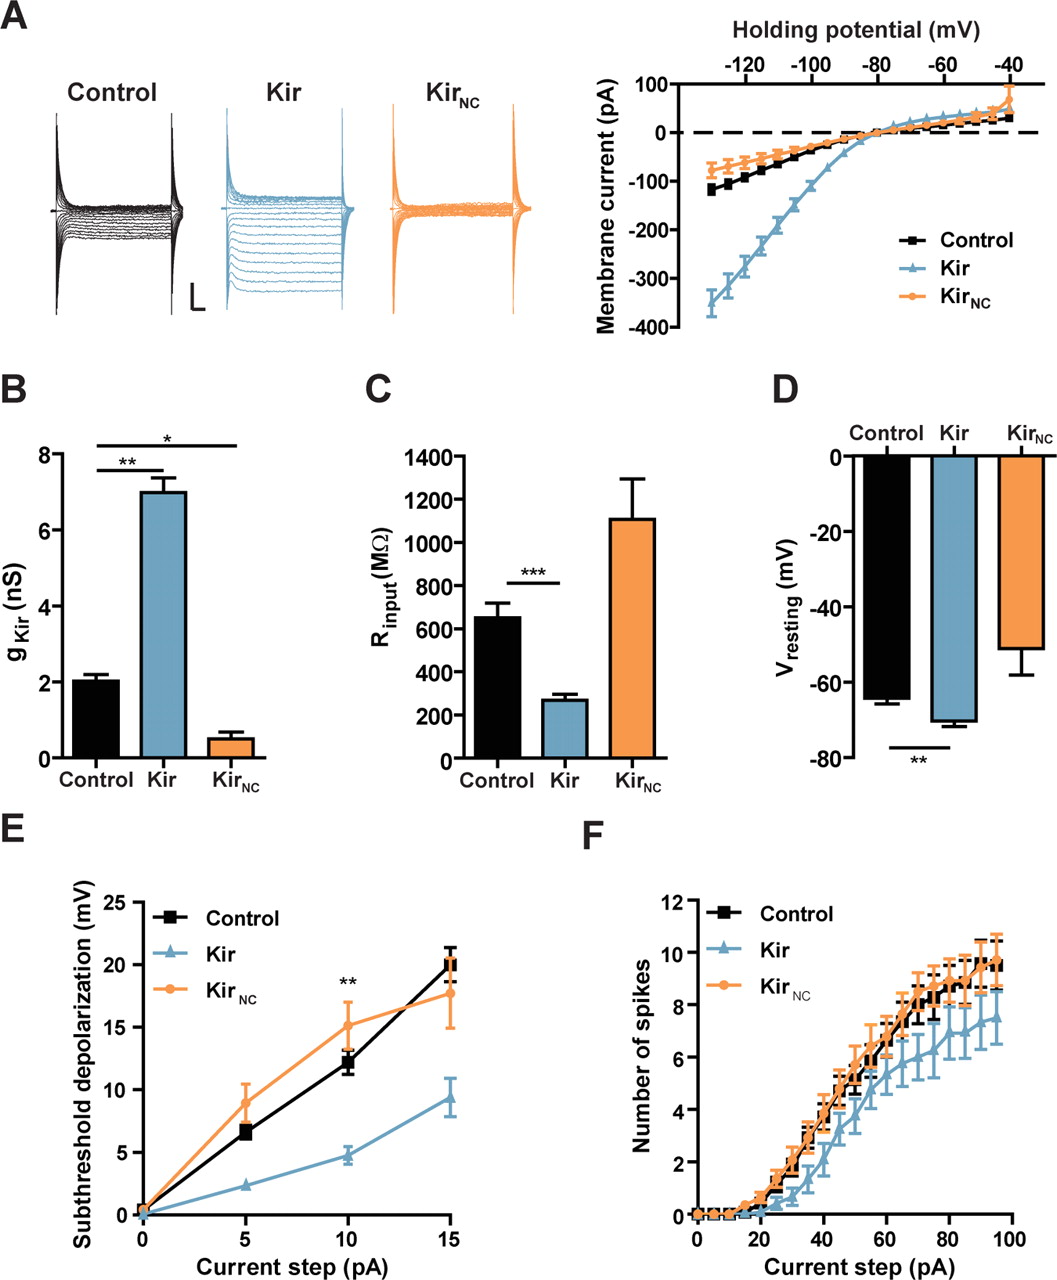
- Figure 6.
Overexpression of Kir2.1 reduces the excitability of developing DGCs at 21 dpi. A, Left panels, Whole-cell recordings of inward-rectifying currents evoked by voltage steps (5 mV, 100 ms) from −40 to −130 mV in DGCs expressing GFP alone (control), Kir2.1, or the nonconductive mutant KirNC. Holding potential, −80 mV. Calibration: 100 pA, 10 ms. Right panel, Average I–V plots obtained from n = 12 (control), 12 (Kir), and 16 (KirNC) neurons. B, Average inward-rectifying conductance (gKir) calculated from data shown in A. *p < 0.05 and **p < 0.01 analyzed with Kruskal–Wallis statistics followed by Dunn's multiple-comparison test. C, D, Input resistance and resting potential measurements, with n = 22 (control), 29 (Kir), and 17 neurons (KirNC). **p < 0.001 and ***p < 0.0001, Kruskal–Wallis followed by Dunn's. E, Current-clamp analysis of subthreshold membrane depolarization (Vresting kept at −80 mV) in response to injected current steps; n = 19 (control), 14 (Kir), and 14 neurons (KirNC). Data were transformed to reach normality using a natural log function. **p < 0.01 by two-way ANOVA with Bonferroni's post hoc test. F, Suprathreshold responses displaying the number of spikes elicited by depolarizing current steps (5 pA, 400 ms), with n = 14 (control), 12 (Kir), and 14 neurons (KirNC). All data represent mean ± SEM obtained from three to four mice in each condition.
- Figure 7.
Reduction of intrinsic excitability delays maturation of newborn granule cells in running mice. A, Prolonged DCX expression in newborn DGCs expressing Kir. Each bar represents data obtained counting a total of 120–350 neurons from n = 3–5 mice. *p < 0.05. B, Delayed onset of Cb expression in adult-born DGCs expressing Kir. *p < 0.05. Each bar represents data obtained counting a total of 64–250 neurons from n = 3–5 mice. Inset, Cb expression at 21 dpi including the comparison with new DGCs expressing the mutant nonconductive KirNC. **p < 0.01. C, D, Three-week-old neurons expressing the fluorescent reporter alone (RFP, red) or coinfected with Kir tagged with GFP (green). DAPI (blue) was used to label the GCL. Scale bars, 50 μm. Inset, Single confocal planes of the separate red and green channels for the coinfected neuron pointed by the arrow. E, Quantitative analysis of the total dendritic length of newborn DGCs at the indicated times. ***p < 0.001 with control, n = 14–20 neurons obtained from five to eight mice. Bars denote mean ± SEM. All statistical comparisons were assessed by two-way ANOVA followed by Bonferroni's post hoc test.
- Figure 8.
Kir2.1 overexpression impairs functional connectivity of newborn DGCs in running mice. A, Analysis of mEPSCs for 21 dpi neurons. Left panels show example voltage-clamp whole-cell recordings obtained from a GFP-expressing neuron (control, black) and a Kir-overexpressing neuron (blue). Right panels depict quantitative analysis of mEPSC amplitude and frequency; n = 8 (control) and n = 14 (Kir). *p = 0.025 (21 dpi, amplitude) and p = 0.012 (frequency), t tests. Calibration: 5 pA, 1 s. B, Analysis of mEPSCs for 35 dpi neurons, with n = 14 for both control and Kir neurons. **p = 0.0094, Mann–Whitney test. Calibration: 5 pA, 1 s. C, Analysis of mIPSCs for 35 dpi neurons, with n = 12 (control) and n = 8 (Kir). **p = 0.0018, Mann–Whitney test. Calibration: 20 pA, 1 s. D, Voltage-clamp measurements of membrane capacitance (Cm) for 21 and 35 dpi neurons expressing GFP alone (control), Kir2.1 (Kir), and a nonconductive mutant version of Kir (KirNC). A significant reduction of Cm was induced by Kir but not KirNC at both time points. Data for 35 dpi were transformed to reach normality using a natural log function. **p < 0.01 and ***p < 0.001 by ANOVA with Bonferroni's post hoc test, with n = 41 (21 dpi, control), 41 (21 dpi, Kir), 17 (21 dpi, KirNC), 15 (35 dpi, control), 15 (35 dpi, Kir), and 11 (35 dpi, KirNC). All bar charts represent mean ± SEM.
- Figure 9.
Potential role for the differential timing of neuronal maturation in memory encoding. A, Time sequence (gray columns) of neuronal maturation represented by two adult-born neurons from the same cohort developing at different rates in the septal and temporal dentate gyrus. The period of enhanced excitability for each developing neuron is represented by yellow boxes, with recruited CA3 ensembles shown below. As a result of the faster maturation rate, the period of enhanced excitability is shorter in the septal region than in the temporal area. Therefore, for events happening close in time, such as biking one day (blue) and finding a lizard the following day (red), the same immature neuron of the septal region would be active, together with the mature neuronal ensembles representing these events (colored neurons). In contrast, the immature neuron developing in the temporal dentate gyrus would be active together with neuronal ensembles representing events occurring within a longer interval, such as finding a lizard (red) that day, seeing a butterfly on a flower (green), looking at a cat on a roof (purple), and finishing a book (brown) during consecutive days. Note that the fast-maturing neuron in the septal region is active during two events, whereas the slow-maturing neuron in the temporal area is active for four ensembles. As a consequence, in the downstream CA3 region, the same pyramidal neuron (yellow, target of new neurons) will be recruited to be part of two ensembles (blue and red) in the septal region but four ensembles (red, green, purple, and brown) in the temporal area. B, CA3 ensembles (memory representations) for different events may show varying amounts of overlap depending on whether upstream DGCs developed in the septal or temporal regions: septal CA3 cells would show less overlap (the yellow cell is part of two ensembles), whereas temporal CA3 cells would show more overlap (the yellow cell is part of four ensembles). In this example, activation of the blue ensemble in the septal region might activate the red ensemble, such that the memory of “finding a lizard” would be retrieved during the “biking” recall. In contrast, activation of the red ensemble in the temporal region could activate several neuronal ensembles that might provide contextual information such as the time of “reading a book.”


