

Article Figures & Data
Figures
- Figure 1.
Mapping the binding region of hTas1R2 for aspartame and neotame. A, Human, squirrel monkey, or human + squirrel monkey mismatched sweet taste receptors with Gα16-gust44 were cotransfected and expressed in HEK293E cells, and Ca2+ mobilization in response to the sweeteners aspartame (10 mm), neotame (1 mm), sucralose (2 mm), d-tryptophan (5 mm), and sucrose (150 mm) and HBSSH buffer were measured. The calcium response signals were normalized to the maximum response of hTas1R2/hTas1R3 receptor to sucralose (2 mm). F is the baseline level of fluorescence, and ΔF is the change in fluorescence from the baseline level (peak − baseline). Data are expressed as the mean ± SEM of the ΔF/F values from three independent experiments. The asterisk indicates significant differences tested by unpaired Student's t test compared with hTas1R2/hTas1R3 receptors (**p < 0.01; ***p < 0.001). B, Schematic representation of the heterodimer of Tas1R2 and Tas1R3. The arrow points to the site 572, which is the SfiI enzyme cleavage site for both human and squirrel monkey Tas1R2 monomers. The VFTM of hTas1R2/hTas1R3 homology model is represented as a newcartoon color coded by gray and black for hTas1R2 and hTas1R3, respectively, by using VMD program (Hymphrey et al., 1996). C, The responses of hTas1R2/hTas1R3 and smTas1R2/smTas1R3 are the same as those shown in A, which is for comparison with human/squirrel monkey chimeras' [h(1-572)smTas1R2 is a chimera of hTas1R2 (1-572) + smTas1R2 (573-833), and sm(1-567)hTas1R2 is a chimera of smTas1R2 (1--567) + hTas1R2 (568-839)] responses to the sweeteners aspartame (10 mm), neotame (1 mm), and sucralose (2 mm). The asterisks indicate significant differences tested by unpaired Student's t test (*p < 0.05; **p < 0.01; ***p < 0.001) compared with the hTas1R2/hTas1R3 receptors. Diagram color coding: red, hTas1R2; cyan, hTas1R3; blue, smTas1R2; purple, smTas1R3.
- Figure 2.
Predicted critical residues determine the species dependence of sweet taste. A, Sequence alignment between the VFTMs of hTas1R2 and smTas1R2. Conserved residues are shaded by black, and semiconservative residues are shaded by gray. The model-predicted four critical amino acids involved in human and squirrel monkey sweet taste selectivity toward aspartame and neotame are marked above and below the sequences. B, The location of predicted four key residues, S40, V66, I67, and D142, in the VFTM of hTas1R2 homology model. The receptor is represented as Cα trace color coded by gray, and the key residues are represented as a licorice model color coded by atom type.
- Figure 3.
Evaluation of single or multiple point mutation affecting the human/squirrel monkey sweet taste receptors responses to sweeteners. A, HEK293E cells transiently transfected with human [hTas1R2/hTas1R3 (control)] and mutated hTas1R2 receptors along with Gα16-gust44. The responses of the cells to aspartame (10 mm), neotame (1 mm), and sucralose (2 mm) were assayed by calcium mobilization. The calcium response signals were normalized to the maximum response of hTas1R2/hTas1R3 receptor to sucralose (2 mm). Values represent the mean ± SEM of three independent experiments. The asterisk indicates significant differences tested by one-way ANOVA with Tukey's multiple-comparison test (*p < 0.05; **p < 0.01; ***p < 0.001) compared with the hTas1R2/hTas1R3 receptors. B, C, Dose–response of human and selected mutated human sweet taste receptors toward aspartame (B) and toward neotame (C). The responses of the cells to concentrations of the sweeteners aspartame and neotame were assayed by calcium mobilization. The calcium response signals were normalized to the maximum response of hTas1R2/hTas1R3 receptor to neotame. Mutants hTas1R2:S40T/D142E+hTas1R3, hTas1R2:I67S/D142E+hTas1R3, and hTas1R2:S40T/I67S/D142E+hTas1R3 showed no responses to aspartame versus good response of hTas1R2+hTas1R3 (EC50 = 5.0 × 10⁻³ m, B: 7.074, T: 73.32). Mutants hTas1R2:S40T/I67S/D142E+hTas1R3 (EC50 = 1.2 × 10⁻² m, B: −1.486, T: 39.87), hTas1R2:S40T/D142E+hTas1R3 (EC50 = 1.4 × 10⁻³ m, B: 1.387, T: 61.12), and hTas1R2:I67S/D142E+hTas1R3 (EC50 = 4.7 × 10⁻³ m, B: −1.772, T: 51.81) showed weaker responses to neotame versus good response of hTas1R2+hTas1R3 (EC50 = 1.4 × 10⁻⁵ m, B: −165.1, T: 92.82)). The asterisks indicate significant differences tested by unpaired Student's t test (*p < 0.05; **p < 0.01; ***p < 0.001) compared with the hTas1R2/hTas1R3 receptors. D, HEK293E cells transiently transfected with squirrel monkey [smTas1R2/smTas1R3 (control)] and mutated smTas1R2 receptors along with Gα16-gust44. The responses of the cells to aspartame (10 mm), neotame (1 mm), and sucralose (2 mm) were assayed by calcium mobilization. The calcium response signals were normalized to the maximum response of hTas1R2/hTas1R3 receptor to sucralose (2 mm). Values represent the mean ± SEM of three independent experiments. The asterisk indicates significant differences tested by one-way ANOVA with Tukey's multiple-comparison test (**p < 0.01; ***p < 0.001) compared with the smTas1R2/smTas1R3 receptors. E, F, Dose–response of squirrel monkey, and selected mutated squirrel monkey sweet taste receptor toward aspartame (E) and toward neotame (F). The responses of the cells to concentrations of the sweeteners aspartame and neotame were assayed by calcium mobilization. The calcium response signals were normalized to the maximum response of hTas1R2/hTas1R3 receptor to neotame (B). Mutants smTas1R2:T40S/E142D+smTas1R3 (EC50 = 1.4 × 10⁻³ m, B: −3.314, T: 42.4), sm Tas1R2:S67I/E142D+smTas1R3 (EC50 = 5.6 × 10⁻³ m, B: −0.6682, T: 26.17), and smTas1R2:T40S/S67I/E142D+smTas1R3 (EC50 = 1.2 × 10⁻³ m, B: −2.882, T: 32.61) showed good response to aspartame versus no response of smTas1R2+smTas1R3. Mutants smTas1R2:T40S/S67I/E142D+smTas1R3 (EC50 = 2.8 × 10⁻⁴ m, B: −4.671, T: 51.73), smTas1R2:S67I/E142D+smTas1R3 (EC50 = 1.0 × 10⁻³ m, B: −5.754, T: 56.59), and smTas1R2:T40S/E142D+smTas1R3 (EC50 = 2.1 × 10⁻³ m, −4.24, T: 69.46) showed good responses to neotame versus no response of smTas1R2+smTas1R3. The asterisks indicate significant differences tested by unpaired Student's t test (***p < 0.001) compared with the smTas1R2/smTas1R3 receptors. Data (B, C, E, F) were fitted with sigmoid dose–response curves [Y = Bottom + (Top − Bottom)/(1 + 10LogEC50−X)] using GraphPad Prism software, and expressed as the mean ± SEM of the ΔF/F values from three independent experiments.
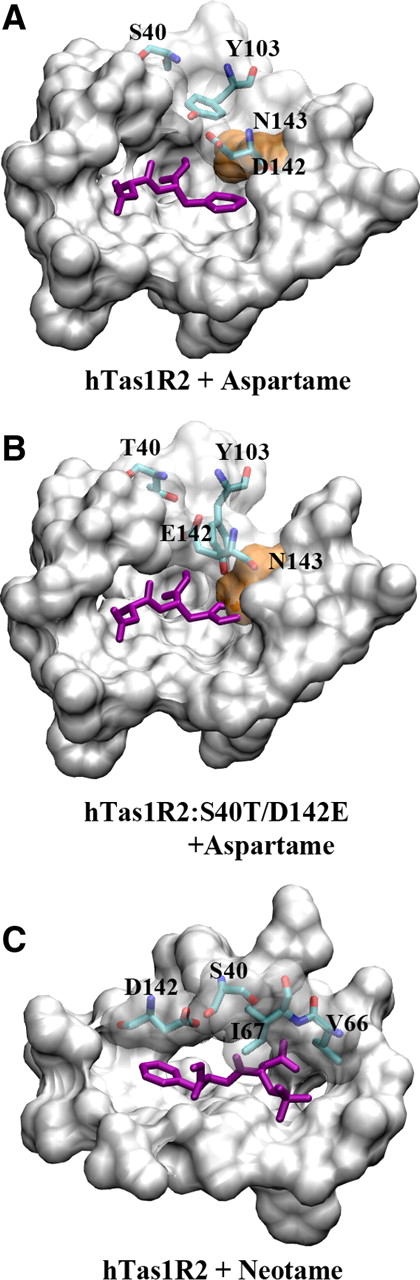
- Figure 4.
The refined docking complex structures of the VFTM domain of hTas1R2. A, B, Aspartame is docked within the binding pockets of hTas1R2 wild-type receptor (A) and mutated receptor hTas1R2:S40T:D142E (B). Only the binding pocket of hTas1R2 and the mutant with aspartame are shown. The pocket residues are illustrated by a molecular surface colored with silver except for the residue N143 (in orange). Aspartame is rendered as a stick model and colored by purple. Five critical residues for the human/squirrel monkey recognition (S40, T40, Y104, D142, and E142) toward aspartame are rendered as stick models and colored by atom element. C, Neotame is docked within the binding pocket of hTas1R2 wild-type receptor. The pocket residues are illustrated by a molecular surface colored with silver. Neotame is rendered as a stick model and colored by purple. Four residues involved in the human/squirrel monkey recognition (S40, D142, V66, and I67) toward neotame are rendered as stick models and colored by atom type.


