

Abstract
Synaptic plasticity directs development of the nervous system and is thought to underlie memory storage in adult animals. A great deal of our current understanding of the role of AMPA receptors in synaptic plasticity comes from studies on developing cortex and cell cultures. In the present study, we instead focus on plasticity in mature neurons in the neocortex of adult animals. We find that the glutamate receptor 1 (GluR1) subunit of the AMPA receptor is involved in experience-dependent plasticity in adult cortex in vivo and that it acts in addition to neuronal nitric oxide synthase (αNOS1), an enzyme that produces the rapid synaptic signaling molecule nitric oxide (NO). Potentiation of the spared whisker response, following single whisker experience, is ∼33% less in GluR1-null mutants than in wild types. We found that the remaining plasticity depended on αNOS1. Potentiation was reduced by >42% in the single αNOS1-null mutants and completely abolished in GluR1/αNOS1 double-knock-out mice. However, potentiation in GluR1/NOS3 double knock-outs occurred at similar levels to that seen in GluR1 single knock-outs. Synaptic plasticity in the layer IV to II/III pathway in vitro mirrored the results in vivo, in that LTP was present in GluR1/NOS3 double-knock-out mice but not in the GluR1/αNOS1 animals. While basal levels of NO in cortical slices depended on both αNOS1 and NOS3, NMDA receptor-dependent NO release only depended on αNOS1 and not on NOS3. These findings demonstrate that αNOS1 acts in concert with GluR1 to produce experience-dependent plasticity in the neocortex.
Introduction
Plasticity mechanisms play an important role in development of the neocortical circuit and, later in life, in processing and storing long-term memories. Many studies to date have focused on the role of AMPA receptor insertion as a mechanism for plasticity, in which the canonical form of LTP involves insertion of GluR1/GluR2-containing AMPA receptors in the postsynaptic membrane (Shi et al., 2001; Lu et al., 2009). While there is a good deal of evidence that plasticity involves GluR1 receptor insertion in the neocortex of developing animals (Takahashi et al., 2003; Clem and Barth, 2006; Clem et al., 2008) and in cultured neurons from neonates (Shi et al., 2001; Lu et al., 2009), it is not known that the same process occurs in adult cortex, and, indeed, some evidence suggests it does not. Blocking GluR1 insertion with a virally expressed C-terminal domain of GluR1 does not decrease synaptic strength even in animals as young as P21–P23 (Jitsuki et al., 2011), and silent synapses, lacking functional AMPA receptors, tend to be rare in neocortex beyond ∼1 month of age (Rumpel et al., 2004). Studies show that the GluR1 dependence of cortical and hippocampal plasticity decreases with age (Grosshans et al., 2002; Jensen et al., 2003). This makes it important to study plasticity outside the developmental time window to understand the plasticity mechanisms that operate in adult animals and that might thereby underlie the lifelong plasticity that is characteristic of the neocortex.
To test the involvement of GluR1 in plasticity, we studied plasticity in GluR1 knock-out mice. We looked at the effect of whisker deprivation on receptive field plasticity in layer II/III neurons in the barrel cortex. The barrel cortex is part of the somatosensory cortex, and observations from several species show that somatosensory cortex also exhibits plasticity in adulthood (Clark et al., 1988). It also exhibits plasticity that shares many properties with hippocampal LTP, such as activity dependence (Wallace et al., 2001) and a requirement for a CaMKII autophosphorylation (Glazewski et al., 2000). Our previous studies in vitro have shown that GluR1 knock-out mice exhibit neocortical LTP that depends on nitric oxide (NO) (Hardingham and Fox, 2006). NO is produced by nitric oxide synthase (NOS) of which there are two main isoforms in the healthy brain; neuronal NOS (or NOS1) and endothelial NOS (or NOS3). Both isoforms are thought to play a role in hippocampal LTP (Hopper and Garthwaite, 2006), but their function in neocortical LTP is unclear. To test whether experience-dependent plasticity also depends on NO in adult animals, we crossed GluR1 knock-outs with animals lacking either αNOS1 or NOS3 and deprived the animals of all but the D1 whisker (αNOS1 is a subisoform of NOS1 that has PDZ interacting domains that localize it to the postsynaptic density of the synapse (Huang et al., 1993)). Our findings not only provide evidence for the involvement of GluR1 in adult experience-dependent potentiation (EDP) but also show that GluR1-independent potentiation occurs and operates via neuronal nitric oxide synthase (αNOS1).
Materials and Methods
Subjects.
For the experience-dependent plasticity studies, we used 19 wild types [12 deprived (255 cells) and 7 undeprived (73 cells)], 25 GluR1 knock-outs [12 deprived (308 cells) and 13 undeprived (244 cells)], 13 GluR1/αNOS1 knock-outs [6 deprived (80 cells) and 7 undeprived (88 cells)], and 19 GluR1/NOS3 knock-outs [12 deprived (203 cells) and 7 undeprived (89 cells)]. Recordings were performed at an average age of 5 months (range, 2.5–10 months). For the in vitro LTP studies, we used eight GluR1/αNOS1 and eight GluR1/NOS3 double knock-outs. For the NO release studies, we used 26 wild types, 3 wild types treated with l-NAME for 2 d, and 5 αNOS1 and 5 NOS3 single knock-outs. For the characterization of spontaneous spike-burst behavior and layer IV to II/III LTP, we studied 36 wild types and 2 αNOS1 single knock-outs. All genotypes for in vitro studies used were 6–8 weeks of age. Approximately equal numbers of male and female animals were used in both the in vivo and in vitro experiments for all genotypes.
The colony was maintained as heterozygotes of the targeted mutations of the αNOS1, NOS3 (both originally sourced from The Jackson Laboratory), or GluR1 genes (supplied originally by the Rawlins Laboratory, Oxford, UK). To generate single knock-outs and wild-type littermates for the experiments, we bred heterozygous animals. To generate double knock-outs, we bred double heterozygotes (e.g., GluR1−/+ × NOS+/−). On occasions, it was necessary to breed homozygotes to increase the yield of double knock-outs. The background of the knock-outs was C57BL/6JOlaHSD (Harlan).
Whisker deprivation, anesthesia surgery, and recording.
Mice underwent unilateral whisker deprivation for 18 d followed by 6–10 d of regrowth before electrophysiological recordings. For the deprivation procedure, anesthesia was induced by isoflurane, and all but the D1 whisker were removed by slow steady tension. This has been previously shown not to damage the whisker follicle (Li et al., 1995). Deprivation was checked every 2 d and maintained for 18 d. Undeprived control mice had all their whiskers left intact.
On the day of recording, anesthesia was induced by isoflurane and maintained by urethane (1.5 mg/kg) and acepromazine malate to a depth equivalent to stage III slow-wave sleep. Anesthetic depth was monitored by cortical firing properties, hindlimb reflex response, and respiratory rates. The mice were transferred to a Narishige stereotaxic frame where the contralateral skull was thinned. A 30 gauge hypodermic needle was used to create a small hole in the thinned skull for each penetration and allow a glass-insulated carbon fiber microelectrode to be introduced to the cortex.
The whiskers were cut to similar lengths and stimulated by 50 × 200 μm deflections (1° deflection) at 1 Hz, using a piezoelectric stimulator. Single-unit extracellular spikes were recorded at a bandwidth of 600 Hz to 6 kHz and sorted using a dual-threshold spike discriminator (Neurolog) or, if required, off-line using a spike shape recognition algorithm (Spike2; CED). Evoked spike response amplitude, latency, and spontaneous and evoked analog data were recorded using Spike2 software (CED). Responses to each whisker were quantified using poststimulus time histograms.
Cells were recorded at depth intervals of between 50 and 100 μm. Single-unit responses were discriminated at each location. If it was difficult to discriminate a spike, then small depth alterations were made to improve the spike discrimination quality. The principal (PW), D1, and the immediate surrounding whiskers were stimulated for every cell wherever possible. The latency to the first recorded spike in layer IV neurons in response to principal whisker stimulation was defined as the first 1 ms bin after the stimulus to have a minimum of three spikes (spontaneous activity having been subtracted). At the end of each penetration, a microlesion was made in layer IV (1 μA; tip negative for 10 s).
Histological methods.
At the end of the experiment, the mouse was perfused with fixative. The brain was removed and divided and the nonrecorded hemisphere discarded. The remaining hemisphere was flattened between two slides and cryoprotected with sucrose solution (10–20%) for 24 h. Horizontal sections of tissue were cut on a freezing microtome at a thickness of 35 μm and reacted for cytochrome oxidase activity to visualize the barrel patterning in layer IV. This allowed accurate confirmation of the depth and location of the lesions. Layer II/III was defined as being at a depth of between 30 and 270 μm from the pia and layer IV between 270 and 450 μm from the pia. The layer IV barrel field was drawn using a camera lucida system (Leica Microsystems) and scanned into a computer. Barrel area and width were determined using the ImageTool software (University of Texas Health Science Center at San Antonio, San Antonio, TX).
Slice preparation for in vitro recordings.
C57BL/6 mice (6–8 weeks of age) were killed by cervical dislocation and the mouse's brain was cooled rapidly by immersion in ice-cold artificial CSF (aCSF) [containing the following (in mm): 119 NaCl, 3.5 KCl, 1 NaH2PO4, 2 CaCl2, 1 MgSO4, 26 NaHCO3, and 10 glucose]. Coronal slices (400 μm) containing barrel cortex were prepared by conventional methods (Hardingham and Fox, 2006) using a Leica VT1000 vibrating microtome (Leica) and maintained in a holding chamber containing aCSF [bubbled with 5% CO2 and 95% O2 at room temperature (21–24°C)] for up to 8 h after preparation. During electrophysiological recordings [performed at room temperature (21–24°C)], slices were continually perfused (2–3 ml/min) with aCSF bubbled with the gas mixture (5% CO2 and 95% O2).
Intracellular solutions and drugs used.
Intracellular electrodes (10–15 MΩ) contained the following (in mm): 110 K-gluconate, 10 KCl, 2 MgCl2, 2 Na2ATP, 0.3 Na2GTP, 10 HEPES. To block NO synthase pharmacologically in the LTP experiments, 1 mm N-ω-nitro-l-arginine (l-NNA) was included in the electrode filling solution as indicated in the text. The solutions were all corrected to a pH of 7.3 and 290 mOsm. l-NAME at 100 μm was used to block NO synthase extracellularly in experiments in which NO release was studied, as indicated in the text. APV was used extracellularly to block NMDA receptors (50 μm). All drugs were obtained from Tocris Bioscience.
In vitro recording and LTP protocol.
The stimulating electrode was placed accurately within the wall of a layer IV barrel under visual guidance using an Olympus Optical BH2 video microscope and a transilluminated slice. Cells were chosen in layer II/III on the near side of the adjacent barrel column and patched under visual guidance using a 40× water-immersion objective, differential interference contrast optics, and infrared illumination. Stimulation intensity was set at a level to produce an EPSP of ∼5 mV in amplitude. EPSPs were evoked at a frequency of 0.14 Hz.
Whole-cell recordings were made at the postbreak in potential (average resting potential of −69 ± 5 mV for wild types, −72 ± 4 mV for αNOS1, −70 ± 4 mV for GluR1/αNOS1, and −72 ± 5 mV for GluR1/NOS3 knock-outs) in the current-clamp configuration but discarded if the series resistance changed by >20% over the experiment. Monosynaptic components of the EPSPs had reversal potentials close to 0 mV (average Er of 3.2 ± 9.3 mV for wild types and 2.8 ± 7.2 mV for mutants). The pairing protocol consisted of pairing the presynaptic stimulus with a brief postsynaptic pulse (10 ms) sufficient to produce a postsynaptic action potential (pre–post interval of 10 ms). The pairing protocol consisted of four trains of 50 pairs of stimulations at a frequency of 2 Hz, with a 30 s gap between each of the four trains.
Nitric oxide measurements.
Mouse brain slices were prepared as for the electrophysiological experiments. To stimulate production of nitric oxide, we placed slices in a chamber filled with solution (aCSF) containing 0 Mg2+ and 50 μm bicuculline (BMI/0Mg2+). Levels of NO were estimated by measuring NO2− using the Griess Reagent System (Promega). Preliminary estimates of NO release at 15, 30, 60, and 120 min after BMI/0Mg2+ showed the peak value occurred after 30 min. Although NO has a half-life of ∼5–15 s, the nitrite signal (which is measured in the Griess assay) has a half-life of at least 45 min (Ignarro et al., 1993). The measure at the 30 min time point is therefore approximately the integral with respect to time of NO evolution over the 30 min. All further data were therefore measured at this 30 min time point. In one experiment, we also incubated sections in l-NAME for 4 h to estimate the rate of decay of the nitrite signal. In one further experiment, to antagonize NOS in vivo for 2 d before the release study, wild-type mice were given two, once-daily intraperitoneal injections of l-NAME (at a dose of 75 mg/kg in 0.9% saline solution). The final injection was delivered 24 h before slice preparation. The cortical slices were then incubated in 100 μm l-NAME for 4 h. After treatment with BMI/0Mg2+ or other drug solutions, the brain slices were placed in a cryo-vial (three per vial) and snap frozen in liquid nitrogen. The tissue was homogenized in dH2O (1:3; w/v) and centrifuged at 4°C (36,000 × g; 15 min) to pellet tissue components. The supernatant was then assayed for NO in a spectrometer. Fifty microliters of the sample to be measured was incubated in the presence of sulfanil-amide, followed by N-1-napthylethylenediamine, which causes the conversion of NO to NO2−. A colorimetric change was measured at a wavelength of 525 nm, and levels were quantified using an NO2− standard curve. By testing solutions of NO donor (spermine NONOate), we found that this method is capable of measuring NO concentrations over a range of between 1 and 100 μm, a range that included our experimentally observed concentrations (see Fig. 5E,F). The same BMI/0Mg2+ solution was used to measure burst firing in neurons and for experiments in which EPSPs were measured in response to changing the solution to BMI/0Mg2+ (see Fig. 6).
Statistical methods.
Spike responses for the D1, principal, and surrounding whiskers were averaged for each animal, and then averaged across all mice within each genotype group. All values are expressed as means ± SEM. Plasticity was assayed by comparing D1 responses from deprived mice with undeprived control mice as well as across deprived genotypes, where “n” is the number of animals involved in each case. Unpaired t tests, one-way and two-way ANOVAs with post hoc analysis were used to evaluate differences between genotypes. Cumulative distribution functions were analyzed using the Kolmogorov–Smirnov test.
Map plasticity was estimated by averaging all layer II/III D1 responses within a penetration and assigning each penetration to one of three bands, blue for <25 spikes per 50 stimuli, green for between 25 and 50 spikes per 50 stimuli, and yellow for >50 spikes per 50 stimuli. The colored circles were placed on a diagram barrel map in their precise anatomical location. Differences between control and deprived conditions were determined by χ2 analysis.
EPSP amplitudes were averaged over 15 min control periods of recording. Plasticity was monitored by comparing mean amplitudes between 50 and 60 min after the LTP protocol with mean amplitudes from the control periods of recording. EPSP values were normalized to control periods of recording; this enabled comparisons of plasticity to be made between genotypes and treatment conditions. In the case of the in vitro NO measurements, average NO measurements from slices treated with bicuculline were compared with control slices that had been bathed in aCSF at the same time. Comparisons of NO levels were also made between different treatment conditions and genotypes. The effect of these treatments was analyzed using a two-way ANOVA and post hoc t tests.
Results
Experience-dependent potentiation is partly GluR1 dependent in adults
In wild-type animals, a period of single (D1) whisker experience caused potentiation of spike responses to D1 whisker stimulation in layer II/III of D1-surrounding barrel columns. The color-coded map of individual penetrations in the barrel cortex shows the strength of response to D1 whisker stimulation (Fig. 1). The strongest responses are normally localized to the D1 barrel in undeprived animals but invade the surrounding barrels after a period of deprivation. The potentiated responses in surrounding barrels depends on intracortical connections emanating from the spared whisker column (Fox, 1994; Fox et al., 2003). The proportion of penetrations showing high response levels (penetrations coded green and yellow) increased from 15 to 86% in wild types following deprivation, and from 5 to 67% in GluR1 knock-outs, which are both significant increases from control [χ2 = 24.7 (wild types) and χ2 = 32.1 (GluR1); p < 0.0001 in both cases] (Fig. 1).

Experience-dependent plasticity in barrel cortex: the spared whisker domain expands following deprivation in layer II/III in wild types, GluR1 and GluR1/NOS3 knock-outs, but not in GluR1/αNOS1 knock-outs. Each penetration represents the average response of layer II/III to D1 whisker stimulation in which recordings were made in at least three cells in layer II/III. Recording locations are identified from small (50 μm) lesions made in layer IV at the end of the recording penetration relative to the cytochrome oxidase-stained barrel field (Wong-Riley and Welt, 1980; Fox, 1994). The response level is color coded such that penetrations containing cells with the strongest average responses (R) are yellow (R ≥ 50 spikes per 50 stimuli), medium strength responses are coded green (50 > R ≥ 25), and the weakest responses, characteristic of control undeprived animals, are coded blue (R < 25 spikes per 50 stimuli). Top row, D1 whisker domains for control (undeprived) animals. Note that the strongest responses are evoked in cells largely confined to the D1 column. Bottom row, D1 domains for animals deprived of all but the D1 whisker for 18 d. The D1 barrel is shaded dark gray. Note that the D1 domain expands beyond the borders of the D1 barrel following deprivation.
We looked at the average response to D1 whisker stimulation to quantify further the level of potentiation. A two-way ANOVA revealed an effect of genotype and deprivation on the magnitude of potentiation. There was a significant main effect of deprivation [F(1,75) = 81.08; p < 0.0001 (including GluR1/αNOS1 and GluR1/NOS3 knock-out genotypes) (see following section)] and genotype (F(3,75) = 7.67; p < 0.0001), and a significant interaction between the two (F(3,75) = 7.00; p < 0.0001). Following the significant interaction, tests of simple main effects showed that significant potentiation occurs in wild types (F(1,75) = 52.37; p < 0.0001) and GluR1 knock-outs (F(1,75) = 29.80; p < 0.0001). Pairwise comparisons (Bonferroni corrected) revealed that the responses in GluR1 knock-out mice differed statistically from wild-type mice (p = 0.008). In wild types, the averaged spared whisker response in surrounding barrels increased by 286% following deprivation (Fig. 2). GluR1 knock-outs also showed clear potentiation of the spared whisker response, but the level of potentiation attained was significantly smaller than that of wild types (Fig. 2) (64% of potentiated wild-type value; t(22) = 3.2; p < 0.005). These data show that GluR1 is indeed involved in experience-dependent plasticity in the neocortex. However, the data also show that GluR1 is clearly not the only factor involved in the spared whisker potentiation.

Quantification of the effect of GluR1, GluR1/αNOS1, and GluR1/NOS3 knock-outs on experience-dependent potentiation of surround receptive field responses. Histograms show average D1 whisker responses for layer II/III cells recorded in barrels surrounding the D1 barrel. The black bars depict D1 responses in animals deprived of all but the D1 whisker for 18 d, followed by 7 d of regrowth, and the white bars show D1 whisker responses from undeprived control animals. *p < 0.05, **p < 0.01 for comparisons with the potentiated D1 response in deprived wild-type animals; ††p < 0.01, †††p < 0.001 for comparisons with the D1 response within the same genotype group in undeprived cases. Note that only GluR1/αNOS1 knock-outs show no potentiation at all. Error bars indicate SEM.
The residual GluR1-independent potentiation requires αNOS1
We measured potentiation of the spared whisker response in GluR1/αNOS1 double-knock-out mice that had been subject to single whisker experience. Penetrations in barrels surrounding D1 showed similar responses to those seen in undeprived animals (penetrations with high response levels were 7% before and 21% following deprivation; χ2 = 1.21; p > 0.05) (Fig. 1). In contrast, in the GluR1/NOS3 double-knock-out mice, we found that following deprivation the D1 domain expanded into neighboring barrels such that 73% of the penetrations were above control levels, which was a statistically significant increase (χ2 = 16.5; p < 0.005) (Fig. 1) and similar to the finding in wild types and GluR1 knock-outs. Following the significant main effects and interaction between the factors from the two-way ANOVA (see section above), GluR1/NOS3 knock-out mice clearly showed significant potentiation of the spared whisker response (increase of 447%; F(1,75) = 34.78; p < 0.0001) (Fig. 2), while GluR1/αNOS1 knock-out mice showed no spared whisker potentiation (increase of 19%; F(1,75) = 0.15; p > 0.05).
To determine whether potentiation could be entirely accounted for by NOS1, we also studied spared whisker potentiation in the αNOS1 single-knock-out animals. We found that the proportion of penetrations in deprived barrels showing high spared whisker response levels (green and yellow coded penetrations) increased from 13 to 59% in the αNOS1 KOs (χ2 = 14.3; p < 0.0001) (Fig. 3A,B), and the average response to the spared whisker was increased by 129% (t(22) = 3.13; p < 0.005) (Fig. 3C). This demonstrates that a lack of αNOS1 alone cannot account for the plasticity deficit in the GluR1/αNOS1 double knock-outs. However, although αNOS1 knock-out mice clearly exhibited some plasticity, the magnitude was less than that of wild types. Spared whisker responses were 42% lower in αNOS1 KOs than in wild-type mice (t(24) = 3.16; p < 0.004). Together, these findings demonstrate that αNOS1 is not only involved in potentiation in the cortex but can also account for the residual plasticity in the GluR1 knock-out mice.

Effect of whisker deprivation on plasticity in barrel cortex in αNOS1 knock-out mice. A, Responses of layer II/III cells to stimulation of the D1 whisker in undeprived control animals. Each circle corresponds to a penetration comprising responses from at least 3 layer II/III cells. The highest levels of D1 response (R) are indicated in yellow (R ≥ 50 spikes per 50 stimuli), lowest in blue (R < 25), and intermediate in green (50 > R ≥ 25). B, Sparing the D1 whisker and removing the other whiskers on one side of the face causes an increase in the response of neurons in barrels surrounding D1 to stimulation of D1. The proportion of penetrations showing the higher levels of response increased from 13 to 59%, which was statistically significant (χ2 = 14.3; p < 10−3). C, Average responses to D1 whisker stimulation for cells lying in barrels immediately surrounding the D1 barrel. The spared whisker responses (black bar) potentiate significantly (t(22) = 3.13; **p < 0.005) by 129% compared with control undeprived levels (white bar). Error bars indicate SEM.
Long-term potentiation is αNOS1 dependent in GluR1 knock-outs
LTP is partly NO dependent in wild type mice and entirely NO dependent in GluR1 knock-out mice (Hardingham and Fox, 2006), and LTP is known to interact with EDP in barrel cortex (Hardingham et al., 2008). Therefore, we tested whether αNOS1 was also involved in cortical LTP. We studied mice aged 6–8 weeks, which, although younger than animals studied in vivo, were still beyond the stage of development for the juvenile form of LTP seen in GluR1 knock-outs (P42) (Jensen et al., 2003) and several weeks beyond the major period of synaptogenesis in the cortex (Micheva and Beaulieu, 1996).
In wild-type mice, pairing presynaptic and postsynaptic action potentials so that the postsynaptic action potential occurs 10 ms after the presynaptic action potential (Fig. 4) produces significant potentiation of EPSPs in 37.5% of cases and causes an average EPSP potentiation of 29 ± 8% of control values (Hardingham et al., 2008). Previous studies have shown that GluR1 KOs also exhibit LTP in this pathway (Hardingham and Fox, 2006). In the GluR1/αNOS1 double-knock-out mice, we found that the probability of LTP was reduced (to 6.7%) and the average magnitude of LTP was just 4 ± 1% of baseline levels (Fig. 4A) (n = 18). In contrast, the probability of LTP in the GluR1/NOS3 knock-out mice was similar in frequency (41%) to that observed in wild types and similar in magnitude to that found in single GluR1 knock-outs (19 ± 4%; t(41) = 2.2; p > 0.34; n = 20) (Fig. 4B). We also tested whether any residual LTP in the GluR1/NOS3 knock-outs could be attributed to NOS activity by including the NOS blocker l-NNA in the intracellular electrode (n = 20). A two-way ANOVA showed an effect of genotype (F(3,159) = 4.90; p = 0.003) and l-NNA (F(1,159) = 18.54; p < 0.0001) on LTP. Post hoc t tests showed that l-NNA eliminated plasticity in the GluR1 single knock-outs (t(70) = 3.2; p < 0.001) and the GluR1/NOS3 double knock-outs (t(40) = 2.2; p < 0.02) and had a small depressive effect in the GluR1/NOS1 double-knock-out mice (reduction from 4 ± 1% of baseline to −2.8 + 0%; n = 18; t(36) = 2.0; p < 0.05), although the GluR1/αNOS1 animals did not show LTP in the absence of l-NNA in any case (t(36) = 1.2; p > 0.23). The finding implies residual LTP in the GluR1/NOS3 mice is NO dependent as it was blocked by intracellular application of l-NNA (Fig. 4). Overall, these findings imply that, in animals lacking GluR1, the αNOS1 isoform is necessary for LTP in the layer IV to II/III intracortical pathway.

LTP is present in GluR1/NOS3 but not GluR1/αNOS1 knock-outs. LTP was induced by pairing four trains of 50 stimuli at 2 Hz with the postsynaptic spike timed to occur 10 ms after the presynaptic spike at the time indicated by the arrow. A, LTP was absent in GluR1/αNOS1 knock-outs (black circles; n = 18), and no further reduction in responses was observed with l-NNA in the electrode (white circles; n = 18). B, GluR1/NOS3 knock-outs showed normal wild-type levels of LTP (black circles; n = 20), but LTP was entirely abolished by including the NOS antagonist l-NNA in the recording electrode (white circles; n = 20). The circles represent mean EPSP amplitude for each time point averaged across cells; error bars are SEs per 10 stimuli. C, Quantification of the level of potentiation 60 min after pairing presynaptic and postsynaptic stimuli for cases with (white bars) and without l-NNA in the electrode (black bars). Significant levels of LTP are indicated as follows: +p < 0.05 and ++p < 0.01. Levels of LTP significantly different from wild-type (control) values are indicated as follows: *p < 0.05 and **p < 0.01. For wild types (WT), n = 24 with and n = 24 without l-NNA. For GluR1 knock-outs (GluR1), n = 18 with and without l-NNA. For GluR1/αNOS1 double knock-outs (GluR1/NOS1), n = 18 with and without l-NNA. For GluR1/NOS3 double knock-outs (GluR1/NOS3), n = 20 with and without l-NNA. D, Diagram to indicate the placement of the electrodes relative to the barrel columns in the slice and the timing of the presynaptic and postsynaptic spikes in the pairing protocol.
NMDA receptor-dependent NO release is αNOS1 dependent
NOS1 is found in neocortical spines associated with NMDA receptors (Aoki et al., 1997; Husi et al., 2000; Valtschanoff and Weinberg, 2001). Unlike NOS3, the αNOS1 isoform of nitric oxide synthase associates with the NMDA receptor via its PDZ binding domain (Huang et al., 1993), which may explain its role in experience-dependent plasticity in vivo and synaptic plasticity in vitro described above. It has been suggested that both NOS3 and NOS1 are involved in hippocampal LTP by controlling tonic and phasic levels of NO, respectively (Hopper and Garthwaite, 2006). We therefore measured the tonic levels of NO produced in NOS3 and αNOS1 knock-out mice as well as the ability of NMDA receptor activation to evoke phasic release of NO in cortex. Phasic NO release was induced by incubating slices in an isotonic electrolyte solution containing the GABA antagonist bicuculline, an established model of in vitro neuroplasticity (Arnold et al., 2005), and lacking the NMDA channel blocking divalent ion magnesium (BMI/0Mg2+) (Fig. 5). Simultaneous disinhibition with BMI and removal of the voltage dependence of the NMDA channel results in strong activation of NMDA receptors, which are known to be important for induction of LTP in the cortex. Preliminary studies using NMDA to evoke NO release were found to be deleterious to the slice, whereas slices were stable in BMI/0Mg2+ solution. The amount of NO released in an individual electrically stimulated pathway is too small to detect easily by present methods (Hall and Garthwaite, 2009). However, we found that, by producing spontaneous bursts of spikes throughout the slice, sufficient NO could be released to be quantified using the Griess assay [described by Griess (1879)]. However, adopting this method did mean that we measured NO release from the whole slice rather than just barrel cortex.

NMDA receptor-dependent NO release is αNOS1 dependent and basal NO levels are both αNOS1 and NOS3 dependent. A solution containing bicuculline and lacking magnesium (BMI/0Mg2+) results in spontaneous bursts of spikes in neocortex that activated NMDA receptors (Fig. 6) and generated NO. A, In wild types, the left-most two bars show that application of APV (50 μm; gray bar; n = 11) has no effect on basal levels of NO in untreated cortex (black bar; n = 11). The right-most two bars show that BMI/0Mg2+ causes an increase in NO production (black bar; n = 11) unless the cortex is pretreated with APV (gray bar; n = 11). B, Using the same convention as in A, in wild types BMI/0Mg2+ causes an increase in NO unless the cortex is pretreated with l-NAME (100 μm) 30 min beforehand (gray bar; n = 10). Thirty minutes of treatment with l-NAME did not produce a significant decrease in [NO] (gray bar; n = 10), but if the animals were injected with l-NAME 2 d previously, [NO] was significantly reduced (white bar; n = 3; p < 0.01). C, Basal levels of NO are significantly lower in αNOS1 knock-outs than wild types (n = 5 for both genotypes; p < 0.01). However, the increase in NO levels normally caused by BMI/0Mg2+ in wild types (black bar; n = 5) is not present in αNOS1 knock-outs (white bars; n = 5). D, Basal levels of NO are also significantly lower in NOS3 knock-outs (white bar; n = 5) than in wild types (black bar; n = 5; p < 0.01). However, the increase in NO production caused by BMI/0Mg2+ still occurs in NOS3 knock-outs (white bars; n = 5) and reaches similar levels to that seen in wild types (black bar; n = 5). NO values were normalized to the untreated wild-type condition in each case (indicated by the dashed line at unity). The amount of NO2− present in wild-type controls (over 30 min) was 15.4 ± 2.4 pm/mg (A), 7.4 ± 0.6 pm/mg (B), 9.1 ± 1.7 pm/mg (C), and 6.2 ± 1.2 pm/mg (D) (wet whole brain weight). *p < 0.05, **p < 0.01, NS, Not significant (p > 0.05). E, F, Calibration of the Griess assay for estimating NO concentration. Error bars indicate SEM. E, Concentrations of NO2− measured from solutions of increasing concentrations of NO donor (spermine NONOate; 0, 1, 10, and 100 μm). F, The same data as in E are plotted on logarithmic axes and show a linear relationship between [donor] and [NO2−] in the range of 1 to 10 μm. Our measures of [NO2−] from brain slices were within this range. Average basal levels of NO evolution (over 30 min) were equivalent to NO2− concentrations ranging from ∼2.8 to 7 μm, and stimulated values were between 69 and 128% greater than these. The point referring to a zero concentration of donor gave an NO2− concentration of 0.03 ± 0.03 μm.
In wild types, NO levels increased by 69 ± 13% compared with control values following treatment with BMI/0Mg2+ (Fig. 5). The increase in NO was antagonized by the addition of APV (increase of −10 ± 9% after treatment) (Fig. 5A). A two-way ANOVA revealed an interaction term between BMI/0Mg2+ and APV (F(1,43) = 6.7; p < 0.02). Post hoc t tests showed that this was because NO release increased in the control cases (t(10) = 4.4; p < 0.01) but remained at basal levels in the presence of APV (t(18) = 1.1; p = 0.29). These findings show that cortical NO release is NMDA receptor dependent. The stimulated NO signal was also antagonized by application of l-NAME (average of −4 ± 10% after treatment) (Fig. 5B). A two-way ANOVA again showed an interaction term, this time between BMI/0Mg2+ and l-NAME (F(1,39) = 9.2; p < 0.005) due to BMI/0Mg2+ treatment increasing NO release in the control condition (t(9) = 3.6; p < 0.01) but not in the presence of l-NAME (t(13) = 0.02; p = 0.98).
While 30 min preincubation with l-NAME was sufficient to inhibit BMI/0Mg2+-evoked NO release (Fig. 5B), basal levels appeared to be only weakly affected (t(19) = 2.2; p = 0.055). We found this was because of preexisting nitrite in the slices. Nitrite, which is the molecule measured in the Griess assay, has a relatively long half-life in aqueous solution even in the presence of oxyhemoglobin (Ignarro et al., 1993). If we preincubated for 4 h with l-NAME, the signal reduced to 42 ± 5% of baseline, which was significantly less than control values (t(5) = 11.3; p < 10−4) and less than with 30 min of incubation in l-NAME (t(14) = 5.3; p < 10−4). We also found that treating the wild-type mice with l-NAME (intraperitoneal injection at 75 mg/kg) for 2 d before preparing the slices, followed by 4 h incubation in l-NAME, further reduced the signal to 24 ± 7% of baseline values (t(2) = 10.2; p < 0.01) (Fig. 5B), confirming that most of the baseline signal could indeed be attributed to NOS activity.
We found that BMI/0Mg2+-evoked NO release was very different in αNOS1 and NOS3 knock-out animals. There was no significant increase in NO production in slices prepared from αNOS1 knock-out mice (increase of 4.5 ± 12% after treatment) (Fig. 5C). A two-way ANOVA showed a main effect of genotype (F(1,19) = 10.6; p < 0.005), which was due both to lower basal levels of NO (t(4) = 5.7; p < 0.005) and to the absence of BMI/0Mg2+ stimulated release in the NOS1 knock-out mice (t(5) = 0.27; p = 0.79). In contrast, slices taken from NOS3 knock-out mice showed a substantial increase in NO (128 ± 23% of control levels) (Fig. 5D). A two-way ANOVA showed a main effect of BMI/0Mg2+ treatment on NO levels (F(1,19) = 8.2; p < 0.02). Release of NO increased in both wild types and NOS3 knock-outs (t(4) = 3.1, p < 0.05; t(4) = 3.8, p < 0.05, respectively). Basal levels of release were again significantly lower in NOS3 knock-out mice compared with wild types (t(4) = 5.8; p < 0.005). The reason for the larger percentage increase in NO release in NOS3 knock-out mice compared with wild types was due to the lower basal level of NO in these animals (−40 ± 8% of wild-type levels) (Fig. 5D). These findings therefore provide direct evidence for the idea that tonic NO levels are controlled via both αNOS1 and NOS3 and that phasic release is controlled by NMDA receptor activation of αNOS1 (Hopper and Garthwaite, 2006). By inference, these results imply that NMDA receptor-dependent NO release is involved both in EDP and LTP in the cortex.
Given that the spontaneous bursts of spikes in cortical neurons treated with BMI/0Mg2+ produced NO, and that NO is sufficient for potentiation in the cortex (Hardingham and Fox, 2006), we tested whether the same treatment that evoked NO release also potentiated synapses in the layer IV to II/III cortical pathway. We monitored EPSPs 15 min before and 30 min after application of a solution containing bicuculline and lacking magnesium. Spontaneous bursts of spikes occurred at a similar frequency in layer II/III and layer V cells in the cortex (Table 1) and clearly required NMDA receptors because spike-bursts were abolished by the application of APV (Table 1). However, the spike-bursts were still present at normal frequencies either in wild types treated with l-NAME or in αNOS1 knock-outs (Fig. 6, Table 1), indicating that NO release occurred downstream of spike-bursts and NMDA receptor activation. Following spontaneous bursts of spikes, EPSPs evoked in the layer IV to II/III pathway were potentiated on average by 67 ± 21% (t(7) = 3.15; p < 0.02) (Fig. 6C). Potentiation was largely blocked by preincubating the slices in the NOS antagonist l-NAME (average, 10 ± 20%; t(5) = 0.50; p = 0.64). This confirms that activity capable of producing NMDA-dependent NO release via αNOS1 also simultaneously potentiates evoked EPSPs in the cortex (Fig. 6).
Frequency and duration of neuronal spike bursts observed in cells recorded in slices treated with 50 μm bicuculline metachloride and 0 Mg2+

Conditions that cause NMDA receptor-dependent NO release potentiates the IV to II/III pathway. A, Normalized average peak EPSP amplitudes are plotted for responses of layer II/III cells to stimulation of layer IV in the adjacent barrel. During the period indicated by the gray line, the solution is switched to one containing bicuculline and lacking magnesium. The EPSPs increase in magnitude during BMI/0Mg2+ application and are potentiated 30 min after washout of bicuculline and reintroduction of Mg2+ (black circles; 67 + 21%; p < 0.02; n = 8). The inset traces show example averaged EPSPs before (black) and after treatment (gray) and on the right superimposed. Preincubation of the slices with l-NAME prevents potentiation (white circles; 10 ± 20%; p = 0.64; n = 6). The level of potentiation with l-NAME treatment is significantly lower than without l-NAME (p < 0.05). B, Example of the spontaneous bursts of spikes recorded in a layer II/III cell from a wild-type animal during treatment with BMI/0Mg2+ (gray line). Seven spontaneous spike bursts are shown. C, An example of an individual spontaneous spike burst on an expanded time base. Note that spike bursts occurred in layer II/III and V cells with a similar rate and duration (Table 1). The incidence of spike bursts was similar in wild types treated with l-NAME and in αNOS1 knock-outs (Table 1), although NO release did not occur in these cases.
Receptive field structure, somatosensory responsivity, and barrel field morphology are similar in wild types, GluR1 and αNOS mutants
One potential problem that arises when studying knock-out mice is that the gene of interest may play a role during development of the brain and thereby indirectly affect plasticity in the adult. To test whether the knock-out mice had developed differently from wild-type animals, we measured the responses of layer II/III and IV neurons to stimulation of center and surround receptive field whiskers in adult animals (Fig. 7). In layer II/III, we found that the strength of response from the principal whisker and surround whiskers (Fig. 7A) did not interact with genotype (F(8,56) = 0.78; p > 0.05) nor was there a significant main effect of genotype (F(1,7) = 2.68; p > 0.05). A similar lack of effect was found for layer IV (Fig. 7B) using the same measures [receptive field strength by genotype (F(8,56) = 0.15; p > 0.05); genotype (F(1,7) = 0.06; p > 0.05)].
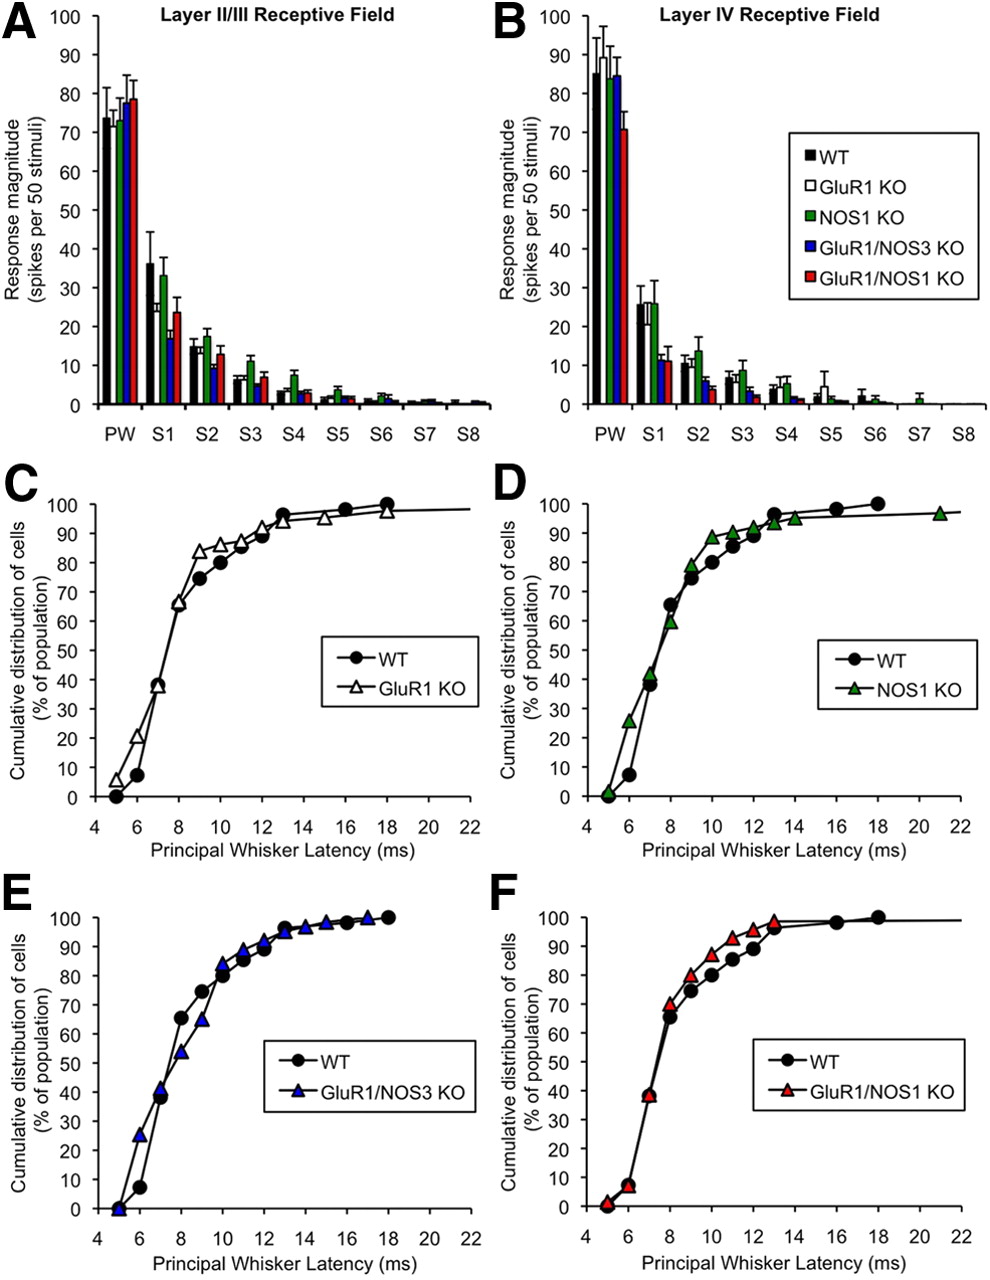
Receptive field structure and responsiveness in control (undeprived) cortex of wild type, GluR1, αNOS1, GluR1/αNOS1, and GluR1/NOS3 knock-outs. Responses to stimulation of the principal whisker (PW) and surround whiskers (S1–S8) are shown for layer II/III (A) and layer IV (B) cells in undeprived mutant animals (black, wild types; white, GluR1 knock-outs; green, αNOS1 knock-outs; blue, GluR1/αNOS1 double knock-outs; red, GluR1/NOS3 double knock-outs). Surround receptive field responses were ranked by magnitude for each cell and then averaged across cells. A two-way ANOVA was conducted using the factors of response strength (from PW to S8) and genotype. There was no significant main effect of genotype (F(1,7) = 2.68; p > 0.05), nor did the genotype affect the response strength within the receptive field (F(8,56) < 1; p > 0.05). B, As for A, but for layer IV cells. A two-way ANOVA did not reveal a significant main effect of genotype (F(1,7) < 1; p > 0.05) nor interactions between the response strength and genotype terms (F(8,56) < 1; p > 0.05). Error bars indicate SEM. C, Cumulative distribution functions are plotted for the latency of response (time to first spike) to stimulation of the principal whisker. The GluR1 knock-out mice show similar response latencies to wild types (two-sample Kolmogorov–Smirnov test; Dmax = 0.13; p > 0.05) as was also the case for αNOS1 knock-out mice (Dmax = 0.18; p > 0.05) (D), GluR1/NOS3 double-knock-out mice (Dmax = 0.18; p > 0.05) (E), and GluR1/αNOS1 double knock-outs (Dmax = 0.074; p > 0.05) (F).
In addition, the latency profiles for the responses within layer IV were similar across all genotypes (Fig. 7C–F), which again suggests that the strength of input to layer IV barrels and the synchrony of discharge within layer IV due to principal whisker stimulation is similar across genotypes.
As a test of whether the topography had developed normally in the knock-out animals, we also measured the size of the barrels and their spacing within the barrel field. The characteristic barrel field pattern was present in all the knock-out animals studied (Fig. 8). The individual barrel sizes were found to be similar for all genotypes as were the distances between barrels, indicating that a similar overall area of cortex was covered by the barrel field (for statistics, see Fig. 8). As a measure of the finer scale topography, we measured short-latency responses to principal whisker stimulation. The short-latency responses are thought to reflect direct input from thalamic axons and in wild-type mice are largely centered on the principal barrel for that whisker. In wild-type animals, 80% of cells in the home barrel received short-latency input from the principal whisker, while only 4.7% of cells showed short-latency responses outside the principal barrel. The spatial distribution of short-latency responses was also focused on the principal barrel for all the other genotypes and in none of the cases was significantly different from wild types (χ2 = 3.6; p > 0.05). These findings indicate that the somatotopic focus of the whiskers to particular barrels had developed similarly in the wild types and each of the knock-outs studied here.

Barrel morphology in GluR1, αNOS1, GluR1/αNOS1, and GluR1/NOS3 knock-out mice. Examples of barrel field sections cut through layer IV and stained for cytochrome oxidase in wild types (A), GluR1 knock-outs (B), αNOS1 knock-outs (C), GluR1/αNOS1 double knock-outs (D), and GluR1/NOS3 double knock-outs (E). Note that barrel morphology and size are similar between all genotypes. The arrow in B indicates the location of a microlesion made to record the position of the electrode penetration. Scale bar: (in E) 250 μm. F, The distance between the far edges of the barrels on a line passing through the center of the barrels was measured to investigate if the spacing between barrels was similar between genotypes. As shown in the histogram, the distances are all very similar to one another and statistically indistinguishable (one-way ANOVA; F(4,41) < 1; p > 0.05). G, Cross-section areas through individual D row barrels were very similar and sizes of barrels were statistically indistinguishable between all five genotypes. A two-way ANOVA revealed there to be no significant main effect of genotype (F(4,36) = 1.45; p > 0.05), and genotype did not influence the area of the barrels (F(16,144) = 1.44; p > 0.05). Error bars indicate SEM.
Finally, as an estimate of the amount of intracortical integration between columns in layer II/III, we analyzed the number of whiskers comprising the surround receptive fields in each genotype. In the barrel cortex, surround receptive fields of layer II/III cells are generated by intracortical transmission (Fox, 1994; Brumberg et al., 1999). We found that none of the knock-out mice had receptive field sizes that were different from wild-type mice (α = 0.05, Dunnett's test), suggesting that intracortical transmission was also unaffected by genotype.
Discussion
Our studies have shown that GluR1 and αNOS1 both play a role in cortical plasticity in adult animals. Previous studies on the role of GluR1 have focused on plasticity either in developing animals or in cell cultures derived from developing animals. For example, in hippocampus, mutating the C-terminal domain of GluR1 prevents LTP in slice cultures taken from P5–P7 animals (Shi et al., 2001). In barrel cortex, native homomeric GluR1 receptors are inserted into synapses of P13–P15 animals (Clem and Barth, 2006; Clem et al., 2008), and this process can be prevented by disrupting the C-terminal interactions of GluR1 at the same stage of development (P12–P14) (Takahashi et al., 2003). In visual cortex, the virally expressed C-terminal domain of GluR1 prevents a form of experience-dependent potentiation produced by increased exposure to a stimulus of a particular orientation during development (P26–P30) (Frenkel et al., 2006). In contrast, in this study, we have evaluated for the first time the GluR1 dependence of experience-dependent potentiation in much older animals (average age, 5 months) and found that, while GluR1 is responsible for a component of experience-dependent potentiation, it cannot account for the whole process. This is consistent with several studies that show that the GluR1 dependence of plasticity is developmentally regulated (Grosshans et al., 2002; Jensen et al., 2003). One reason for the decreased dependence of potentiation on GluR1 insertion in barrel cortex of older animals may relate to the decrease in spine turnover with age. New spines are thought to mature by AMPA receptor insertion (Takahashi et al., 2009). In barrel cortex, the density of transient spines (lasting <4 d) that might develop to form new synapses is far lower at 6 months of age than at P16–P24 (Holtmaat et al., 2005).
Despite the deficiencies in plasticity in the adult mutants, as far as we could tell from our measures, development of the barrel cortex was normal. For the single knock-outs, one could propose that GluR1 compensated during development in the αNOS1 knock-outs and αNOS1 compensated in the GluR1 knock-outs. However, as neither was present in the double knock-outs, at least one other form of plasticity must be involved. GluR4 is functionally similar to GluR1, is present in early development, and may be able to compensate for a lack of GluR1 during development but not in adults (Ritter et al., 2002; Esteban et al., 2003). Other plasticity mechanisms also occur during development that have a critical period and may not be available in the adult cortex. For example, in the visual cortex, ocular dominance plasticity consists of a strong depression of the response to the deprived eye and a potentiation of the response to the open eye. The depression component has a critical period and relies on a GluR2-dependent mechanism in layer IV (Yoon et al., 2009). The potentiation component of ocular dominance plasticity during the critical period appears most likely to involve a homeostatic response to depression of the closed eye (Mrsic-Flogel et al., 2007; Kaneko et al., 2008; Gainey et al., 2009; Toyoizumi and Miller, 2009; McCurry et al., 2010) and requires TNFα (Kaneko et al., 2008). It is plausible that the small changes in firing rate associated with whisker deprivation may not be sufficient to trigger this homeostatic mechanism in barrel cortex (Celikel et al., 2004) but may compensate for other plasticity mechanisms during development in the double knock-outs.
Previous studies have concluded that EDP in cat visual cortex does not depend on NO (Reid et al., 1996; Ruthazer et al., 1996). It may be simply that the mechanisms of critical period visual cortex plasticity and somatosensory adult plasticity differ. However, if NO is involved in visual cortex plasticity in the same way as in somatosensory cortex, the previous studies would have been unlikely to have revealed an NO component. Only a subcomponent of cortical potentiation depends on NO and blocking it still leaves the GluR1 mechanism present. In the current study, we were able to observe the NO component of potentiation more clearly by studying animals lacking the GluR1-dependent component (Fig. 2), which was not feasible in the earlier studies (Reid et al., 1996; Ruthazer et al., 1996). Furthermore, the visual cortex studies did not distinguish between potentiation and depression components of ocular dominance plasticity. Since ocular dominance plasticity is governed largely by depression of the deprived eye input, it is likely that an ocular dominance shift would still have occurred even if potentiation was significantly reduced by blockade of NOS.
Our studies show that, once the GluR1 component of LTP is removed, the residual plasticity can be entirely blocked by pharmacological antagonism of NO or by αNOS1 knock-out. In contrast, significant potentiation is still observed in the GluR1/NOS3 double-knock-out mice that is again largely NO dependent because it is completely abolished in vitro by l-NNA (and therefore also most probably requires αNOS1). In further support of the idea that there are dual GluR1 and NO components to potentiation, we note that vibrissae dominance plasticity still occurs in αNOS1 single knock-out animals, most likely by the intact GluR1 mechanism of potentiation (Fig. 3).
These studies raise the question of why NO is important for EDP. It is unlikely that αNOS1 acts by altering connectivity or cortical circuitry during development because measures of barrel field morphology and receptive field structure were normal in the knock-outs used in this study (Figs. 7, 8). It is also unlikely that αNOS1 acts by affecting dynamic blood flow (and hence in vivo cortical activity) as the hemodynamic response is normal in αNOS1 KOs (Ma et al., 1996) as is in vivo cortical activity (Fig. 7). Instead, the hemodynamic response appears to be controlled by astrocytes acting via the 20-HETE (20-hydroxyeicosatetraenoic acid), arachidonic acid pathway (Liu et al., 2008). The vascular location of NOS3 (Blackshaw et al., 2003) suggests that it plays a role in control of blood flow. However, a lack of NOS3 in the GluR1/NOS3 knock-outs did not decrease plasticity to levels below that expected in GluR1 single knock-outs.
It is known that αNOS1 is localized within pyramidal neurons and interneurons (Blackshaw et al., 2003) and is located in neocortical spines associated with NMDA receptors (Aoki et al., 1997; Husi et al., 2000; Valtschanoff and Weinberg, 2001). Therefore, αNOS1 is in an effective position to control NO release in response to synaptic activity. It has been suggested that NOS3 could produce a tonic level of NO that also affects plasticity (Hopper and Garthwaite, 2006). The finding that both GluR1/NOS1 and GluR1/NOS3 double knock-outs strongly reduce LTP in the hippocampus supports the idea (Phillips et al., 2008) as does our present finding that NOS3 partly controls basal levels of NO release in the cortex (Fig. 5D). However, NOS3 did not appear to affect plasticity in the barrel cortex and this might represent a mechanistic difference between the two brain regions.
One of the major targets for NO is soluble guanylate cyclase (sGC) via its heme-NO binding domain. Both isoforms of sGC are required for LTP in the hippocampus and visual cortex, suggesting NO acts simultaneously through two signaling pathways (Haghikia et al., 2007; Taqatqeh et al., 2009). It has been demonstrated that NO can increase CREB phosphorylation via PKG (cGMP-dependent protein kinase) in the hippocampus (Lu et al., 1999), and therefore, since CREB is known to play a partial role in plasticity in the barrel cortex (Glazewski et al., 1999; Barth et al., 2000), it may play a role in the in vivo plasticity described here. However, CREB phosphorylation probably acts over too long a time span to explain the NO dependence of LTP seen in the in vitro studies.
Theoretically, there are three non-mutually exclusive synaptic mechanisms by which NO might act. First, NO acting via sGC and cGKII can increases GluR1 insertion (Serulle et al., 2007); however, although this mechanism could work in wild types, it cannot account for the remaining plasticity in the GluR1 single and GluR1/NOS3 double knock-outs. Second, NO increases GluR2 heteromer insertion by direct nitrosylation of NSF (N-ethylmaleimide-sensitive factor) (Huang et al., 2005), but again this mechanism is unlikely to explain the results observed in the GluR1 single and GluR1/NOS3 double knock-outs since experience-dependent plasticity is directed by excitatory synaptic activity (Wallace et al., 2001) and synaptic insertion of GluR2-containing AMPA receptors occurs independent of synaptic activity (Zhu, 2009). Third, NO may act as a retrograde messenger to increase release probability, and there is certainly evidence for this mechanism in the neocortex (Volgushev et al., 2000; Hardingham and Fox, 2006; Sjöström et al., 2007). In addition, NO signaling via NOS1 causes presynaptic structural plasticity, including differentiation of axons into varicosities and formation of multiinnervated spines (Nikonenko et al., 2008). The balance of evidence therefore favors a presynaptic site of action for NO. However, the fact that NO could simultaneously affect postsynaptic receptor insertion of GluR1 and/or GluR2 in wild-type animals means that αNOS1 is in an excellent position to coordinate presynaptic and postsynaptic function during plasticity.
Footnotes
This work was supported by a grant from the Medical Research Council (United Kingdom) and a Conte Center grant from NIMH.
- Correspondence should be addressed to Prof. Kevin Fox, Cardiff School of Biosciences, Cardiff University, Cardiff CF10 3AX, UK. foxkd{at}cardiff.ac.uk


