

Article Figures & Data
Figures
- Figure 1.
Experience-dependent plasticity in barrel cortex: the spared whisker domain expands following deprivation in layer II/III in wild types, GluR1 and GluR1/NOS3 knock-outs, but not in GluR1/αNOS1 knock-outs. Each penetration represents the average response of layer II/III to D1 whisker stimulation in which recordings were made in at least three cells in layer II/III. Recording locations are identified from small (50 μm) lesions made in layer IV at the end of the recording penetration relative to the cytochrome oxidase-stained barrel field (Wong-Riley and Welt, 1980; Fox, 1994). The response level is color coded such that penetrations containing cells with the strongest average responses (R) are yellow (R ≥ 50 spikes per 50 stimuli), medium strength responses are coded green (50 > R ≥ 25), and the weakest responses, characteristic of control undeprived animals, are coded blue (R < 25 spikes per 50 stimuli). Top row, D1 whisker domains for control (undeprived) animals. Note that the strongest responses are evoked in cells largely confined to the D1 column. Bottom row, D1 domains for animals deprived of all but the D1 whisker for 18 d. The D1 barrel is shaded dark gray. Note that the D1 domain expands beyond the borders of the D1 barrel following deprivation.
- Figure 2.
Quantification of the effect of GluR1, GluR1/αNOS1, and GluR1/NOS3 knock-outs on experience-dependent potentiation of surround receptive field responses. Histograms show average D1 whisker responses for layer II/III cells recorded in barrels surrounding the D1 barrel. The black bars depict D1 responses in animals deprived of all but the D1 whisker for 18 d, followed by 7 d of regrowth, and the white bars show D1 whisker responses from undeprived control animals. *p < 0.05, **p < 0.01 for comparisons with the potentiated D1 response in deprived wild-type animals; ††p < 0.01, †††p < 0.001 for comparisons with the D1 response within the same genotype group in undeprived cases. Note that only GluR1/αNOS1 knock-outs show no potentiation at all. Error bars indicate SEM.
- Figure 3.
Effect of whisker deprivation on plasticity in barrel cortex in αNOS1 knock-out mice. A, Responses of layer II/III cells to stimulation of the D1 whisker in undeprived control animals. Each circle corresponds to a penetration comprising responses from at least 3 layer II/III cells. The highest levels of D1 response (R) are indicated in yellow (R ≥ 50 spikes per 50 stimuli), lowest in blue (R < 25), and intermediate in green (50 > R ≥ 25). B, Sparing the D1 whisker and removing the other whiskers on one side of the face causes an increase in the response of neurons in barrels surrounding D1 to stimulation of D1. The proportion of penetrations showing the higher levels of response increased from 13 to 59%, which was statistically significant (χ2 = 14.3; p < 10−3). C, Average responses to D1 whisker stimulation for cells lying in barrels immediately surrounding the D1 barrel. The spared whisker responses (black bar) potentiate significantly (t(22) = 3.13; **p < 0.005) by 129% compared with control undeprived levels (white bar). Error bars indicate SEM.
- Figure 4.
LTP is present in GluR1/NOS3 but not GluR1/αNOS1 knock-outs. LTP was induced by pairing four trains of 50 stimuli at 2 Hz with the postsynaptic spike timed to occur 10 ms after the presynaptic spike at the time indicated by the arrow. A, LTP was absent in GluR1/αNOS1 knock-outs (black circles; n = 18), and no further reduction in responses was observed with l-NNA in the electrode (white circles; n = 18). B, GluR1/NOS3 knock-outs showed normal wild-type levels of LTP (black circles; n = 20), but LTP was entirely abolished by including the NOS antagonist l-NNA in the recording electrode (white circles; n = 20). The circles represent mean EPSP amplitude for each time point averaged across cells; error bars are SEs per 10 stimuli. C, Quantification of the level of potentiation 60 min after pairing presynaptic and postsynaptic stimuli for cases with (white bars) and without l-NNA in the electrode (black bars). Significant levels of LTP are indicated as follows: +p < 0.05 and ++p < 0.01. Levels of LTP significantly different from wild-type (control) values are indicated as follows: *p < 0.05 and **p < 0.01. For wild types (WT), n = 24 with and n = 24 without l-NNA. For GluR1 knock-outs (GluR1), n = 18 with and without l-NNA. For GluR1/αNOS1 double knock-outs (GluR1/NOS1), n = 18 with and without l-NNA. For GluR1/NOS3 double knock-outs (GluR1/NOS3), n = 20 with and without l-NNA. D, Diagram to indicate the placement of the electrodes relative to the barrel columns in the slice and the timing of the presynaptic and postsynaptic spikes in the pairing protocol.
- Figure 5.
NMDA receptor-dependent NO release is αNOS1 dependent and basal NO levels are both αNOS1 and NOS3 dependent. A solution containing bicuculline and lacking magnesium (BMI/0Mg2+) results in spontaneous bursts of spikes in neocortex that activated NMDA receptors (Fig. 6) and generated NO. A, In wild types, the left-most two bars show that application of APV (50 μm; gray bar; n = 11) has no effect on basal levels of NO in untreated cortex (black bar; n = 11). The right-most two bars show that BMI/0Mg2+ causes an increase in NO production (black bar; n = 11) unless the cortex is pretreated with APV (gray bar; n = 11). B, Using the same convention as in A, in wild types BMI/0Mg2+ causes an increase in NO unless the cortex is pretreated with l-NAME (100 μm) 30 min beforehand (gray bar; n = 10). Thirty minutes of treatment with l-NAME did not produce a significant decrease in [NO] (gray bar; n = 10), but if the animals were injected with l-NAME 2 d previously, [NO] was significantly reduced (white bar; n = 3; p < 0.01). C, Basal levels of NO are significantly lower in αNOS1 knock-outs than wild types (n = 5 for both genotypes; p < 0.01). However, the increase in NO levels normally caused by BMI/0Mg2+ in wild types (black bar; n = 5) is not present in αNOS1 knock-outs (white bars; n = 5). D, Basal levels of NO are also significantly lower in NOS3 knock-outs (white bar; n = 5) than in wild types (black bar; n = 5; p < 0.01). However, the increase in NO production caused by BMI/0Mg2+ still occurs in NOS3 knock-outs (white bars; n = 5) and reaches similar levels to that seen in wild types (black bar; n = 5). NO values were normalized to the untreated wild-type condition in each case (indicated by the dashed line at unity). The amount of NO2− present in wild-type controls (over 30 min) was 15.4 ± 2.4 pm/mg (A), 7.4 ± 0.6 pm/mg (B), 9.1 ± 1.7 pm/mg (C), and 6.2 ± 1.2 pm/mg (D) (wet whole brain weight). *p < 0.05, **p < 0.01, NS, Not significant (p > 0.05). E, F, Calibration of the Griess assay for estimating NO concentration. Error bars indicate SEM. E, Concentrations of NO2− measured from solutions of increasing concentrations of NO donor (spermine NONOate; 0, 1, 10, and 100 μm). F, The same data as in E are plotted on logarithmic axes and show a linear relationship between [donor] and [NO2−] in the range of 1 to 10 μm. Our measures of [NO2−] from brain slices were within this range. Average basal levels of NO evolution (over 30 min) were equivalent to NO2− concentrations ranging from ∼2.8 to 7 μm, and stimulated values were between 69 and 128% greater than these. The point referring to a zero concentration of donor gave an NO2− concentration of 0.03 ± 0.03 μm.
- Figure 6.
Conditions that cause NMDA receptor-dependent NO release potentiates the IV to II/III pathway. A, Normalized average peak EPSP amplitudes are plotted for responses of layer II/III cells to stimulation of layer IV in the adjacent barrel. During the period indicated by the gray line, the solution is switched to one containing bicuculline and lacking magnesium. The EPSPs increase in magnitude during BMI/0Mg2+ application and are potentiated 30 min after washout of bicuculline and reintroduction of Mg2+ (black circles; 67 + 21%; p < 0.02; n = 8). The inset traces show example averaged EPSPs before (black) and after treatment (gray) and on the right superimposed. Preincubation of the slices with l-NAME prevents potentiation (white circles; 10 ± 20%; p = 0.64; n = 6). The level of potentiation with l-NAME treatment is significantly lower than without l-NAME (p < 0.05). B, Example of the spontaneous bursts of spikes recorded in a layer II/III cell from a wild-type animal during treatment with BMI/0Mg2+ (gray line). Seven spontaneous spike bursts are shown. C, An example of an individual spontaneous spike burst on an expanded time base. Note that spike bursts occurred in layer II/III and V cells with a similar rate and duration (Table 1). The incidence of spike bursts was similar in wild types treated with l-NAME and in αNOS1 knock-outs (Table 1), although NO release did not occur in these cases.
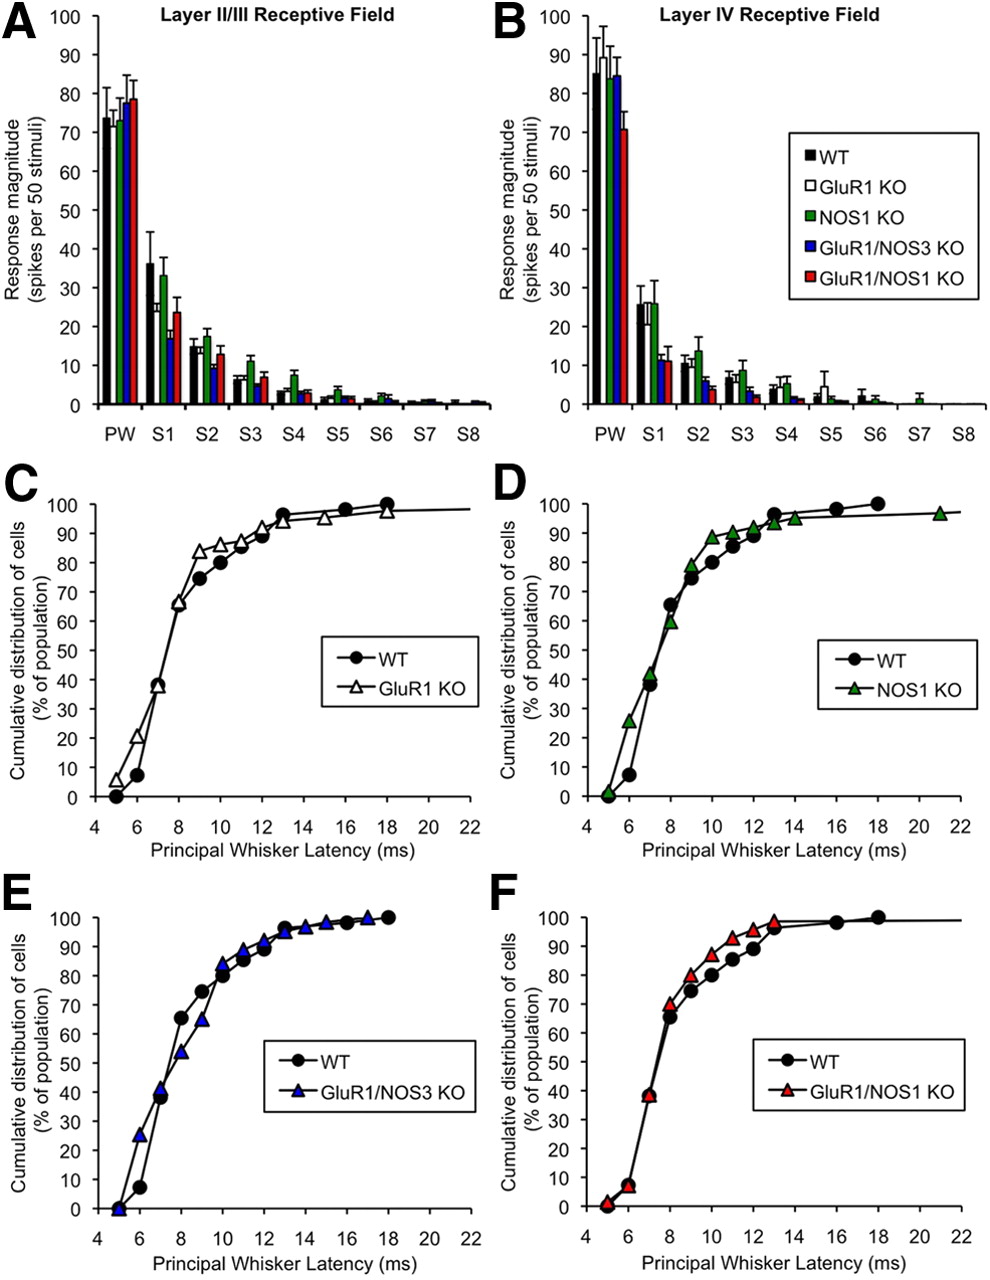
- Figure 7.
Receptive field structure and responsiveness in control (undeprived) cortex of wild type, GluR1, αNOS1, GluR1/αNOS1, and GluR1/NOS3 knock-outs. Responses to stimulation of the principal whisker (PW) and surround whiskers (S1–S8) are shown for layer II/III (A) and layer IV (B) cells in undeprived mutant animals (black, wild types; white, GluR1 knock-outs; green, αNOS1 knock-outs; blue, GluR1/αNOS1 double knock-outs; red, GluR1/NOS3 double knock-outs). Surround receptive field responses were ranked by magnitude for each cell and then averaged across cells. A two-way ANOVA was conducted using the factors of response strength (from PW to S8) and genotype. There was no significant main effect of genotype (F(1,7) = 2.68; p > 0.05), nor did the genotype affect the response strength within the receptive field (F(8,56) < 1; p > 0.05). B, As for A, but for layer IV cells. A two-way ANOVA did not reveal a significant main effect of genotype (F(1,7) < 1; p > 0.05) nor interactions between the response strength and genotype terms (F(8,56) < 1; p > 0.05). Error bars indicate SEM. C, Cumulative distribution functions are plotted for the latency of response (time to first spike) to stimulation of the principal whisker. The GluR1 knock-out mice show similar response latencies to wild types (two-sample Kolmogorov–Smirnov test; Dmax = 0.13; p > 0.05) as was also the case for αNOS1 knock-out mice (Dmax = 0.18; p > 0.05) (D), GluR1/NOS3 double-knock-out mice (Dmax = 0.18; p > 0.05) (E), and GluR1/αNOS1 double knock-outs (Dmax = 0.074; p > 0.05) (F).
- Figure 8.
Barrel morphology in GluR1, αNOS1, GluR1/αNOS1, and GluR1/NOS3 knock-out mice. Examples of barrel field sections cut through layer IV and stained for cytochrome oxidase in wild types (A), GluR1 knock-outs (B), αNOS1 knock-outs (C), GluR1/αNOS1 double knock-outs (D), and GluR1/NOS3 double knock-outs (E). Note that barrel morphology and size are similar between all genotypes. The arrow in B indicates the location of a microlesion made to record the position of the electrode penetration. Scale bar: (in E) 250 μm. F, The distance between the far edges of the barrels on a line passing through the center of the barrels was measured to investigate if the spacing between barrels was similar between genotypes. As shown in the histogram, the distances are all very similar to one another and statistically indistinguishable (one-way ANOVA; F(4,41) < 1; p > 0.05). G, Cross-section areas through individual D row barrels were very similar and sizes of barrels were statistically indistinguishable between all five genotypes. A two-way ANOVA revealed there to be no significant main effect of genotype (F(4,36) = 1.45; p > 0.05), and genotype did not influence the area of the barrels (F(16,144) = 1.44; p > 0.05). Error bars indicate SEM.


Tables
- Table 1.
Frequency and duration of neuronal spike bursts observed in cells recorded in slices treated with 50 μm bicuculline metachloride and 0 Mg2+
Cell type Burst frequency (per min) Burst duration (s) Layer 2/3 cortex (n = 5) 1.40 ± 0.35 1.49 ± 0.44 Layer 5 cortex (n = 5) 1.56 ± 0.42 1.36 ± 0.40 Cortex WT control (n = 10) 1.47 ± 0.26 1.44 ± 0.28 Cortex WT l-NAME (n = 4) 1.43 ± 0.31 0.74 ± 0.22 Cortex WT APV (n = 4) 0 0 Cortex αNOS1 KO (n = 4) 1.05 ± 0.09 1.32 ± 0.60 The top two rows describe spike burst frequencies and durations for neurons recorded in cortical layers 2/3 and 5 in slices superfused with modified aCSF containing 50 μm bicuculline metachloride and 0 Mg2+. Neurons did not spontaneously fire spike bursts in control aCSF. The bottom four rows show averaged cortical spike burst properties for layer 2/3 and layer 5 neurons recorded in the presence of the NOS antagonist l-NAME (100 μm), the NMDA antagonist APV (50 μm), and in the αNOS1 knock-out mice. Note that the spike bursts were present in l-NAME, while APV completely blocked bursts. Spike bursts were also of normal duration and frequency in αNOS1 knock-out mice (p > 0.05 for comparison of frequency and duration).


