

Article Figures & Data
Figures
- Figure 1.
a, b, Distance run (a), and body weight changes (b) over a 6 week period. Means ± SEM are plotted. a, Rats (n = 16) ran an average of 1028 ± 120 m the first week of the study, and showed a steady decrease over the course of the study with distances stabilizing ∼470 ± 67 m in weeks 5 and 6. b, Inset (starting body weights), A one-way ANOVA showed that there were no differences in body weight at the start of the study among the 3 groups: F(2,31) = 0.87, p > 0.05; n = 8–16. Percentage body weight changes over 6 weeks, A repeated-measures ANOVA showed there was a significant main effect of physical activity (sedentary, locked, runners), F(2,29) = 42.12, p < 0.0001; a significant main effect of time, F(5,10) = 8.02, p < 0.0001; and a significant physical activity × time interaction, F(10,145) = 7.90, p < 0.0001. Fisher's post hoc tests revealed that runners (n = 16) had lost significantly more weight than did both sedentary rats (n = 8) and those with a locked wheel (n = 8) beginning with the first week of the study and continuing on through the last (p < 0.0001, each week). Rats housed with a locked wheel also showed a weight reduction compared with sedentary rats, but these were only significant beginning on week 4 and continuing through week 6 (p < 0.01, each week). Sedentary rats gained an average of 0.55%, while rats housed with locked wheels lost an average of 1.73%, and runners lost an average of 5.52% of their starting weight.
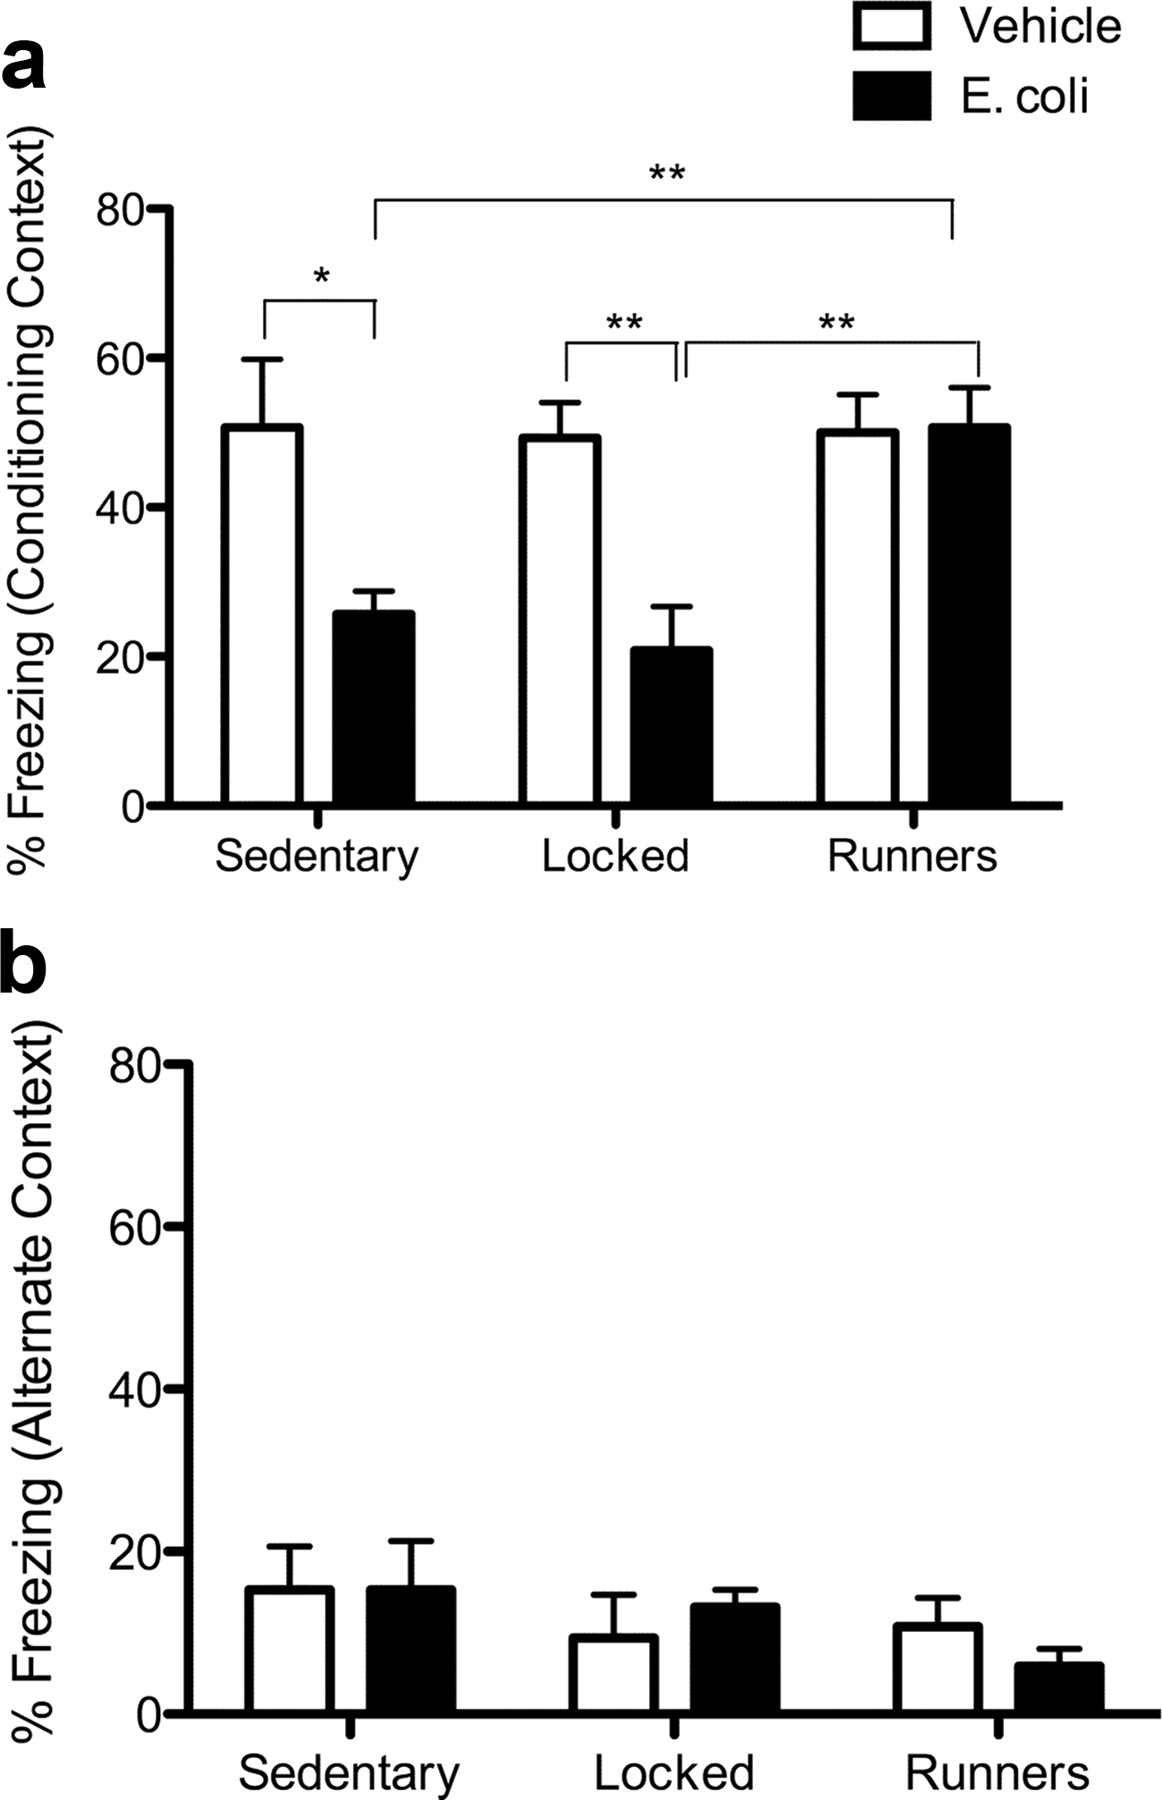
- Figure 2.
a, b, Freezing to the conditioned fear context (a) and an alternate context with conditioning having occurred 4 d after immune challenge (b) in 24-month-old rats, following 6 weeks of physical activity. Means ± SEM are plotted. a, There was a significant main effect of physical activity (sedentary, locked, runners), F(2,26) = 4.12, p < 0.03, and a significant main effect of immune challenge (vehicle, E. coli), F(1,26) = 11.91, p < 0.002. There was also a significant physical activity × immune challenge interaction (F(2,26) = 4.05, p < 0.03). Fisher's post hoc tests revealed that sedentary E. coli-treated rats (n = 4) froze significantly less than vehicle-treated controls (p < 0.05; n = 4) and E. coli-treated runners (p < 0.01; n = 8). Locked-wheel E. coli-treated rats (n = 4) also froze significantly less than vehicle controls (p < 0.01; n = 4) and E. coli-treated runners (p < 0.01). E, coli-treated runners showed no difference from their vehicle controls (p > 0.05; n = 8). b, In the alternate context there was not a main effect, either of physical activity, F(2,26) = 1.58, p > 0.05, or of immune challenge F(1,26) = 0.011, p > 0.05.
- Figure 3.
a, BDNF mRNA expression levels in CA1 region of the hippocampus 2 h after conditioning in rats that received either vehicle or E. coli 4 d before conditioning. Percentages of vehicle HCC ± SEM are plotted. There was a significant main effect of physical activity (HCC, sedentary, locked, runners), F(3,43) = 50.144, p < 0.0001, and a significant main effect of immune challenge (vehicle, E. coli) F(1,43) = 8.698, p < 0.005. There was also a significant physical activity × immune challenge interaction (F(3,43) = 3.14, p < 0.04). Fisher's post hoc tests showed that all conditioned groups had significantly greater BDNF expression than did vehicle-treated HCC rats. Vehicle-treated HCC (n = 5) BDNF levels did not differ significantly from those of E. coli-treated HCC rats (p > 0.05; n = 6). Vehicle-treated runners (n = 9) exhibited greater BDNF expression compared with vehicle-treated locked wheel rats (p < 0.05; n = 6), but not compared with vehicle-treated sedentary rats (n = 6). Sedentary E. coli-treated rats (n = 6) exhibited significantly blunted BDNF expression compared with their vehicle controls (p < 0.05) and E. coli-treated runners (p < 0.0005; n = 8). BDNF mRNA levels from locked-wheeled E. coli-treated rats (n = 5) were also significantly lower compared with their vehicle-treated controls (p < 0.01) and E. coli-treated runners (p < 0.0001). BDNF mRNA levels in E. coli-treated runners did not differ from their vehicle-treated controls (p = 0.80). b, c, Representative photomicrographs of vehicle-treated HCC (non-conditioned) (b) and conditioned hippocampal (c) slices.
- Figure 4.
a, b, IL-1β protein levels in hippocampus (a) and liver (b) 4 d after immune challenge in animals that were housed with a running wheel, a locked wheel, or no wheel for 6 weeks. Means ± SEM are plotted. a, Hippocampus. There was a significant main effect of physical activity (sedentary, locked, runners), F(2,35) = 6.11, p > 0.005, a significant main effect of immune challenge (vehicle, E. coli), F(1,35) = 15.21, p < 0.0005, and a significant physical activity × immune challenge interaction, F(2,35) = 3.57, p < 0.05. Fisher's post hoc tests showed that all vehicle-treated rats exhibited comparable IL-1β protein levels, and did not differ across conditions. Sedentary E. coli-treated IL-1β levels (n = 5) were significantly higher compared with their vehicle controls (p < 0.01; n = 6), E. coli-treated locked-wheel rats (p < 0.05; n = 5), and E. coli-treated runners (p < 0.0005; n = 8). Hippocampal IL-1β levels of locked-wheeled E. coli-treated rats were also significantly higher compared with their vehicle-treated controls (p < 0.005; n = 6) and E. coli-treated runners (p = 0.05). IL-1β levels in E. coli-treated runners were not different from their vehicle-treated controls (p = 0.73; n = 11). b, Liver. There was a significant main effect of physical activity, F(2,36) = 5.18, p < 0.05, a significant main effect of immune challenge, F(1,36) = 41.98, p < 0.0001, and a significant physical activity × immune challenge interaction, F(2,36) = 6.05, p < 0.005. Again, all vehicle-treated rats exhibited comparable IL-1β protein levels, and did not differ across activity conditions. However, IL-1β levels in sedentary E. coli-treated rats (n = 7) were significantly higher compared with their vehicle controls (p < 0.0005; n = 7), E. coli-treated locked wheel rats (p < 0.05; n = 4), and E. coli-treated runners (p < 0.05; n = 8). Liver IL-1β levels of locked wheel E. coli-treated rats were also significantly higher compared with their vehicle-treated controls (p < 0.0001; n = 5), but not different from E. coli-treated runners (p > 0.05). Liver IL-1β levels in E. coli-treated runners were also significantly higher compared with their vehicle-treated controls (p < 0.001; n = 11).
- Figure 5.
a–c, TNFα (a), IL-1β (b), and IL-6 (c) gene expression in isolated microglia 2 h following stimulation with increasing doses of LPS. Means ± SEM are plotted; n = 4 in each group. a, TNFα. There was a significant main effect of physical activity (locked, runners), F(1,24) = 37.03, p < 0.001, a significant main effect of LPS dose (0, 0.1, 1, 10, 100 ng), F(4,24) = 206.29, p < 0.0001, and a significant physical activity × LPS dose interaction, F(4,24) = 22.45, p < 0.0001. At all doses of LPS, even the 0 ng dose, TNF gene expression was significantly higher in microglia of locked wheel rats than that of runners (p < 0.05). b, IL-1β. There was a significant main effect of physical activity, F(1,24) = 17.23, p < 0.01, a significant main effect of LPS dose, F(4,24) = 224.78, p < 0.0001, and a significant physical activity × LPS dose interaction, F(4,24) = 4.07, p < 0.01. IL-1β gene expression was significantly higher in microglia of locked wheel rats than that of runners at the 0 ng (p < 0.002), 0.1 ng (p = 0.05), 1 ng (p < 0.01), and 10 ng (p < 0.05) doses, but not the 100 ng dose (p > 0.05). c, IL-6. There was no significant main effect of physical activity, F(1,24) = 4.35, p > 0.05, a significant main effect of LPS dose, F(4,24) = 117.19, p < 0.0001, and a significant physical activity × LPS dose interaction, F(4,24) = 7.35, p < 0.0005. IL-6 gene expression was significantly higher in microglia of locked wheel rats than that of runners only at the 100 ng dose (p < 0.005).


