

Article Figures & Data
Figures
- Figure 1.
Intrinsic fast and slow gamma coupling is a unique property of subicular circuits. A, Diagrammatic representation of the isolated hippocampus and the locations in which LFPs were simultaneously measured from the subiculum (SUB), CA1, and CA3 and the septal (S) and temporal (T) end of the hippocampus. B, Mean ± SE amplitude of gamma bursts detected in the three regions. C, Example filtered LFP data simultaneously recorded from the SUB, CA1, and CA3 in the SG, FG, and theta bands. The filtered theta trace was taken from the subiculum. The red dashed lines are shown to visually align the traces to the peak of theta. D, Example cross-frequency coupling plots from CA3 (top), CA1 (middle), and SUB (bottom). Adjacent to the plots is the mean ± SE theta phase modulation index for 11 experiments for each region. E, Significant theta coherence was present between the subiculum and CA3 and subiculum and CA1, and theta coherence was greater between CA1 and subiculum. However, frequencies above 30 Hz were not coherent between the subiculum and CA1 or CA3, suggesting that gamma does not arise from the CA3–CA1 axis. F, Mean power spectrums from experiments in which the subiculum was isolated compared with the intact hippocampus. Data for these experiments were collected from hippocampi in which the subiculum was removed from CA1 and compared with data collected from the hippocampi of the opposite hemisphere or from a littermate on the same day of recording. Theta frequency was reduced when the subiculum was isolated, but intrinsic theta was still present. G, The mean ± SE theta phase MI plots for experiments with the isolated subiculum and intact preparation. Theta phase–gamma amplitude coupling was still present in the isolated subiculum. *p < 0.05, **p < 0.01.
- Figure 2.
Slow and fast gamma rhythm power fluctuate independently. A, The cross-correlation matrix expressing the probability of significant amplitude–amplitude coupling between all frequencies (from 1 to 250 Hz) from all experiments (n = 101). This matrix represents the probability that the spectral amplitude of each pair of frequencies would be significantly correlated in an experiment. The matrix is symmetrical across the diagonal. Clusters near the diagonal reflect neural rhythms and clusters off the diagonal reflect covariation in power between two frequencies (for example theta and FG). The white box outlines the region highlighting the correlation between SG power and FG power, indicating that there is a very low covariation in power and therefore these two frequencies undergo independent dynamic changes in amplitude. B, The mean ± SE correlation coefficients for the correlation between theta and SG (left), theta and FG (middle), and SG and FG (right). **p < 0.001.
- Figure 3.
Current source density of subicular rhythms. A, CSD was performed through the deep-superficial axis of the subiculum (SUB), using a reference electrode located just below the pyramidal cell layer (PYR). Shown are representative CSDs for one experiment for theta, SG, and FG. The mean current traces are shown above the heat maps for the electrode locations indicated on the left. A reference electrode located near the 16-channel probe was used to trigger the data from 3 min of a continuous recording. To generate the averages, the peak of the filtered theta, SG, or FG was detected in the reference, and the CSD in all channels was collected centered on these events (white dashed lines). The black arrows indicate the maximum CSD alternation for each frequency band. B, A closer look at the data in A, showing the presence of phase shifts for all three rhythms. The dashed line indicates the time of the peak theta, SG, or FG LFP recorded from the reference electrode and used to trigger the current from each channel for the three frequencies. C, The mean absolute CSD fluctuations across depth. Note that currents for all rhythms are maximally located within the same 500 μm, but the FG current maximum is closer to the pyramidal cell layer. D, The correlation coefficient between SG and FG current magnitude using SG current peaks (left) and FG current peaks (right). SG and FG current peaks were detected using an amplitude threshold (mean ± 3 SD). This analysis therefore measures the covariation between SG and FG current during large-amplitude current bursts of each frequency.
- Figure 4.
Slow and fast gamma independently phase lock to theta rhythms. A, Example cross-frequency coupling plots showing the amplitude modulation of all frequencies (5–250 Hz) by the phase of low frequencies (1–12 Hz). Five examples are shown to highlight the effect theta frequency has on the gamma coupling dynamics. The plots are ordered from slower to faster theta frequency (left to right). Note that slower theta frequencies had greater SG coupling, whereas fast theta frequencies were dominated more by FG. The color map depicts the strength of phase–amplitude coupling between pairs of frequencies calculated using the modulation index (see Methods and Materials). The scale is the MI × 1000. On the right is the histogram of preferred theta frequency in all experiments (n = 101). Theta frequency was divided into three frequency bands for the comparison of theta–gamma modulation index analyses. The vertical lines indicate the cutoff frequencies used for analysis. B, The theta phase modulation index (spanning 5–300 Hz) for the three theta frequency bands. Note the change in SG modulation across theta frequency. Dark lines are the mean across the number of experiments indicated, and shaded regions are the SE. C, Quantification of the peak SG and FG frequency across the different theta frequencies. The peak SG frequency increased as theta frequency increased. Right, The magnitude of phase modulation decreased with greater theta frequency for SG but not FG. The ratio of FG MI to SG MI increased with increased theta frequency. D, The factors predicting changes in SG and FG amplitude modulation to theta phase. The mean ± SE β coefficients (b) from multiple linear regression analysis using SG MI (top) or FG MI (bottom) as the dependent variable and theta power, SG power, FG power, and SG MI (top) or FG MI (bottom) as predictors. To obtain the data for each regression analysis, the power and MI was calculated in 6 s bins over the duration of 5–30 min recordings. The best predictor of SG MI was SG power, suggesting that increases in SG power were associated with a stronger phase coupling to theta phase. Note that the FG MI did not help in the prediction of SG MI. The FG MI was also best predicted by FG power rather than theta power, SG power, or SG MI. E, FG does not arise from a harmonic of SG. Shown is an example plot of the theta phase MI across frequencies from 5 to 250 Hz. The green arrow is the dominant SG frequency, and the solid green lines are the five first harmonics of the main SG frequency. If FG arises from a harmonic of SG, the FG peak will align with one of the SG harmonics, which is not the case here (black arrow). Below is the mean ± SE minimum difference between the FG peak frequency and closest SG harmonic. *p < 0.001.
- Figure 5.
Slow and fast gamma independently arise within the theta cycle. A, Four theta cycles are shown (top to bottom) with significant SG only, FG only, both SG and FG, or no gamma. On the right, the mean average short time Fourier transform generated spectrogram centered on theta peak (time 0) for all waves during one experimental session. Mean spectrograms were created from all theta waves with SG only, FG only, both SG and FG, or no gamma. B, Distribution of the preferred theta phase for SG or FG for all experiments. FG occurred slightly later in the theta cycle. C, The percentage of theta cycles with either SG or FG was greater than the number of theta cycles with both forms of gamma. D, The amplitude of co-occurring SG (y-axis) and FG (x-axis) is shown for one experiment for each theta cycle with both forms of gamma, and a correlation coefficient was calculated between the maximum amplitudes of SG and FG. The red line is the linear fit. Below is the scatter plot of the correlation coefficient between SG and FG amplitude for all experiments showing that the peak amplitudes of SG and FG were not related. The red line indicates the grand experimental mean. *p < 0.01.
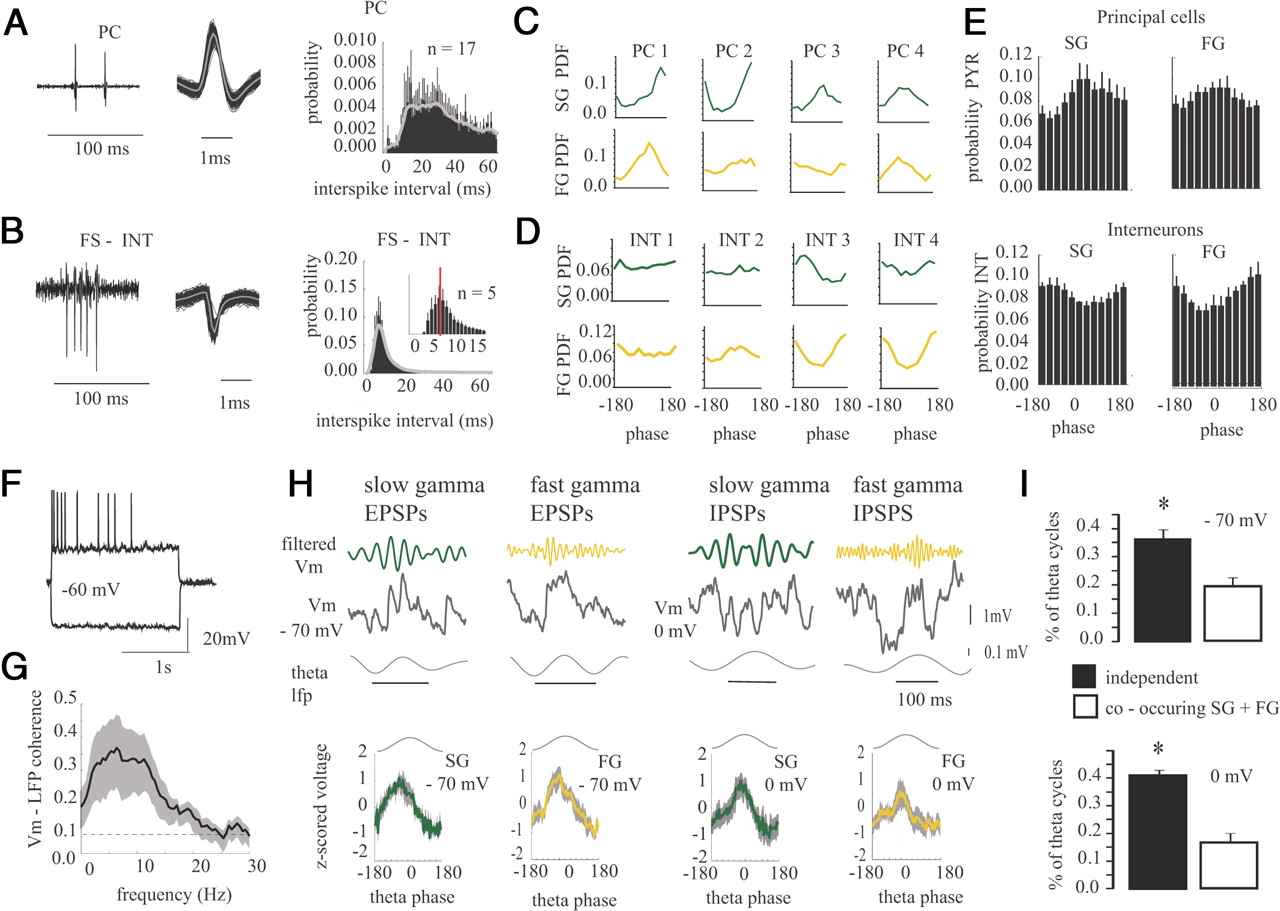
- Figure 6.
Phase locking of excitatory and inhibitory events to slow and fast gamma. Raw data and mean spike waveform for a representative principal cell (PR, A) and fast-spiking interneuron (INT, B) On the right is the mean ISI for all principal cells (top) and interneurons (bottom). Note the peak in the interneuron ISI at FG periods (expanded in the inset), whereas the principal cells have a broad distribution over the 20–40 ms range. C, D, The spike phase probability distribution for eight subicular neurons, including four principal cells (PC, C) and four interneurons (INT, D) for slow and fast gamma. E, Mean ± SE phase-locking histograms for all principal cells and interneurons during SG and FG. Note that, although the preferred phase is somewhat diverse, principal cells on average fire near the peak of SG and FG, whereas on average, interneurons show the greatest depth of modulation on the trough of both SG and FG. F, An example whole-cell recording of a principal cell in the subiculum during depolarizing and hyperpolarizing current steps. G, Mean ± SE coherence between the whole-cell recording and extracellular LFP. H, Postsynaptic potentials recorded at both −70 mV (left) and 0 mV (right). Example theta cycles are shown, demonstrating that both SG and FG potentials occur during the rising phase of the theta rhythm, similar to extracellular events. Traces above the raw Vm were bandpass filtered in the SG (green) and FG (gold) frequency bands. Below is the mean ± SE of the normalized voltage fluctuations within the theta cycle for SG and FG at both 0 and −70 mV. The plot shows the mean z-scored voltage for the envelope of the filtered SG or FG signal. I, The percentage of theta cycles with statistically significant SG or FG is greater than the number of cycles with both forms of gamma at both holding potentials. *p < 0.05.
- Figure 7.
Slow and fast gamma independently modulate spike phase locking in the same neural network. A, Top, An example trace showing spiking from a subicular principal cell and the simultaneously recorded SG and FG from a nearby (0.1 mm) electrode. B, Left, Spikes arising during stronger SG were more tightly phase locked to SG phase. The same trend was found for FG (right). Spike phase locking was compared during “strong” and “weak” amplitude activity in the respective frequency band using the same number of spikes (see Materials and Methods). The overall mean phase-locking value for each cell was normalized to 1. Note that almost all cells are above the mean value for strong gamma and below the mean for weak gamma. C, Shown are three representative data epochs showing the simultaneously recorded slow gamma (SG, top), fast gamma (FG, middle), and principal cell spiking (bottom, recorded with a separate pipette). The gamma traces shown were bandpass filtered in the SG (25–55 Hz) or FG (80–180 Hz) frequency range. The SG and FG amplitude envelope is also shown on top of each filtered gamma trace and was calculated using the absolute value of the Hilbert transformed signal. The three traces represent the three conditions used for analyzing spike–phase locking during the presence or absence of either SG or FG (not shown is the presence of spiking during no gamma). The presence or absence of gamma in each band at the time of each spike was determined by an amplitude threshold (see Materials and Methods). D, The number of spikes recorded during each of the different gamma conditions. Spikes were more likely to fire during SG or FG in isolation then during co-occurring SG and FG. E, Phase locking of spikes to SG (left) or FG (middle) during the presence or absence of each form of gamma rhythm. On the left is the phase-locking probability for one neuron for SG and FG during the states indicated. Note the increase in SG phase locking during spikes occurring with both SG and FG, whereas FG phase locking does not exhibit this facilitation. Right, Group data across all neurons. Similar to above, the overall mean resultant length was normalized to 1; therefore, a value of 1 would indicate that the strength of phase locking did not change above the overall experimental mean resultant length (using all spikes regardless of gamma amplitude), and values 1 would indicate that phase locking in the specific condition was increased. *p < 0.01, **p < 0.001.
- Figure 8.
Excitation and inhibition differentially control slow and fast gamma. A, Pharmacology of SG and FG. Field potentials were analyzed during baseline and during the application of drugs to block fast GABAergic (BMI, 10 μm) and glutamatergic (DNQX, 10 μm) transmission. Filtered traces within each frequency band and conditions are shown. The red lines indicate the threshold (mean ± 2 SD) for significant gamma events. The dashed boxes indicate the expanded trace shown below. The effects of DNQX and BMI were tested in different experiments. Note that activity in the SG and FG bands is not eliminated by either drug on its own. The scale bars on the bottom apply to all traces. B, Representative power spectrums from experiments with bicuculline (left) and DNQX, followed by DNQX plus bicuculline (right). The insets are a magnified view showing the effect on FG. C, Normalized group mean spectral power in each gamma band during DNQX, BMI, DNQX plus BMI, and APV. The data segments analyzed were taken from 3–6 min after bath application of the drugs. Both SG and FG spectral power were reduced by BMI (top left). SG but not FG spectral power was reduced by DNQX (top right). Coapplication of BMI and DNQX reduced SG and FG power (bottom left). Neither SG nor FG was on average reduced by NMDA receptor blockade using APV (bottom right). *p < 0.05.
- Figure 9.
Intrinsic topographical organization of slow and fast gamma in the subiculum. A, Diagrammatic representation of the whole hippocampus with arrows indicating the axes within which theta, SG, and FG coherence was measured. S, Septal; T, temporal. B, The topography of theta, SG, and FG. Coherence was measured in the proximal–distal (blue), septal–temporal (red), and deep-superficial subicular axes (black). Coherence is plotted as a function of absolute distance. #p < 0.05, *p < 0.01. Note that SG coherence is reduced with distance but is still above the significance threshold (the color above each point indicates the post hoc comparison between the deep-superficial axis and the other color-coded axes). FG coherence drops below the significance level at distances >300 μm. The dashed line is the 95% significance threshold. C, Spike–LFP phase locking between local and distant (1 mm) regions of the subiculum. i, Diagrammatic representation of the experiment in which LFPs from local and distant electrodes were recorded together with spikes next to the local electrode. ii, The phase-locking strength (mean resultant length) is shown and compared between the local LFP electrode and the distant LFP electrode for SG. Filtered LFP traces are shown for SG from the local and distant electrode. All spikes were phase locked to the local SG, and 13 of 21 cells were phase locked to SG in the distant subicular electrode. iii, The same as in ii for FG. Note how the three spikes fire on a similar phase of the local FG but on different phases of FG from the distant electrode because of a slightly slower FG network frequency. D, On the left is a representative histological section showing the location of electrodes located in the proximal and distal subiculum. The mean normalized theta MI plots are shown for the proximal and distal subiculum. The proximal and distal subiculum prefer different ratios of SG and FG, and the distal subiculum has a greater preference for FG whereas the proximal subiculum preferred SG. Black lines are the mean, and gray shading indicates the SE. E, An example phase–amplitude modulation index plot is shown for simultaneously recorded field potentials in the proximal and distal subiculum, demonstrating that the distal subiculum exhibits a higher FG frequency.


