

Abstract
Telomere and telomerase alterations have been reported in mood disorders. However, the role of telomerase in depression remains unclear. Here we show that chronic mild stress (CMS) led to a significant decrease in telomerase reverse transcriptase (TERT) level and telomerase activity in the hippocampus. Treatment with antidepressant fluoxetine reversed the CMS-induced TERT and telomerase activity changes. Inhibiting telomerase by systemic administration (100 mg · kg−1 · d−1, i.p., for 14 d), intrahippocampal microinjection (0.7 μmol, 2 μl), or infusion (using an osmotic minipump, 0.134 μg/μl, 0.25 μl/h) of 3′-azido-deoxythymidine (AZT) resulted in depression-like behaviors and impaired hippocampal neurogenesis in mice. In contrast, overexpressing telomerase by intrahippocampal infusion of recombinant adenovirus vector expressing mouse TERT (Ad-mTERT-GFP) led to neurogenesis upregulation, produced antidepressant-like behaviors, and prevented the CMS-induced behavioral modifications. Disrupting neurogenesis in the dentate gyrus by X-irradiation (15 Gy) of a restricted region of mouse brain containing the hippocampus abolished the antidepressant-like effect of Ad-mTERT-GFP. Additionally, AZT had no effect on DNA polymerase activity and did not cause cell damage in vitro and in vivo. Microinjection of AZT into the subventricular zone of lateral ventricle (0.7 μmol, 2 μl) inhibited local neurogenesis but had no behavioral effect. These results suggest that hippocampal telomerase is involved in the modulation of depression-related behaviors, possibly by regulating adult neurogenesis.
Introduction
The hippocampus is one of several limbic brain structures implicated in the pathophysiology and treatment of mood disorders (Warner-Schmidt and Duman, 2006). Several lines of evidence suggest implications of adult hippocampal neurogenesis in antidepressant action (Santarelli et al., 2003; Kodama et al., 2004; Malberg, 2004; Dranovsky and Hen, 2006; Airan et al., 2007; Perera et al., 2007; Sahay and Hen, 2007). Stress, which triggers bouts of depression (Tsankova et al., 2006), suppresses adult hippocampal neurogenesis (Jacobs et al., 2000; Czeh et al., 2001), and antidepressant drugs counteract this effect (Czeh et al., 2001). Moreover, irradiation of the hippocampus, which reduces hippocampal neurogenesis, abolishes the behavioral and proliferative effects of many different antidepressants (Santarelli et al., 2003; Airan et al., 2007).
Telomere length is essential for the prolonged persistence of stem cell function in organs with extensive cell turnover (Flores et al., 2006, 2008). In proliferative cells, telomere length is maintained by telomerase, a DNA polymerase that consists of an RNA component (TERC) and a catalytic subunit, telomerase reverse transcriptase (TERT), and adds six-base DNA repeats (TTAGGG) onto the telomeric ends of chromosomes (Feng et al., 1995; Blackburn, 2001). Telomerase is present at high levels in neural progenitor cells in the developing (Klapper et al., 2001; Cai et al., 2002) and adult (Caporaso et al., 2003) brain. Recently, telomere dysfunction in peripheral leukocytes has been described in psychiatric conditions. Accelerated telomere shortening and decreased telomerase activity has been reported in chronically stressed individuals (Epel et al., 2004), mood disorders (Simon et al., 2006), and schizophrenia (Kao et al., 2008; Porton et al., 2008). Moreover, mouse TERT (mTERT)-deficient mice exhibited significantly altered anxiety-like behaviors (Lee et al., 2010). Thus, telomerase may be involved in the procedure of adult neurogenesis and the regulation of mood behaviors. Here we investigated the effects of telomerase inhibition or overexpression on depression-related behaviors and hippocampal neurogenesis and reported that hippocampal telomerase plays a role in the modulation of depression-related behaviors via regulating adult neurogenesis.
Materials and Methods
Mice
C57BL/6 mice (Model Animal Research Center of Nanjing University), weighing 18–22 g, were used for the experimental procedures. Mice were allowed 1 week to acclimate before experimentation. Animals were housed in plastic cages with bedding. Food and tap water were available ad libitum for the duration of the experiments unless otherwise noted. The temperature was maintained at 22 ± 2°C. A 12 h light/dark cycle was maintained, with lights on at 6:00 A.M. The experimental protocol was approved by the Institutional Animal Care and Use Committee of Nanjing Medical University.
Drugs
5-Bromo-2′-deoxyuridine (BrdU) and Azidothymidine [3′-azido-3′-deoxythymidine (AZT)] were purchased from Sigma-Aldrich.
Chronic mild stress and behavioral measures
The procedure of chronic mild stress (CMS) was designed as described previously (Ducottet et al., 2003). In brief, the CMS protocol consists of the sequential application of a variety of mild stressors, including restraint, forced swimming, water and/or food deprivation, and pairing with another stressed animal in wet sawdust, housing in wet sawdust, reversal of the light/dark cycle, and housing in constant illumination or darkness each for a period ranging from 10 min to 24 h, in a schedule that lasts for 3 weeks. The schedule is repeated thereafter from week 1.
Tail suspension test.
Mice were moved from the housing room to the testing area in their home cages and allowed to adapt to the new environment for at least 1 h before testing. Mice were suspended by their tail with adhesive tape to a hook in a soundproof box. The total duration of immobility during a 6 min test was calculated.
Forced swimming test.
Mice were individually forced to swim in an open glass cylinder (diameter, 28 cm; height, 33 cm) that was filled with water at 25 ± 1°C to a depth of 20 cm. The total duration of immobility during a 6 min test was scored. Each mouse was judged to be immobile when it ceased struggling and remained floating motionless in the water, making only those movements necessary to keep its head above water. Water was replaced between every trial. After swim sessions, mice were removed from the cylinder, dried with a towel, and placed underneath a heating lamp for ∼30 min before being returned to their home cages.
Sucrose preference test.
The sucrose preference test (SPT) was performed as described previously (Grippo et al., 2005). In brief, an SPT consisted of first removing the food and water from each mouse's cage for a period of 20 h. Water and 1% sucrose were then placed on the cages in preweighed plastic bottles, and animals were allowed to consume the fluids for a period of 10 h. The bottles were then removed and weighed. Fluid intake was calculated as a preference score (percentage sucrose preference, relative to total fluid intake).
Open field test.
The test arena was constructed of a plastic plate (56.13 × 56.13 cm) and divided into 256 squares. It was surrounded by a 35.18-cm-high plastic wall. Each mouse was placed onto a corner square of the arena, facing the corner, and was allowed to freely explore the open field for 5 min per trial. The number of squares crossed with all paws (crossing) was counted in a 5 min session as horizontal activity, and the number of rearing (stood on its hind legs with the forepaws free) and leaning (stood on its hind legs with one or two forepaws against the wall) positions was noted in a 5 min session as vertical activity. After each trial, the plate was cleaned with 70% EtOH.
Cell cultures
Adult NSCs were isolated and cultured as described previously (Luo et al., 2010], with some modifications. In brief, the dentate gyri of 2-month-old female mice (10 mice were used in each primary isolation experiment) were dissected and digested with 0.125% trypsin (Invitrogen) and 250 U/ml DNase I (Sigma-Aldrich) at 37°C for 20 min, and undifferentiated progenitors were enriched by centrifugation with Percoll (GE Healthcare Bio-Sciences). Cells were floating cultured in proliferation medium containing 20 ng/ml basic fibroblast growth factor (Sigma-Aldrich), 20 ng/ml epidermal growth factor (Sigma-Aldrich), and 2% B27 supplement (Grand Island) and passaged every 4–6 d. Adult NSCs of the second to fourth passage were used in this study.
Primary hippocampal neurons were isolated from an embryonic day 18 mouse and cultured in neurobasal medium (Invitrogen) containing 2% B27 supplement as reported (Luo et al., 2010). Cultured neurons were identified at 10 d in vitro, and the proportion of β-III-tubulin+ cells was about 92%.
Adenovirus production and infection in vivo
The coding sequence of mTERT was amplified by RT-PCR. The primer sequences were as follows: forward, 5′-GTAGAACGCAGATCGAATTCATGACCCGCGCTCCTCG-3′; reverse, 5′-CCCTTGCTCACCATGAATTCGTCCAAAATGGTCTGAAAGTC-3′. The PCR fragments and the pDC315-GFP plasmid were digested with EcoR I and ligated with T4 DNA ligase to produce pDC315-mTERT-GFP. The plasmid was used to transform competent DH5α Escherichia coli bacterial strains for identification. Using 10 μl of Lipofectamine 2000 mixed with 50 μl of DMEM, HEK293 cells were cotransfected with 5 μg of the pDC315-GFP plasmid with a cDNA encoding mTERT and 5 μg of the pBHG lox ΔE1,3 Cre plasmid as a helper plasmid to generate the recombinant adenovirus, Ad-mTERT-GFP. After 8 d, supernatant was harvested from HEK293 cells. After 3 times the virus amplification, the supernatant was filtered at 0.45 μm and purified using the Adeno-X Virus Purification kit. After resuspension, serially diluted adenovirus was used to transduce HEK293 cells. Seven days later, labeled HEK293 cells were counted to calculate the viral titer (∼2.5 × 10¹⁰ pfu/ml).
Ad-mTERT-GFP and Ad-GFP (control) were transfected into mouse hippocampus by stereotaxic microinjection at 1 μl per dentate gyrus (DG). Five days later, mice were perfused transcardially, and serial brain sections (40 μm) were made. Effects of transfection in vivo could be observed by fluorescence microscope.
Microinjection and infusion of AZT
Adult mice were anesthetized with 0.07 ml of a mixture of ketamine (90.9 mg/ml) and xylazine (9.1 mg/ml) and placed in a stereotaxic apparatus. AZT was dissolved in a solution (physiological saline/polyethylene glycol 400, 4:1). The AZT solution in 2 μl volume was microinjected into the DG (0.2 μl/min) at coordinates 2.3 mm posterior to bregma, 1.3 mm lateral to the midline, and 2.0 mm below dura (Munoz et al., 2005), or into the subventricular zone (SVZ) of the anterior part of the lateral ventricle (0.2 μl/min) at coordinates 1 mm anterior to bregma, 1 mm lateral to the midline, and 2.3 mm below dura (Yoon et al., 1996). For the osmotic pump infusion, a 7 or 28 d Alzet osmotic minipump containing AZT (6.7 μg/50 μl for 7 d or 26.8 μg/200 μl for 28 d) was placed subcutaneously in the back of the animals, and a brain infusion cannula connected to the pump was positioned at the following coordinates: 2.3 mm posterior to bregma, 1.3 mm lateral to the midline, and 2.0 mm below dura (Munoz et al., 2005). The infusion rate was 0.25 μl/h. We anesthetized mice with a mixture of ketamine (90.9 mg/ml) and xylazine (9.1 mg/ml) and removed the osmotic pump after infusing AZT solution for 7 or 28 d.
Hippocampal X-irradiation
X-irradiation was performed according to a modified version of a procedure reported previously (Santarelli et al., 2003). Briefly, mice were anesthetized with 0.07 ml of a mixture of ketamine (90.9 mg/ml) and xylazine (9.1 mg/ml), placed in a stereotaxic apparatus, and exposed to cranial irradiation using therapeutical x-ray equipment operated at 300 kVp and 20 mA. Mice were protected with a lead shield that covered the entire body, with the exception of a 3.2 × 11 mm treatment field above the hippocampus. The corrected dose rate was ∼3 Gy/min at a source-to-skin distance of 100 cm. The procedure lasted 1 min and 42 s, delivering a total of 5 Gy each time.
Experiment 1.
For the 10 Gy dose group, two 5 Gy doses were delivered to the hippocampus of mice on days 0 and 4, respectively. For the 15 Gy dose group, three 5 Gy doses were delivered on days 0, 4, and 8, respectively. To assess the effects of this procedure on the survival of newly born cells, mice were given injections of BrdU (four times, 50 mg/kg, i.p., at 6 h intervals) on day 12. Behavioral tests were performed on day 36, and animals were killed on day 40 for BrdU staining.
Experiment 2.
Three 5 Gy doses were delivered on days 6, 10, and 14 after Ad-mTERT-GFP intrahippocampal infusion, respectively. To assess the effects of this procedure on newborn cell survival, mice were given injections of BrdU (four times, 50 mg/kg, i.p., at 6 h intervals) on day 18. Behavioral tests were performed on day 34. Animals were killed on day 46, and brain slices were prepared for BrdU staining.
Immunocytochemistry and cell counting
The mice were anesthetized with chloral hydrate (30 mg kg−1, i.p.) and perfused transcardially with saline followed by 4% paraformaldehyde. Brains were removed and postfixed overnight in the same solution. Serial sections (40 μm) were made on an oscillating tissue slicer in a bath of physiological saline. Every fifth section throughout the hippocampus or SVZ was processed for BrdU immunohistochemistry as described previously (Zhu et al., 2003). All BrdU-labeled cells in the DG or SVZ were counted in each section by another experimenter blinded to the study code. The total number of BrdU-labeled cells per section was determined.
Fluoro-Jade and terminal deoxynucleotidyl transferase-mediated dUTP nick-end labeling staining
Neuronal degeneration was determined by Fluoro-Jade (FJ; Histo-Chem) staining. In brief, sections were washed and mounted on glass slides and dried overnight. The slides were immersed for 3 min in absolute ethanol, for 1 min in 70% ethanol, and for 1 min in distilled water and transferred to a solution containing 0.01% Fluoro-Jade and 0.1% acetic acid for 30 min on a shaker. After three 10 min washes, the slides were finally coverslipped, and we used the terminal deoxynucleotidyl transferase-mediated dUTP nick-end labeling (TUNEL) method to identify cell apoptosis (Schwob et al., 2008).
RT-PCR
Total RNA was extracted from the hippocampus using Trizol reagent according to the manufacturer's instructions (Invitrogen). The primers for mTERT and β-actin were as follows: mTERT: forward, 5′-ATGGCGTTCCTGAGTATG-3′; reverse, 5′-TTCAACCGCAAGACCGACAG-3′; β-actin: forward, 5′-CACGATGGAGGGGCCGGACTCATC-3′; reverse, 5′-TAAAGACCTCTATGCCAACACAGT-3′. PCR conditions were 30 cycles of denaturation at 94°C for 45 s, annealing at 65°C for 45 s, and extension at 72°C for 45 s. PCR products were separated by electrophoresis through a 1.5% agarose gel containing 0.5% μg/ml ethidium bromide and imaged using a BioDoc-IT imaging system (Bio-Rad).
Western blotting analysis
Samples from hippocampal tissues of mice were prepared as described in our previous studies (Luo et al., 2010). The samples containing equivalent amounts of protein (10 μg) were applied to 8% acrylamide denaturing gels (SDS-PAGE). The separated proteins were transferred onto nitrocellulose membranes overnight at 4°C. Blotting membranes were incubated with blocking solution [5% nonfat dried milk powder dissolved in TBST buffer (pH 7.5, 10 mm Tris-HCl, 150 mm NaCl, and 0.1% Tween 20)] for 1 h at room temperature, washed three times, and incubated with rabbit anti-mTERT (1:2000; Santa Cruz Biotechnology) in TBST overnight at 4°C. Internal control was performed using β-actin antibody (1:1000; Sigma-Aldrich). After several washes with TBST buffer, the membranes were incubated for 1 h with a horseradish peroxidase-linked secondary antibody (1:10,000). The membranes were then processed with enhanced chemiluminescence Western blotting detection reagents (Pierce). The films were scanned, and densitometry was performed using the Quantity One image software (Bio-Rad). The relative level of the protein was quantified from the scanned films.
Telomerase activity assay
Telomeric repeat amplification protocol (TRAP) reactions were performed using the TRAPEZE XL telomerase detection kit (Millipore), following the manufacturer's instructions. The telomerase activity was detected with TRAP (Kim et al., 1994) with some modifications. The fluorescence energy transfer primers were used to generate fluorescently labeled TRAP products, which were quantitatively measured with a fluorescence plate reader (SpectraMax M2e) or visualized after terminal deoxynucleotidyl transferase-mediated dUTP nick-end labeling on a 10% nondenaturing gel and SYBR Green I (Invitrogen) staining.
DNA polymerase activity assay
DNA polymerase activities were measured as described previously (Tang et al. 2003) with some modifications. We synthesized three short oligonucleotides: N1, template, 5′-CTGAGGAGAAGTCTGCCGTTACTGCCCTGTGGGGCTAGGTGAA-3′; N2, primer matched to template, 5′-AGTTCACCTA-3′; N3, primer with one base mismatched to template at 3′ end, 5′-AGTTCACCTT-3′. The hippocampus was homogenized in ice-cold saline and centrifuged at 12,000 × g for 10 min at 4°C. The supernatants were collected, and the protein concentration was measured. A solution (199 μl) containing 50 mmol/l Tris-HCl, pH 8.0, 5 nmol/l MgCl2, 1 mmol/l DTT, 50 μmol/l dNTP mixture, 1× SYBR I, 100 nmol/l N1, and 100 nmol/l N2 (for the negative control, 100 nmol/l N3) was put in the spectraMax M2e system for monitoring the fluorescent signal at 520 nm (excited at 497 nm). After the value of fluorescent signal was stabilized, 1 μl of supernatant or DNA polymerase I [Klenow fragment (KF), positive control] was added into the solution. Then, fluorescence measurements were performed immediately (0 s) and at 200, 400s 600, and 800 s, respectively.
Cell viability of neurons and NSCs
Cell injury was assessed by staining with a membrane-impermeable DNA-binding dye, propidium iodide (PI; Invitrogen), and counterstaining with Hoechst 33258. More specifically, after incubation with neurobasal medium containing PI (1 μg/ml) for 15 min, cells were washed three times with PBS and fixed with 4% paraformaldehyde (in PBS) for 20 min at room temperature. Cells were then permeabilized with 0.2% Triton X-100 (in PBS) for 5 min on ice and washed twice with PBS containing Hoechst 33258 (10 μg/ml). For the NSCs, cells were then incubated with mouse anti-nestin (1:100; Sigma-Aldrich) at 4°C overnight. Subsequently, under fluorescent microscopy, red (PI), blue (Hoechst 33258), and green (nestin) fluorescent images were captured to determine the number of injured cells and the total number of cells, respectively. Five different visual fields per culture dish were evaluated.
Cell apoptosis analysis with PI staining by flow cytometry
To evaluate the extent of apoptotic and necrotic cells, a live-cell suspension was prepared from the hippocampus of mice using 0.1% papain as described previously (Jhaveri et al., 2010). Cells were harvested and fixed with 70% prechilled ethanol for at least 12 h at −20°C. After washing twice with PBS, 25 μl of 1 mg/ml Rnase was added and incubated for 30 min at 37°C. The cells were stained with 25 μl of 1 mg/ml PI in the dark for 30 min at 37°C. The DNA content was analyzed by flow cytometry (Becton Dickinson) using a laser with 488 nm excitation and 560 nm emission. The peak of hypodiploid DNA below G1 was regarded as the apoptosic peak. Proliferation (percentage) was expressed as (%S + %G2)/(%S + %G1 + %G2).
Statistical analyses
Comparisons among multiple groups were made with one-way ANOVA followed by Scheffe's post hoc test. Comparisons between two groups were made with the two-tailed Student's t test. Data were presented as mean ± SEM; p < 0.05 was considered statistically significant.
Results
Implication of hippocampal telomerase alterations in depressive behaviors
CMS has been proposed as a classical chronic stress model of depression (Willner, 1997). Accordingly, we investigated whether CMS exposure changes telomerase expression and activity. CMS exposure for 21 d led to a significant decrease in telomerase activity in the hippocampus [19.71 ± 1.47 vs 33.01 ± 8.32 total product generated (TPG) units; n = 3–4; p = 0.0288] (Fig. 1A), suggesting a correlation of chronic stress with telomerase. To examine whether antidepressant affects the CMS-induced telomerase change, we treated mice with fluoxetine (10 mg · kg−1 · d−1, i.p.), a selective serotonin reuptake inhibitor, from day 22 to day 49 during 49 d CMS exposure and measured TERT level and telomerase activity in the hippocampus and immobility time in the tail suspension test (TST). Mice exposed to CMS for 49 d displayed a significantly decreased TERT protein level (F(2,6) = 54.17; p = 0.000) (Fig. 1B) and telomerase activities (F(2,9) = 9.27; p = 0.009) (Fig. 1C) and prolonged latency in the TST (151.2 ± 8.3 vs 82.0 ± 4.6 s, CMS vs control; F(2,30) = 18.83; p = 0.000; n = 9–12). Fluoxetine treatments reversed the CMS-induced TERT (F(2,6) = 54.17; p = 0.01) (Fig. 1B) and telomerase (F(2,9) = 9.27; p = 0.030) activity alterations (Fig. 1C) and immobility time prolongation (151.2 ± 8.3 vs 97.7 ± 9.7 s, CMS vs fluoxetine; F(2,30) = 18.83; p = 0.000; n = 12).

Implication of hippocampal telomerase alterations in depressive behaviors. A, Representative SYBR Green I-stained gel visualizing telomerase activity by TRAP products in the hippocampus of mice exposed to CMS for 21 d. Negative control 1, Taq enzyme-free control; Negative control 2, cell-free control; Positive control, cell line expressing a high level of telomerase; Heat-inactivated control, positive control sample incubated at 85°C for 10 min before the assay. Arrowheads indicate the key bands. B, Immunoblots showing protein level of TERT in the hippocampus of mice (n = 3). C, Telomerase activity in the hippocampus of mice (n = 3). In B and C, the mice were exposed to CMS for 49 d and treated with fluoxetine or vehicle during the last 28 d of CMS. D, Left, Representative DG area with Ad-mTERT-GFP transfection. Middle, Higher magnification of the boxed area. Right, RT-PCR analysis showing mRNA levels of mTERT in the hippocampus (n = 3). E, Immobility time in the TST in mice treated with Ad-mTERT-GFP or Ad-GFP at 3 or 28 d after intrahippocampal microinjection (n = 10–12). F–I, Effects of intrahippocampal Ad-mTERT-GFP transfection on CMS-induced behavioral modifications. Ad-mTERT-GFP or Ad-GFP was delivered into the bilateral DG of mice by microinjection; 4 d later, the mice were exposed to CMS for 21 d, and their body weight gain (F), immobility time in the TST (G) and FST (H), and sucrose preference (I) were examined on the next day (n = 13–16). Data are mean ± SEM. *p < 0.05, compared with control (A–C) or with Ad-GFP (E–I); #p < 0.05, compared with CMS (B, C) or with Ad-GFP/CMS (F–I).
To further investigate whether hippocampal telomerase is implicated in depression-related behaviors, we generated an adenovirus vector that selectively expresses mTERT with a fused green fluorescent protein (GFP) at its C terminal and named it Ad-mTERT-GFP. As a control, we also generated an adenovirus vector that expresses GFP alone (Ad-GFP). We infused Ad-mTERT-GFP or Ad-GFP into the bilateral DG of mice by stereotaxic injection. At day 5 after transfection, numerous GFP+ cells were observed in the DG, and the mRNA level of mTERT was obviously increased (vs Ad-GFP), indicating a TERT overexpression (Fig. 1D). The mice treated with Ad-mTERT-GFP displayed a significantly decreased immobility time in the TST at day 28 (F(1,21) = 8.83; p < 0.01), but not at day 3 after transfection, compared with Ad-GFP (Fig. 1E). In addition, Ad-mTERT-GFP had no effect on the locomotor activity at both time points (data not shown). Thus, TERT overexpression in the hippocampus produces an antidepressive-like effect in a delayed time manner.
To determine whether hippocampal TERT overexpression affects CMS-induced behavioral modifications, we delivered 2 μl of Ad-mTERT-GFP or Ad-GFP by microinjection into the bilateral DG of mice. Four days later, we exposed the mice to CMS for 21 d and performed behavioral tests the next day. The mice exposed to CMS diminished body weight gain (F(2,42) = 72.17; p = 0.000) (Fig. 1F), displayed a significantly increased immobility time in the TST (F(2,42) = 6.58; p = 0.013) (Fig. 1G) and forced swimming test (FST) (F(2,42) = 7.05; p = 0.026) (Fig. 1H), and displayed a significantly decreased percentage sucrose preference (F(2,42) = 21.29; p = 0.000) (Fig. 1I) compared with control. Intrahippocampal Ad-mTERT-GFP microinjection prevented the CMS-induced immobility time prolongation in the TST (F(2,42) = 6.58; p = 0.012) (Fig. 1G) and sucrose preference reduction (F(2,42) = 21.29; p = 0.000) (Fig. 1I) and ameliorated body weight gain (F(2,42) = 72.17; p = 0.045(Fig. 1F), indicating that TERT overexpression is protective against the behavioral effects of CMS paradigm.
Inhibiting hippocampal telomerase results in depressive-like phenotype
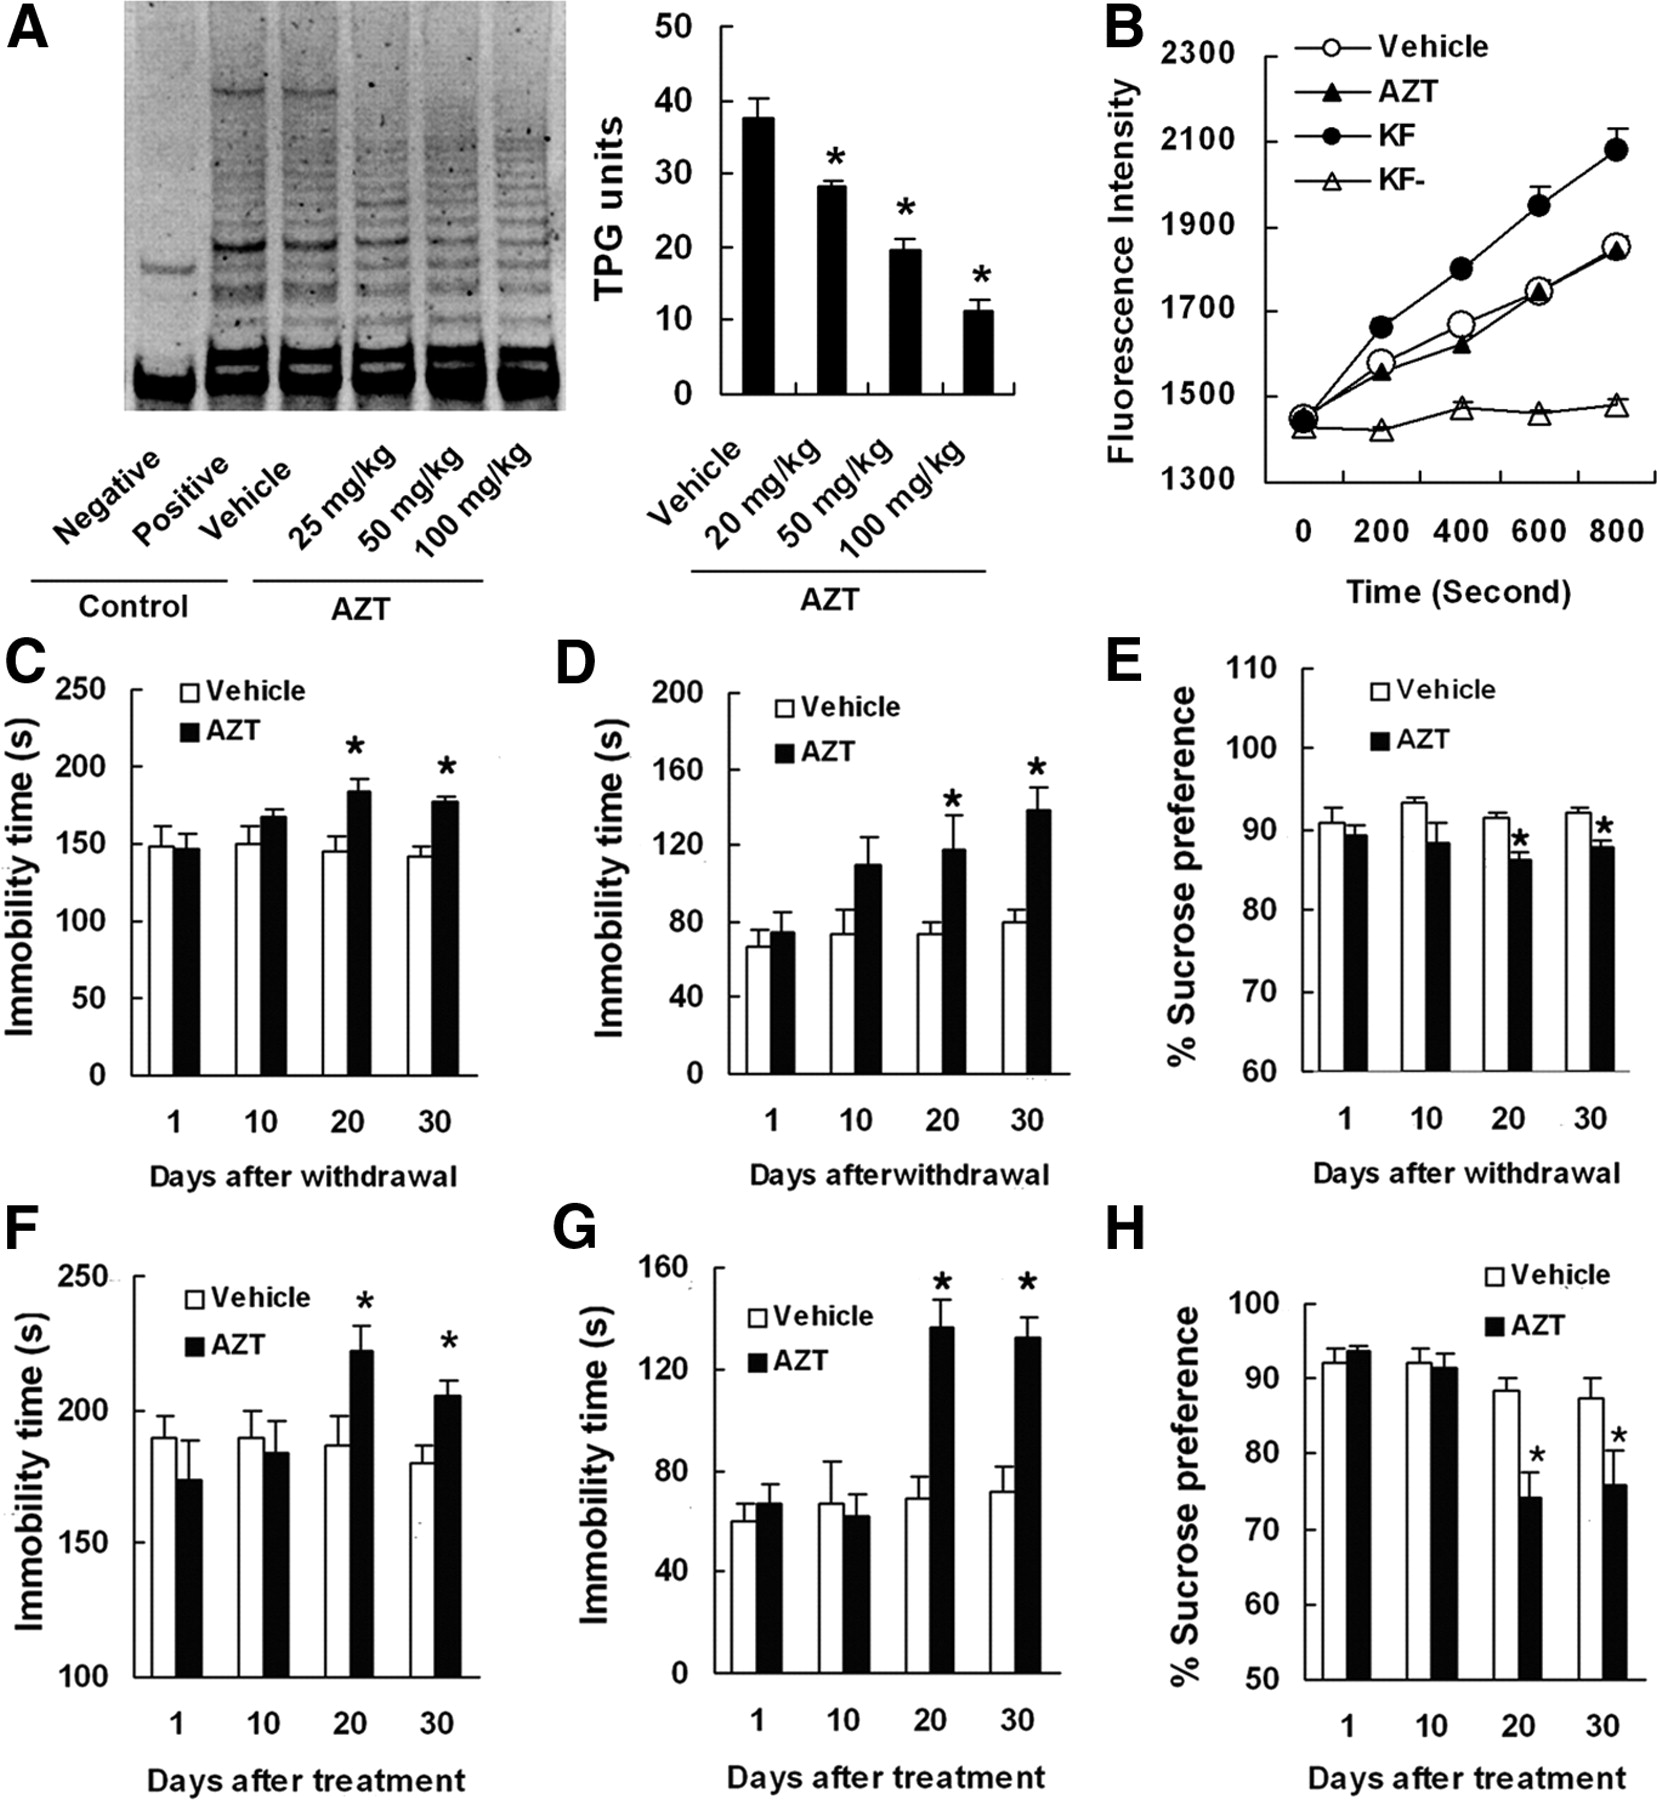
To test whether telomerase inhibition produces depression-related behavior, we treated mice with AZT (a telomerase inhibitor; 25, 50, or 100 mg · kg−1 · d−1, i.p.) for 14 d. As shown in Figure 2A, AZT inhibited telomerase activities in the hippocampus dose-dependently [75.3% (F(3,8) = 37.48; p = 0.049), 51.6% (F(3,8) = 37.48; p = 0.001), and 29.3% (F(3,8) = 37.48; p = 0.000) of vehicle for 25, 50, and 100 mg · kg−1 · d−1, respectively]. However, 100 mg · kg−1 · d−1 AZT had no effect on DNA polymerase activity (Fig. 2B).

AZT inhibits telomerase activity and produces depressive-like phenotype. A, Representative SYBR Green I-stained gel visualizing TRAP products (left) and telomerase activity (right) in the hippocampus of mice treated with 25, 50, or 100 mg/kg AZT for 7 d (n = 3). Negative control, Taq enzyme-free control; positive control, cell line expressing high levels of telomerase. B, Time scan of fluorescence intensity of samples showing DNA polymerase activity in the hippocampus of mice treated with 100 mg/kg AZT or vehicle for 7 d (n = 3). KF, Klenow fragment (DNA polymerase I), a positive control; KF−, without KF, a negative control. C–H, Effects of AZT on behavioral phenotype. Shown are the immobility time in the TST (C) and FST (D) and percentage sucrose preference (E) of the mice treated with AZT (100 mg/kg, i.p.) for 14 d at the time indicated after withdrawal (n = 10) and the immobility time in the TST (F) and FST (G) and percentage sucrose preference (H) of the mice treated with intrahippocampal AZT microinjection (0.7 μmol, 2 μl) at the time indicated after microinjections (n = 9–11). Data are mean ± SEM. *p < 0.05, compared with vehicle.
Next, we treated mice with AZT (100 mg · kg−1 · d−1) for 14 d and measured behaviors at day 1, 10, 20, or 30 after withdrawal. The mice treated with AZT displayed a significantly increased immobility time in the TST (at day 20: F(1,18) = 9.74, p < 0.01; at day 30: F(1,18) = 7.96, p < 0.01; Fig. 2C) and in the FST (at day 10: F(1,18) = 4.81, p < 0.05; at day 20: F(1,18) = 6.93, p < 0.05; at day 30: F(1,18) = 12.48, p < 0.01; Fig. 2D) and a significantly decreased percentage sucrose preference (at day 10: F(1,18) = 5.98, p < 0.05; at day 20: F(1,18) = 7.67, p < 0.01; at day 30: F(1,18) = 4.55, p < 0.05; Fig. 2E), compared with vehicle. However, AZT did not change the immobility time in the TST and FST and percentage sucrose preference at 1 d after withdrawal (p > 0.05), and it also did not change immobility time in the TST at 10 d after withdrawal (F(1,18) = 1.85; p = 0.1786). In addition, AZT treatment did not influence body weight gain at day 30 after withdrawal [at day 15 after withdrawal: AZT, 3.01 ± 0.27 g; vehicle, 3.13 ± 0.39 g (n = 10; p = 0.802); at day 30 after withdrawal: AZT, 6.54 ± 0.34 g; vehicle, 6.71 ± 0.50 g (n = 10, p = 0.78)].
However, the intraperitoneal injection may cause systemic effects. To test whether hippocampal telomerase inhibition results in a depressive-like phenotype, we delivered AZT (0.7 μmol, 2 μl) solution into the bilateral DG of the hippocampus by stereotaxic surgery. Immobility in the TST and FST and sensitivity to reward in the SPT were examined at day 1, 10, 20, or 30 after AZT microinjection. The mice treated with intrahippocampal AZT displayed a significantly increased immobility time in the TST (at day 20: F(1,17) = 9.32, p < 0.01; at day 30: F(1,17) = 5.46, p < 0.05; Fig. 2F) and in the FST (at day 20: F(1,17) = 21.14, p < 0.0001; at day 30: F(1,16) = 16.65, p < 0.0001; Fig. 2G) and a significantly decreased percentage sucrose preference (at day 20: F(1,16) = 15.90, p < 0.001; at day 30: F(1,16) = 9.61, p < 0.01; Fig. 2H), compared with vehicle. However, AZT did not change immobility time in the TST and FST and percentage sucrose preference either at day 1 or day 10 after treatment (p > 0.05) (Fig. 2F–H).
Additionally, we conducted locomotion studies in the open field test in parallel with the TST and FST studies to identify potentially confounding effects. AZT treatment did not alter locomotor activity of mice at any time point after treatment (p > 0.05) (data not shown). In addition, AZT did not influence the body weight gain of mice at day 30 after AZT microinjection (AZT, 6.39 ± 0.19 g; vehicle, 6.64 ± 0.28 g; p > 0.4).
Telomerase is critical for the adult neurogenesis
To determine the effect of hippocampal telomerase inhibition on hippocampal neurogenesis, AZT solution at a dose of 0.175, 0.35, or 0.7 μmol was delivered into the left DG of adult male mice by microinjection (2 μl at 0.2 μl/min). As a control, 2 μl of vehicle was delivered into the right DG. Three hours after microinjection, mice were given injections of the thymidine analog BrdU (100 mg/kg, i.p.), a marker of dividing cells, and killed 2 h later for BrdU staining. The number of BrdU+ cells in the DG exposed to 0.175, 0.35, and 0.7 μmol of AZT was 1147.2 ± 42.9, 1034.7 ± 95.7, and 910 ± 95.8, respectively. The number of BrdU+ cells in the right DG exposed to vehicle was 1577.5 ± 38.3, 1584.1 ± 73.8, and 1589.7 ± 187.3, respectively. Exposure to 0.175, 0.35, and 0.7 μmol of AZT decreased the number of BrdU+ cells in the DG by ∼27.3, 34.7, and 42.8%, respectively, suggesting a dose-dependent cell birth reduction.
Next, we examined the time course of cell birth after intrahippocampal AZT microinjection. We treated mice with BrdU (100 mg/kg, i.p.) at 3, 24, 48, 72, or 168 h after AZT microinjection (0.7 μmol). Two hours later after BrdU treatment, the mice were killed for BrdU staining. AZT exposure reduced the number of newly generated cells in the DG time-dependently, and the inhibition ratio at 3, 24, 48, 72, and 168 h after AZT microinjection was 42.3% (F(1,8) = 15.85; p < 0.001), 40.3% (F(1,8) = 15.29; p < 0.001), 34.3% (F(1,8) = 10.32; p < 0.01), 31% (F(1,10) = 10.56; p < 0.01), and 18.4% (F(1,10) = 3.67; p < 0.05), respectively (Fig. 3A, 3B), suggesting a long-lasting effect of AZT on cell birth. In mammals, adult neurogenesis occurs principally in two neurogenic regions, the SVZ of the lateral ventricle and the subgranular zone of DG (van Praag et al., 2002). AZT delivered into the DG may diffuse into the SVZ and thereby inhibit cell birth in the SVZ. To exclude this possibility, we estimated the number of BrdU+ cells in the SVZ at 3, 24, 48, 72, or 168 h after intrahippocampal AZT microinjection. As shown in Figure 3C, intrahippocampal AZT did not change the number of BrdU+ cells in the SVZ at any time point (p > 0.05).

Hippocampal telomerase modulates neurogenesis. A, Total number of BrdU-positive cells per DG from mice treated with intrahippocampal AZT microinjection (0.7 μmol, 2 μl) at the time indicated (n = 5–6). B, Representative BrdU-positive cells in the DG at 3 h after AZT microinjection. C, Total number of BrdU-positive cells per SVZ from mice treated with intrahippocampal AZT microinjection (0.7 μmol, 2 μl) at the time indicated (n = 5–6). D, Representative BrdU-positive cells in the DG of mice transfected with Ad-mTERT-GFP or Ad-GFP at 28 d after BrdU labeling. E, Representative BrdU/GFP-positive cells in the DG of mice transfected with Ad-mTERT-GFP at 28 d after BrdU labeling. Red, BrdU; green, GFP. Arrowheads indicate double-labeled cells. Scale bars: B, 200 μm; D, E, 100 μm. Data are mean ± SEM. *p < 0.05, compared with vehicle.
Finally, we examined whether TERT overexpression promotes hippocampal neurogenesis. We delivered Ad-mTERT-GFP or Ad-GFP into bilateral hippocampus of mice by stereotaxic microinjection. These mice were treated with BrdU (50 mg/kg, i.p., four times, at 6 h intervals) at 48 h after microinjection and killed 28 d after the last BrdU injection for immunohistochemical staining. Compared with the Ad-GFP group, the DG transfected with Ad-mTERT-GFP exhibited significantly increased BrdU+ cells (1728.7 ± 190.1 vs 934.6 ± 99.3; F(1,6) = 14.36; p < 0.01) (Fig. 3D), suggesting an upregulation of survived newly born cells. To test whether most BrdU-positive cells are infected by Ad-mTERT-GFP, we treated mice with BrdU (100 mg/kg, i.p.) and delivered Ad-mTERT-GFP into the hippocampus at 8 h after BrdU injection. Four days later, these mice were killed for BrdU staining. We found that 56.3 ± 4.2% (n = 4) of BrdU-positive cells were colabeled with GFP (Fig. 3E).
To determine whether telomerase inhibition in the SVZ impairs neurogenesis and consequently leads to depressive-like behavior, we delivered 0.7 μmol of AZT by microinjection into bilateral SVZ of adult mice (2 μl at 0.2 μl/min) to diminish neurogenesis in the SVZ. Three hours after microinjection, mice were given injections of BrdU (100 mg/kg, i.p.) and killed 2 h later for BrdU staining. Treatment with AZT reduced the number of BrdU+ cells in the SVZ by 41.5% (AZT, 2982 ± 188.6; vehicle, 5100 ± 365.8; F(1,9) = 29.40; p = 0.0004) (Fig. 4A,B), but not in the DG (AZT, 1449.6 ± 76.1; vehicle, 1599.6 ± 24.2; F(1,9) = 3.0; p = 0.1175) (Fig. 4A). The AZT microinjection into the SVZ did not alter immobility time in the TST and FST and percentage sucrose preference either at 20 d or at 30 d after treatment (p > 0.05) (Fig. 4C–E).

Decreased cell birth in the SVZ by AZT has no effect on behavioral phenotype. A, Total number of BrdU-positive cells per DG or per SVZ from AZT- or vehicle-treated mice. AZT (0.7 μmol, 2 μl at 0.2 μl/min) or vehicle was delivered into bilateral SVZ by microinjection. Mice were treated with BrdU (100 mg/kg, i.p.) at 3 h after AZT microinjection. BrdU staining was performed at 2 h after BrdU labeling. B, Representative BrdU-positive cells in the SZV of mice treated with vehicle (left) and AZT (right) at 3 h after AZT microinjection. Scale bar, 200 μm. C–E, Effects of AZT on behavioral phenotype. Shown are the immobility time in the TST (n = 12) (C) and FST (n = 12) (D) and percentage sucrose preference (n = 7–8) (E) of the mice treated with AZT (0.7 μmol, 2 μl at 0.2 μl/min, bilateral SVZ microinjection) at the time indicated. Data are mean ± SEM. *p < 0.05, compared with vehicle.
To further determine whether the intrahippocampal AZT injection affects the effects of antidepressants on neurogenesis and behaviors, we treated mice with fluoxetine (10 mg · kg−1 · d−1, i.p.) for 28 d. We delivered 0.7 μmol of AZT by microinjection into the bilateral DG (2 μl at 0.2 μl/min) at day 0 or day 25, injected BrdU (100 mg/kg, i.p.) to label newly born cells in the hippocampus at day 1, and performed behavioral tests and BrdU staining at day 29 after starting fluoxetine treatment. Pretreatment with AZT abolished fluoxetine-induced hippocampal neurogenesis increase (F(3,14) = 24.47; p = 0.000) (Fig. 5A) and immobility time decreases in the TST (F(3,44) = 10.21; p = 0.029) (Fig. 5B) and FST (F(3,44) = 16.82; p = 0.000) (Fig. 5C). However, treatment with AZT at day 25 after fluoxetine treatment had no effect on hippocampal neurogenesis increase (F(3,14) = 24.47; p = 0.829) (Fig. 5A) and immobility time in the TST (F(3,44) = 10.21; p = 0.991) (Fig. 5B) and FST (F(3,44) = 16.82; p = 0.999) (Fig. 5C). Thus, telomerase is important for the neurogenic and behavioral effects of antidepressants.

AZT abolishes the neurogenic and behavioral effects of fluoxetine. A, Representative BrdU-positive cells (left) and statistical graph showing the number of in the DG of mice (right) after treating with fluoxetine (10 mg · kg−1 · d−1, i.p., for 28 d) with or without AZT (0.7 μmol, 2 μl at 0.2 μl/min, intrahippocampal microinjection). Scale bar, 100 μm. B, C, AZT abolishes behavioral effect of fluoxetine. Shown is the immobility time in the TST (B) and FST (C) of the mice after treatment with fluoxetine (10 mg · kg−1 · d−1, i.p., for 28 d) with or without AZT (0.7 μmol, 2 μl at 0.2 μl/min, intrahippocampal microinjection) (n = 12). For the AZT + fluoxetine group, AZT was used at day 0 after starting fluoxetine treatment; for the fluoxetine + AZT group, AZT was used at day 25 after starting fluoxetine treatment. Data are mean ± SEM. *p < 0.05, compared with control; #p < 0.05, compared with fluoxetine.
Requirement of neurogenesis for the role of telomerase in behavioral modulation
A potential concern is that the dose of AZT (0.7 μmol) used for intrahippocampal microinjection may cause cell damage. Accordingly, we investigated effects of AZT at a low dose on neurogenesis and behaviors. It is reported that 0.5 mm AZT inhibited telomerase activity and the growth significantly in the cultured MCF-7 cells (Melana et al., 1998). We thus incubated the cultured adult neural stem cells (NSCs) with 0.5 mm AZT for 24 h and examined their telomerase activity and proliferation. AZT (0.5 mm) significantly inhibited telomerase activity in the NSCs (31.4% of control; p = 0.000), and there was no detectable telomerase activity in the cultured neurons (Fig. 6A). Immunofluorescence tests indicated that many NSCs expressed TERT but not neurons (Fig. 6B). Incubation with 0.5 mm AZT for 24 h significantly decreased neurosphere formation compared with control, quantified by cell counting (0.548 ± 0.0367 vs 1.0 ± 0.432; n = 3; p = 0.0013) (Fig. 6C). Similar results were obtained with BrdU incorporation experiments (10 μm BrdU was introduced at 22 h after AZT exposure) using monolayer-cultured NSCs. The ratio of BrdU-positive cells in AZT-treated NSCs was 37.0 ± 2.2%, compared with 71.8 ± 2.6% in control (p < 0.001) (Fig. 6D).

A low dose of AZT inhibits telomerase activity and neurogenesis and produces depressive-like phenotype. A, Telomerase activity in the cultured neurons and NSCs incubated with 0.5 mm AZT for 24 h (n = 3). B, TERT immunofluorescence from the neurosphere-cultured NSCs (top), monolayer-cultured NSCs (middle), and neurons (bottom). C, Representative newly formed neurospheres after treatment with 0.5 mm AZT or vehicle for 24 h. D, Representative BrdU-labeled cells of the monolayer-cultured NSCs after treatment with 0.5 mm AZT or vehicle for 24 h. E, Representative SYBR Green I-stained gel visualizing TRAP products of sample from the hippocampus of mice treated with intrahippocampal AZT infusion using a 7 d Alzet osmotic minipump (6.7 μg/50 μl, 0.25 μl/h). Negative control, Taq enzyme-free control; Positive control, cell line expressing high levels of telomerase. Scale bars: B, C, 400 μm; D, 100 μm. Data are mean ± SEM. *p < 0.05, compared with vehicle.
Next, we infused 0.5 mm AZT solution into the left hippocampus of mice using a 7 d Alzet osmotic minipump (6.7 μg/50 μl, 0.25 μl/h), measured telomerase activity, and labeled newly born cells with BrdU (100 mg/kg, i.p., for proliferation; 200 mg/kg, i.p., for survival) in the hippocampus on the day the minipump was removed. The AZT infusion significantly decreased telomerase activity (14.3 ± 1.77 vs 36.7 ± 2.34 TPG units; n = 3; p = 0.0016) (Fig. 6E) and newly born cells in the DG (the number of BrdU-positive cells at 2 h after BrdU labeling; 681.6 ± 68.5 vs 1065.6 ± 47.2; n = 5; p = 0.0017). The AZT infusion also significantly decreased the survival of newly born cells (the number of BrdU-positive cells at 28 d after BrdU labeling; 377.1 ± 28.8 vs 731.8 ± 43.4; n = 5; p < 0.001). To investigate behavioral modifications, we infused 0.5 mm AZT solution into the left hippocampus of mice using a 28 d Alzet osmotic minipump (26.8 μg/200 μl, 0.25 μl/h) and performed behavioral tests after the removal of the minipump. The AZT infusion significantly prolonged immobility time in the TST (142.2 ± 9.8 vs 109.5 ± 9.4 s; n = 11–14; p = 0.018) and FST (197.3 ± 11.0 vs 168.6 ± 5.6 s; n = 11–14; p = 0.021) and decreased percentage sucrose preference (71.2 ± 4.2 vs 87.4 ± 1.7%; n = 10–13; p = 0.0014).
As telomere dysfunction can lead to cell death (Hastie et al., 1990; Roy et al., 2004), the behavioral modifications by AZT may be caused by mature neuron and/or newly born cell insults. To exclude this possibility, we incubated the cultured neurons and adult NSCs with 0.5 mm AZT for 24 h. The AZT incubation did not increase the number of apoptosis cells either in neurons (percentage of PI/Hochest-positive cells, 13.08 ± 0.76 vs 13.42 ± 0.68; n = 3; p = 0.809) or in the NSCs (percentage of PI/nestin-positive cells, 25.72 ± 0.99 vs 24.97 ± 0.77; n = 3; p = 0.581) (Fig. 7A). Next, we infused 0.5 mm AZT solution into the left hippocampus of mice using a 7 d Alzet osmotic minipump (6.7 μg/50 μl, 0.25 μl/h). The AZT infusion did not change hippocampal DNA polymerase activity (p = 1.000) (Fig. 7B) and did not cause apoptosis in the hippocampus (p = 0.316) (Fig. 7D), although it increased cell proliferation (p = 0.012) (Fig. 7C). Moreover, we delivered 0.7 μmol of AZT (2 μl at 0.2 μl/min) into the DG by microinjection. Seven days later, mice were killed to examine cell damage by staining brain sections with FJ and TUNEL. Neither dead nor apoptotic neurons were observed in the hippocampus of mice treated with AZT (Fig. 7D,E).

AZT does not cause cells damage. A, Representative PI-positive cells in the cultured NSCs (labeled by nestin) incubated with 0.5 mm AZT or vehicle for 24 h. Green, Nestin; red, PI; blue, Hoechst. B, Time scan of fluorescence intensity of samples showing DNA polymerase activity in the hippocampus of mice treated with intrahippocampal AZT infusion using a 7 d Alzet osmotic minipump (6.7 μg/50 μl, 0.25 μl/h) (n = 3). KF, Klenow fragment (DNA polymerase I), a positive control; KF−, without KF, a negative control. C, Representative cell cycle (left) and percentage of proliferation or apoptosis (right) of cells from the hippocampus of mice treated with intrahippocampal AZT infusion using a 7 d Alzet osmotic minipump (6.7 μg/50 μl, 0.25 μl/h) (n = 4). Cell cycle analysis was performed using PI staining by flow cytometry. D, Representative DG stained with TUNEL from vehicle-treated (left) or AZT-treated (middle) mice or the representative ischemic cortex stained with TUNEL (right). E, Representative DG stained with FJ from vehicle-treated (left) or AZT-treated (middle) mice or the representative ischemic hippocampal CA1 area stained with FJ (right). Ischemia of mice was induced by 120 min middle cerebral artery occlusion (MCAO) and 7 d reperfusion. Higher magnification shows TUNEL+ (D) or FJ-stained (E) cells in the selected area. Scale bars: B, 30 μm; D, E, 200 μm. Data are mean ± SEM. *p < 0.05, compared with vehicle.
To further determine whether hippocampal neurogenesis accounts for the action of TERT overexpression on behaviors, we sought to disrupt this process by X-irradiation. We delivered 10 or 15 Gy x ray to the hippocampus of mice, injected BrdU (200 mg/kg, i.p.) to label newly born cells in the hippocampus at day 12, and performed behavioral tests at day 36 after the first dose of x ray. We performed BrdU staining and BrdU/NeuN and BrdU/GFAP double staining at day 28 after BrdU labeling to test the survival of newborn cells and the percentage of BrdU/NeuN- and BrdU/GFAP-positive cells. As shown in Figure 8B, 10 and 15 Gy x ray resulted in 28.4 and 41.8% reduction in survival. Compared with the sham-irradiated group, 15 Gy x ray did not change the percentage of BrdU/NeuN-positive cells (84.7 ± 4.1 vs 83.3 ± 1.9%; p = 0.489; n = 6) and BrdU/GFAP-positive cells (11.1 ± 2.04 vs 12.0 ± 0.8%; p = 0.349; n = 6). Exposure to 15 Gy x ray prolonged immobility time in the TST (F(2,39) = 3.63; p = 0.036) (Fig. 8C) and FST (F(2,39) = 5.12; p = 0.034) (Fig. 8D). Ten Gray x ray prolonged immobility time in the FST (F(2,39) = 5.12; p = 0.024) (Fig. 8D).

Hippocampal neurogenesis is required for Ad-mTERT-GFP-induced antidepressant-like effect. A, Schematic representation of experimental design for B–D. B, Number of BrdU-labeled cells in the DG of mice exposed to 0, 10, or 15 Gy X-irradiation (n = 10) (left) and representative BrdU/NeuN-positive cells in the DG of mice exposed to 15 Gy X-irradiation (right). Green, NeuN; red, BrdU. Arrowheads indicate the double-labeled cells. C, Immobility time of mice exposed to 0, 10, or 15 Gy X-irradiation in the TST test (n = 13–15). D, Immobility time of mice exposed to 0, 10, or 15 Gy X-irradiation in the FST test (n = 13–15). E, Schematic representation of experimental design for F–I. F, Number of BrdU-positive cells 2 h after BrdU labeling in the DG of mice with Ad-mTERT-GFP transfection and exposed to 15 Gy X-irradiation (n = 10–14). G, Number of BrdU-positive cells 28 d after BrdU labeling in the DG of mice with Ad-mTERT-GFP transfection and exposed to 15 Gy X-irradiation (n = 10–12). H, Immobility time of mice with Ad-mTERT-GFP transfection and exposed to 15 Gy X-irradiation in the TST test (n = 13–16). I, Immobility time of mice with Ad-mTERT-GFP transfection and exposed to 15 Gy X-irradiation in the FST test (n = 13–16). Data are mean ± SEM. *p < 0.05, compared with 0 Gy X-irradiation (B–D) or with Ad-GFP (F–I); #p < 0.05, compared with Ad-mTERT-GFP.
Next, we delivered 2 μl off Ad-mTERT-GFP or Ad-GFP into the bilateral DG of mice by stereotaxic microinjection. We delivered 5 Gy x ray three times 32 (total 15 Gy; at days 6, 10, and 14 after transfection, respectively) to the hippocampus of mice treated with Ad-mTERT-GFP, injected BrdU (100 mg/kg, i.p., for proliferation; 200 mg/kg, i.p., for survival) to label newly born cells in the hippocampus at day 12, and performed behavioral tests at day 36 after the first dose of x ray. We performed BrdU staining 2 h and 28 d after BrdU labeling to test proliferation and survival, respectively. Ad-mTERT-GFP caused 37.9% increase in proliferation (Fig. 8F) and 47.2% increase in the survival of newly born cells (Fig. 8G). The X-irradiation abolished the effects of Ad-mTERT-GFP not only on proliferation (F(2,33) = 72.53; p = 0.000) (Fig. 8F) and survival (F(2,29) = 56.89; p = 0.000) (Fig. 8G) but also on the latency in the TST (F(2,49) = 5.32; p = 0.028) (Fig. 8H) and FST (F(2,29) = 5.54; p = 0.036) (Fig. 8I). These results suggest that hippocampal neurogenesis contributes to the role of telomerase in behavioral modulation.
Discussion
Here, we report that chronic stress results in telomerase reduction in the adult hippocampus. Inhibiting hippocampal telomerase decreases neurogenesis, induces depression-like phenotype, and abolishes the behavioral effects of an antidepressant. In contrast, overexpression of TERT in the hippocampus stimulates neurogenesis, produces an antidepressive-like effect, and prevents the CMS-induced behavioral modifications. Moreover, disrupting hippocampal neurogenesis blocks behavioral responses to TERT overexpression.
Stressful stimuli have a substantial causal association with depression, and stress paradigms have long been used to model the disease (Martinowich et al., 2007; Zhou et al., 2007; Bartolomucci and Leopardi, 2009). We show here that chronic stress led to hippocampal telomerase expression and activity reductions. Consistently, it has been demonstrated that psychological stress, including perceived stress and chronicity of stress, is significantly associated with lower telomerase activity and shorter telomere length in peripheral blood mononuclear cells (Epel et al., 2004). Recently, it was reported that major depressive disorder has a statistically significant shortening effect on telomeric length (Lung et al., 2007). We used AZT to inhibit telomerase activity and found that both systemic and hippocampal telomerase inhibition caused a depressive-like phenotype and abolished the behavioral effects of fluoxetine in mice. More importantly, overexpression of TERT in the hippocampus produced an antidepressive-like effect. Thus, hippocampal telomerase is significantly implicated in the regulation of depressive behaviors.
Perturbations in adult hippocampal neurogenesis are believed to be relevant to various physiological and pathological processes such as learning and memory, epilepsy, schizophrenia, stroke, etc. (Gould et al., 1999; Zhu et al., 2003, 2004; DeCarolis and Eisch, 2010). Multiple studies have shown that antidepressants enhance hippocampal neurogenesis (Jacobs et al., 2000; Malberg, 2004; Chen et al., 2006) and that hippocampal neurogenesis is required for their behavioral effects (Santarelli et al., 2003). Although it is not well known whether decreased neurogenesis can induce a depressive-like effect (Sapolsky, 2004), our findings that telomerase overexpression produced an antidepressive-like effect, increased neurogenesis, and prevented the CMS-induced behavioral modifications suggest a possibility that telomerase may modify depressive behaviors via promoting neurogenesis. Additional support for this hypothesis comes from that disrupting hippocampal neurogenesis by AZT or X-irradiation produced depressive-like behaviors and X-irradiation abolished behavioral effects of TERT overexpression. Especially, intrahippocampal single AZT microinjection or AZT infusion using a minipump caused ∼40% reduction in local cell proliferation and produced an extremely significant depressive-like effect, suggesting important significance of neurogenesis for behavioral phenotype. As the microinjection of AZT into the SVZ impaired local cell birth without affecting behaviors, hippocampal but not SVZ neurogenesis is critical for the effect of telomerase on behaviors.
Interestingly, our findings that X-irradiation of a restricted region of mouse brain containing the hippocampus or intrahippocampal AZT microinjection blocked neurogenesis in the DG and produced depression-like behaviors in the TST and FST suggest that impaired hippocampal neurogenesis may constitute cellular mechanisms of depressive behaviors. However, an inconsistency with our current results is that ablation of hippocampal neurogenesis via irradiation does not elicit a behavioral modification in the novelty suppressed feeding (NSF) test (Santarelli et al., 2003; Surget et al., 2008; David et al., 2009; Zhu et al., 2010). The NSF test and the TST or FST test characterize different behaviors. The NSF procedure is a conflict test that elicits competing motivations: the drive to eat and the fear of venturing into the center of a brightly lit arena (Bodnoff et al., 1988). The latency to feed in the NSF test has been used as an index of anxiety-like behaviors (Santarelli et al., 2003). The FST and the TST have been developed to evaluate depression-like behaviors in mice (Porsolt et al., 1977; Steru et al., 1985). The immobility of the animal in FST and TST reflects a state of “behavioral despair.” It has been reported that C57BL/6Ntac and CD1 mice treated with a low dose of corticosterone (35 μg · ml−1 · d−1 or 5 mg · kg−1 · d−1) for 4 weeks developed an anxiety-like phenotype in both the open field and the NSF test but displayed a normal behavior in the FST test (David et al., 2009). Thus, the inconsistency between our findings and these reports (Santarelli et al., 2003; Surget et al., 2008; David et al., 2009; Zhu et al., 2010) raises a possibility that impaired hippocampal neurogenesis may give rise to a certain type of behavioral modification. There are reports that ablation of hippocampal neurogenesis via X-irradiation had no significant effect on immobility in the FST test (Airan et al., 2007; David et al., 2009) and another report that decreasing neurogenesis in the receptor tyrosine kinase TrkB conditional knock-out mice carrying the hGFAP-Cre (TrkBhGFAP) did not change immobility time in the TST (Li et al., 2008). In the research by Airan et al. (2007), a smaller sample size (n = 6) may be the cause of the statistical insignificance. In the report by David et al. (2009), they treated animals with X-irradiation in combination with a long-term corticosterone (35 μg · ml−1 · d−1 or 5 mg · kg−1 · d−1). The combination treatment may complicate results. In the study by Li et al. (2008), the abnormal behavioral phenotype in TrkB KO mice may mask some behavioral modifications, as TrkB ablation renders mice behaviorally insensitive to antidepressive treatment.
The effects of AZT on cell proliferation happen very quickly. It is hard to envisage how such effects can be related to telomere length, which changes very slowly with successive cell divisions. Although TERC and TERT function together to elongate telomeres and to protect chromosomal ends (Calado and Chen, 2006), TERT is constitutively expressed in the hippocampus, but TERC was not detected in hippocampus (Lee et al., 2010). In fact, overexpression of TERT promotes stem cell proliferation without changes in length of telomeres (Calado and Chen, 2006). Thus, the telomerase functional characteristic in the hippocampus is TERC independent and is operated through a mechanism other than telomere elongation.
Mice with Ad-mTERT-GFP transfection subjected to X-irradiation exhibited immobility times similar to sham-irradiated Ad-GFP and above sham Ad-mTERT-GFP mice in the TST and FST. However, since a reduction of neurogenesis by X-irradiation in control animals increased immobility time in the TST and FST, factors other than modulation of adult neurogenesis may contribute to the behavioral effects of TERT overexpression. Indeed, several reports indicate the significance of telomerase in protecting neuronal death in vitro and in vivo (Martín-Rivera et al., 1998; Klapper et al., 2001; Kang et al., 2004). TERT overexpression decreased apoptosis in PC12 cells induced by trophic factor withdrawal (Fu et al., 2000) and resulted in apparent resistance to cerebral ischemic injury and NMDA receptor-mediated neurotoxicity in the mouse brain (Kang et al., 2004). TERT downregulation increased the sensitivity of hippocampal neurons to excitotoxicity (Fu et al., 2000), and TERT-deficient neurons were more sensitive to NMDA than wild-type ones (Lee et al., 2008). Moreover, intrahippocampal AZT infusion caused 36.1% reduction in proliferation and 48.6% reduction in survival. Hippocampal Ad-mTERT-GFP transfection caused 37.9% increase in proliferation and 47.2% increase in the survival of newly born cells. These results suggest that telomerase not only plays an important role in proliferation of NSCs but also benefits the survival of newly born cells.
Together, the results of the present study indicate that hippocampal telomerase may be involved in the molecular mechanism for regulation of the depressive behaviors, providing new insight into the neurobiology of depression.
Footnotes
This work was supported by grants from the National Basic Research Program of China (973 Program; 2011CB504400 to D.-Y.Z.), National Natural Science Foundation of China (30870900, 30971021, and 81030023 to D.-Y.Z.; 81000586 to Q.-G.Z.), Natural Science Foundation of Jiangsu Province (BK2007728 to D.-Y.Z.), Specialized Research Fund for the Doctoral Program of Higher Education (200803120008 to D.-Y.Z.), and Science and Technology Foundation of Nanjing Medical University (09NJMUZ15 to Q.-G.Z.). We thank W. X. Sun and H. B. Xu for technical assistance.
- Correspondence should be addressed to Prof. Dong-Ya Zhu, Department of Pharmacology, School of Pharmacy, Laboratory of Cerebrovascular Disease, Nanjing Medical University, Nanjing 210029, China. dyzhu{at}njmu.edu.cn


