

Article Figures & Data
Figures
- Figure 1.
[3H]dT versus BrdU staining. Examples of [3H]dT (A) and BrdU (B) staining in the visual cortex are shown.
- Figure 2.
Sampling strategy. A, B, Hemicoronal sections illustrating approximate rostrocaudal levels and cortical sites where sampling boxes were placed. A random box is illustrated to indicate how cell distributions from pia to the white matter (WM, wm; filled light green color) are generated. The black dots inside boxes represent labeled cells. cal s., Calcarine sulcus; cgs, cingulate sulcus; cs, central sulcus; ips, intraparietal sulcus; ps, principal sulcus; SG, supragranular, IG, infragranular. Values in millimeters indicate approximate distance to bregma according to the atlas of Paxinos et al. (2000). The abbreviations for the five cortical areas studied apply to all other figures and tables.
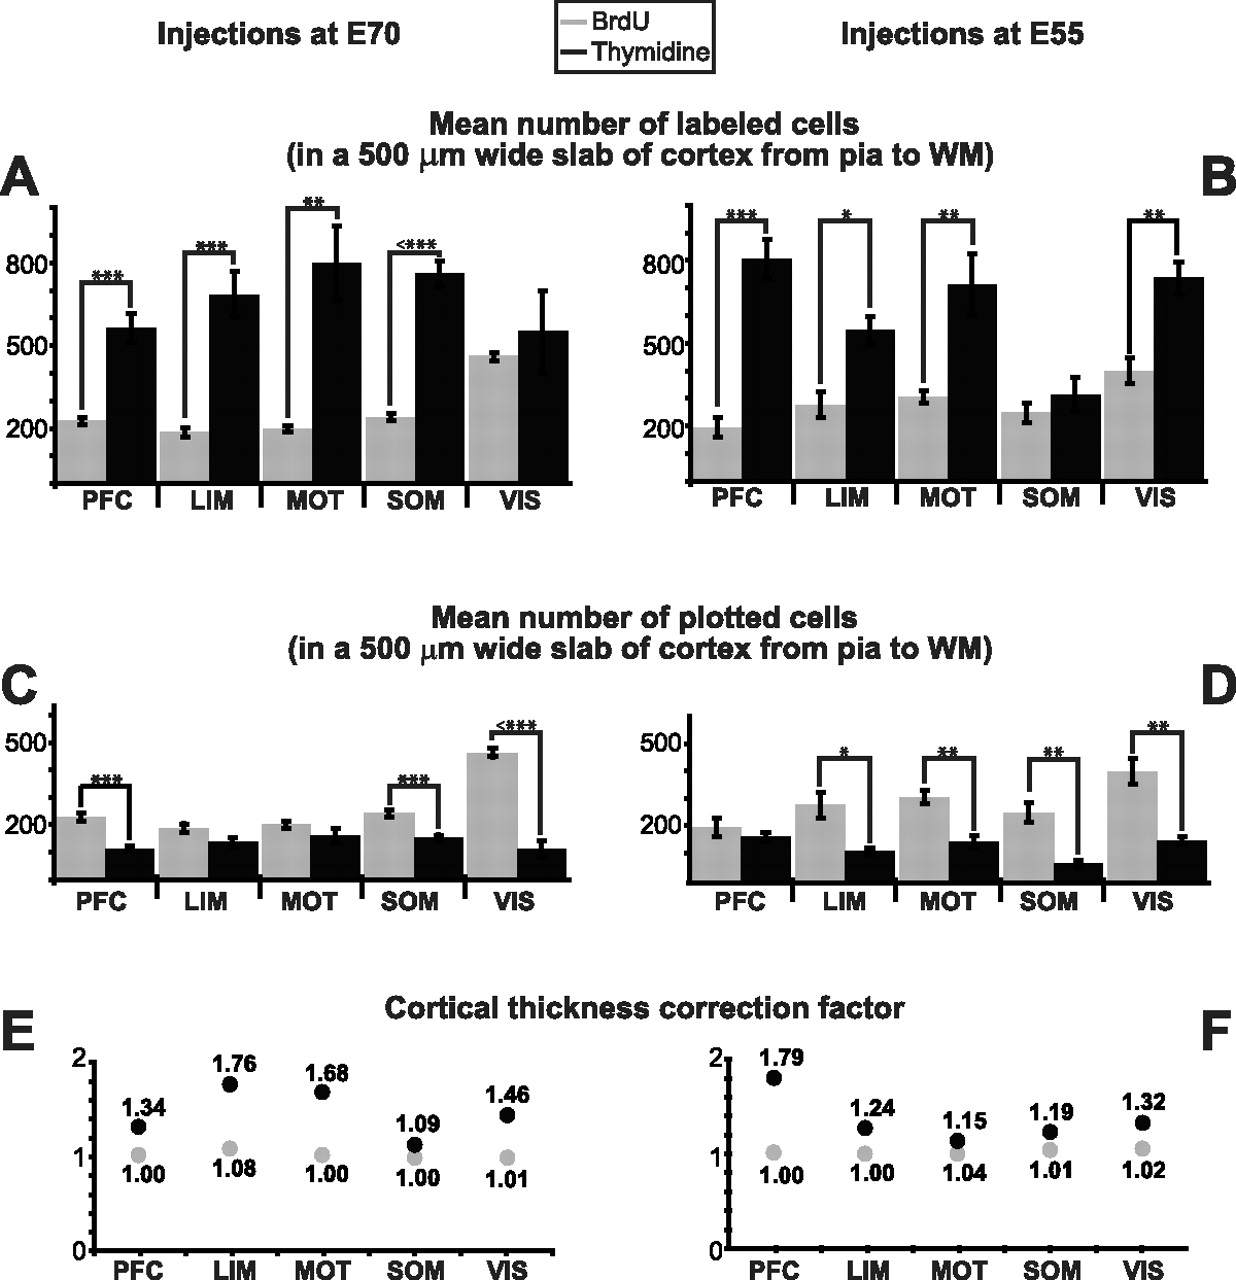
- Figure 3.
Cell numbers. Labeled (A, B) and plotted (C, D) mean number of BrdU and [3H]dT cells in a 500-μm-wide slab of cortex from pia to WM. Although more BrdU than [3H]dT cells were plotted (C, D) and some of the differences reached statistical significance (ANOVA at the p < 0.05 level); after corrections (E, F) (see Materials and Methods, Technical considerations and corrections of methodological differences), it was determined that there are more [3H]dT than BrdU-labeled cells (A, B). E and F illustrate the factor by which each cortical area was corrected to normalize the cortical thickness to the mean cortical thickness measured in the BrdU cases. Cortical thickness was highly variable in the [3H]dT cases and rather constant in BrdU cases. *Denotes statistical significance. Error bars indicate SEM.
- Figure 4.
BrdU-positive cells are significantly more dispersed than [3H]dT-positive cells. A–D, Distribution plots of the mean percentage BrdU and [3H]dT cells in bins of 100 μm from pia to (and including) WM. As indicated by color gradient, the transition from gray matter to WM is not an abrupt one. WM border usually initiates at ∼1800 μm deep, but this depends on the region, angle of cut, etc. A, B, Injections at E70. A, BrdU peaks for the PFC, LIM, MOT, and SOM cortices coincide in depth between 200 and 300 μm from pia. The peak for VIS cortex is between 1000 and 1100 μm deep. In addition to these peaks, for all BrdU cases there are other quasi-salient peaks at different depths, and in most cases >10% of the cells accumulate deeper to where no [3H]dT cells accumulate. Between 2 and 3% of the cells are found at very deep locations including within the WM (>1900 μm from pia). Because of the spreading of the distributions, the largest accumulation of BrdU cells in a single bin is low, in the range from ∼12 to 17%. B, [3H]dT peaks are discrete (i.e., separate from each other) and compact. In order of depth are LIM (at 300–400 μm), MOT (at 400–500 μm), SOM (at 500–600 μm), PFC (at 600–700 μm), and VIS (at 800–900 μm) cortices. There is no accumulation of cells at deeper locations and no cells found in the WM. Consequently, in each cortical area the largest accumulation of [3H]dT cells in a single bin is high, in the range from ∼15 to 37%. C, D, Injections at E55. C, D, BrdU (C) and [3H]dT (D) distributions are wider when compared with the corresponding ones for injections at E70 but, when compared with each other, BrdU cells (C) are still more dispersed than the corresponding [3H]dT cells (D). As with the E70 cases, the total percentage accumulation per bin for BrdU is consequently lower that of [3H]dT. The spreading of the BrdU cells is therefore a function of the marker and not of the time at which it was injected. To facilitate comparisons, all scales are the same and the position of BrdU or [3H]dT distribution peaks are indicated by long and short dashed lines, respectively.
- Figure 5.
BrdU versus [3H]dT cell dispersion per cortical area. To facilitate comparison, the distributions are now shown per cortical area. Corresponding uncorrected (top) and corrected (bottom) distributions for injections at E70 (A, B) and at E55 (C, D). In all cases, independently of whether or not the cortical thickness is normalized, BrdU and [3H]dT peaks do not coincide in depth from pia. Normalization has little effect on BrdU distributions but decreases the amplitude and deepens (with respect to pia) the peaks of the [3H]dT distributions. [3H]dT distributions are more compact than BrdU distributions indicating that BrdU cells are more widespread. All the F scores for dispersion have significant p values. F scores are not provided for the normalized cases because normalization renders the F test less powerful.
- Figure 6.
Agreement between BrdU and [3H]dT cell distributions is poor. A–D, Bland–Altman difference plots (also called Tukey's mean difference plots) indicate poor agreement between BrdU and [3H]dT distributions for all injection times and in all cortical areas. The smallest limits of agreement with semibalance differences occur in the MOT cortex at E55 probably due to the poor development of the MOT cortex at the time of injection. The widest limits of agreement are all in the VIS cortex (a very active yet undeveloped area for both injection times). Normalization of cortical thickness improves the limits of agreement for most distributions, but limits are still wide. Bias (solid black) and identity (gray) lines are all at zero because the distributions are for normalized (percentage) data. The dashed lines represent the 95% agreement limits, of which only the positive value is shown. Since the 3000-μm-long counting boxes were divided in bins of 100 μm height, each of the 30 dots in each plot represents an ordered pair in which the ordinate is the difference in percentage and the abscissa is the mean percentage for the corresponding bins (i.e., bins at the same depth from pia) of the BrdU and [3H]dT distributions. The coordinate labels in the last plot apply to all plots.
- Figure 7.
Some BrdU cells are lost: they can bypass or lag behind their target positions. We calculated the percentage accumulation of BrdU and [3H]dT cells with respect to the highest peak(s) in the [3H]dT distributions after normalization of cortical thickness per cortical area. The difference (percentage) between the distributions is indicated in bold numbers above them. A, For injections at E70, some BrdU cells lag behind their proper depth in the PFC, LIM, and MOT cortices, while in SOM and VIS cortices they overshoot their target and position themselves more superficially than they should. B, Early on (at E55) the pattern was exactly the opposite, some BrdU cells in the PFC, LIM, and MOT cortices bypass their target depth with reference to pia and position themselves more superficially that they should, while in SOM and VIS cortices they lag behind. The numbers in parentheses (E70 cases; a single pair of animals in each case) indicate that the within-group differences are smaller than the between-group differences for each marker and within each cortical area.


Tables
Animals BrdU Sex Comparison [3H]dT Sex E55–P75 F 
E40–P62 U E55–P75 F E50–P61 U E56–P66 U E70–P70 F E70–P75 M E62–P50 U E70–P75 M E70–P98 U E70–P75 F E80–P48 U E70–P91 F E85–P94 U Qualitative assessment (n = 14) of the position of labeled cells was performed in all cases. Quantitative comparisons (n = 9) were made only for cases in which the injection time closely matched for both markers. F, Female; M, male; U, unknown; E, embryonic age at time of injection (days); P, postnatal day at time of killing (days).
Labeled cell numbers and percentages PFC LIM MOT SOM VIS Injections at E70 Number of labeled cells BrdU Total 1136 928 995 1206 2307 % Dead 59.9 73.0 75.1 68.3 16.3 [3H]dTa Total-1 11,320 13,740 16,000 15,220 11,020 Total-2 5660 6870 8000 7610 5510 Total-3 2830 3435 4000 3805 2755 % Dead 0.0 0.0 0.0 0.0 0.0 Percentage largest accumulation of labeled cells within a single 100 μm bin BrdU % 12.4 17.4 12.7 16.2 13.4 Depth (μm) 250 250 250 250 1050 [3H]dT % 21.0 20.2 14.5 16.2 36.8 Depth (μm) 650 350 450 550 850 Percentage largest accumulation of labeled cells within a single 100 μm bin, corrected for cortical thicknessb BrdU % 12.2 13.2 12.5 15.7 15.7 Depth (μm) 250 250 250 250 1150 [3H]dT % 16.6 12.7 10.0 12.8 28.9 Depth (μm) 950 450 650 350 1250 Percentage accumulation of labeled cells within 5 and 10 (100 μm) bins BrdU 5 bins 48.2 44.1 45.8 49.6 89.3 10 bins 79.3 61.7 70.3 72.8 99.6 [3H]dT 5 bins 77.4 81.4 64.8 70.4 54.6 10 bins 99.8 96.9 96.1 95.5 85.0 Percentage accumulation of labeled cells within 5 and 10 (100 μm) bins, corrected for cortical thicknessb BrdU 5 bins 47.3 49.0 45.9 51.2 57.1 10 bins 79.4 64.7 69.6 73.1 85.6 [3H]dT 5 bins 67.1 56.8 43.4 55.8 86.2 10 bins 97.9 87.2 73.1 90.4 95.3 Percentage accumulation of labeled cells deeper than 1900 μm from pia (deep bins) BrdU % 4.8 21.8 14.7 15.8 0.2 %b 4.7 22.0 14.1 15.6 0.2 [3H]dT % 0.0 0.0 0.4 1.1 0.0 %b 0.0 0.0 8.1 0.9 0.0 Injections at E55 Number of labeled cells BrdU Total 779 1105 1219 994 1593 Mean 194.8 276.3 304.8 248.5 398.3 % Dead 75.9 49.5 57.3 21.1 45.9 [3H]dTa Total 2420 1640 2140 945 2210 Mean 806.7 546.7 713.3 315.0 736.7 Percentage largest accumulation of labeled cells within a single 100 μm bin, corrected for cortical thicknessb BrdU % 13.2 9.1 5.3 11.3 12.8 Depth (μm) 1050 1050 1850 1150 1350 [3H]dT % 20.7 22.2 9.8 22.3 39.4 Depth (μm) 750 950 1450 750 1150 Percentage accumulation of labeled cells deeper than 1900 μm from pia (deep bins) BrdU %b 4.2 2.9 35.5 10.1 8.5 [3H]dT %b 0.0 0.0 24.1 0.0 0.0 Percentage accumulation within 5 and 10 bins is not shown for injections at E55; they follow the same trends of those shown for injections at E70.
↵aCorrected by increasing [3H]dT cell numbers as follows: total-1 detected cell numbers multiplied 20× represents the case in which detection occurred on the top 2.5 μm of the tissue; total-2 (10×) and total-3 (5×) represent cases in which detection occurred within 5 and 10 μm from the top, correspondingly. For [3H]dT, we assumed survival of 100% until detection; for details, see Results, and Materials and Methods, Technical considerations and corrections of methodological differences.
↵bAfter normalizing cortical thickness per area against that in BrdU material.
PFC LIM MT SS VIS Statistical results for injections at E70 Number of plotted cells BrdU Total 1136 928 995 1206 2307 Mean 227.2 185.6 199.0 241.2 461.4 SEM 13.0 16.1 12.0 12.8 15.0 PFC — 0.0318 0.1574 0.3392 0.0015 Multiple comparisons (p values–LSD contrast) LIM — — 0.4112 0.0037 <0.0001 MT — — — 0.0237 <0.0002 SS — — — — 0.0140 [3H]dT Total 566 687 800 761 551 Mean 113.2 137.4 160.0 152.2 110.2 SEM 10.4 16.5 26.8 9.0 29.9 BrdU–[3H]dT difference in number of plotted cells p 0.0001 0.0719 0.2215 0.0005 <0.0001 ANOVA, single factor (t test) BrdU–[3H]dT difference in cell numbers, corrected for section cut thickness and [3H]dT detection abilitya p 0.0002 0.0003 0.0021 <0.0001 0.5679 Comparison of the percentage distributions of BrdU versus [3H]dT χ2 7.74 10.52 6.15 8.16 3.61 Kruskal–Wallis test p 0.0054 0.0012 0.0132 0.0043 0.0575 F (p) 0.35 (0.0066) 0.26 (0.0006) 0.38 (0.0111) 0.43 (0.0265) 0.27 (0.0007) F test of dispersion Correlation coefficient of percentage of BrdU versus [3H]dT rs, p 0.83, p < 0.0001 0.77, p < 0.0001 0.82, p < 0.0001 0.79, p < 0.0001 0.69, p < 0.0001 Spearman's rank Comparison of the percentage distributions of BrdU versus [3H]dT, corrected for cortical thicknessb χ2 4.08 6.11 1.4 3.58 1.22 Kruskal–Wallis test p 0.0434 0.0135 0.2365 0.0583 0.2691 F (p) 2.04 (0.0594) 2.28 (0.0298) 1.50 (0.2839) 1.33 (0.4528) 3.02 (0.0040) F test of dispersion Correlation coefficient for mean percentage distributions of BrdU versus [3H]dTb rs, p 0.89, p < 0.0001 0.68, p < 0.0001 0.78, p < 0.0001 0.65, p < 0.0001 0.88, p < 0.0001 Spearman's rank Statistical results for injections at E55 Number of plotted cells BrdU Total 779 1105 1219 994 1593 Mean 194.8 276.3 304.8 248.5 398.3 SEM 34.2 45.9 23.3 34.9 46.3 [3H]dT Total 484 328 428 189 442 Mean 161.3 109.3 142.7 63.0 147.3 SEM 14.2 9.9 22.3 12.2 11.8 Comparison of the percentage distributions of BrdU versus [3H]dT χ2 2.37 2.75 0.35 5.17 8.19 Kruskal–Wallis test p 0.1238 0.0974 0.5541 0.0230 0.0042 F (p) 0.42 (0.0234) 0.28 (0.0009) 0.20 (<0.0001) 0.34 (0.0047) 0.13 (0.0001) F test of dispersion Correlation coefficient of the percentage of BrdU versus [3H]dT rs, p 0.67, p < 0.0001 0.90, p < 0.0001 0.86, p < 0.0001 0.60, p = 0.0005 0.61, p = 0.0004 Spearman's rank Correlation coefficient of the percentage of BrdU versus [3H]dTb rs, p 0.89, p < 0.0001 0.59, p = 0.0005 0.79, p < 0.0001 0.81, p < 0.0001 0.88, p < 0.0001 Spearman's rank Only essential details are shown for each group, and not all details are shown for E55, which follows the same trends observed for E70.
↵aCorrected by increasing [3H]dT cell numbers by 500%. This corresponds to the case for which we had the worse possible comparisons (Table 2, Total-3, for the number of [3H]dT cells; i.e., the case in which we assume [3H]dT cells are detected within 10 μm). For the other two cases, the estimated numbers of [3H]dT cells are so high compared with the number of BrdU cells that all per corresponding area comparisons were always statistically significant.
↵bAfter normalizing cortical thickness per area against that in BrdU material.
Values in bold are statistically significant.


