

Article Figures & Data
Figures
- Figure 1.
Accumulation of vesicles positive for lysosomal markers in ATP13A2 mutant fibroblasts and primary cortical neurons. A, Left, Representative images of LAMP1 immunostaining of two wild-type fibroblast lines (WT) and fibroblasts carrying ATP13A2 mutation (MUT); Right, quantification of intensity of cell area stained by LAMP1 (n = 80, *p < 0.001). B, Left, Imaging of LysoTracker labeled fibroblasts showed increased number and size of LysoTracker-positive vesicles, arrows indicate enlarged vesicles. Right, graphs: n = 80, *p < 0.001. C, Right, Representative images of LAMP1 immunostaining of primary cortical neurons. Fold change of LAMP1-positive area in ATP13A2 KD neurons compared with scrambled control cells; arrows indicate enlarged vesicles. Left, graph: n = 50, *p < 0.001. D, Right, Primary cortical neurons labeled with LysoTracker Green. Left, graph, quantification of the number of puncta (n = 25, *p < 0.001). E, Left, Mutant or wild-type fibroblasts overexpressing GFP (top) or WT-ATP13A2-GFP (bottom) and immunostained with LAMP1. Right, Quantification of staining intensity is represented as fold change compared with WT line (n = 25). F, Knockdown of ATP13A2 evaluated in cortical neurons by quantitative PCR. GAPDH and 18S were used as control genes (n = 3, *p < 0.001). In all graphs, error bars indicate SEM. Scale bars, 10 μm.
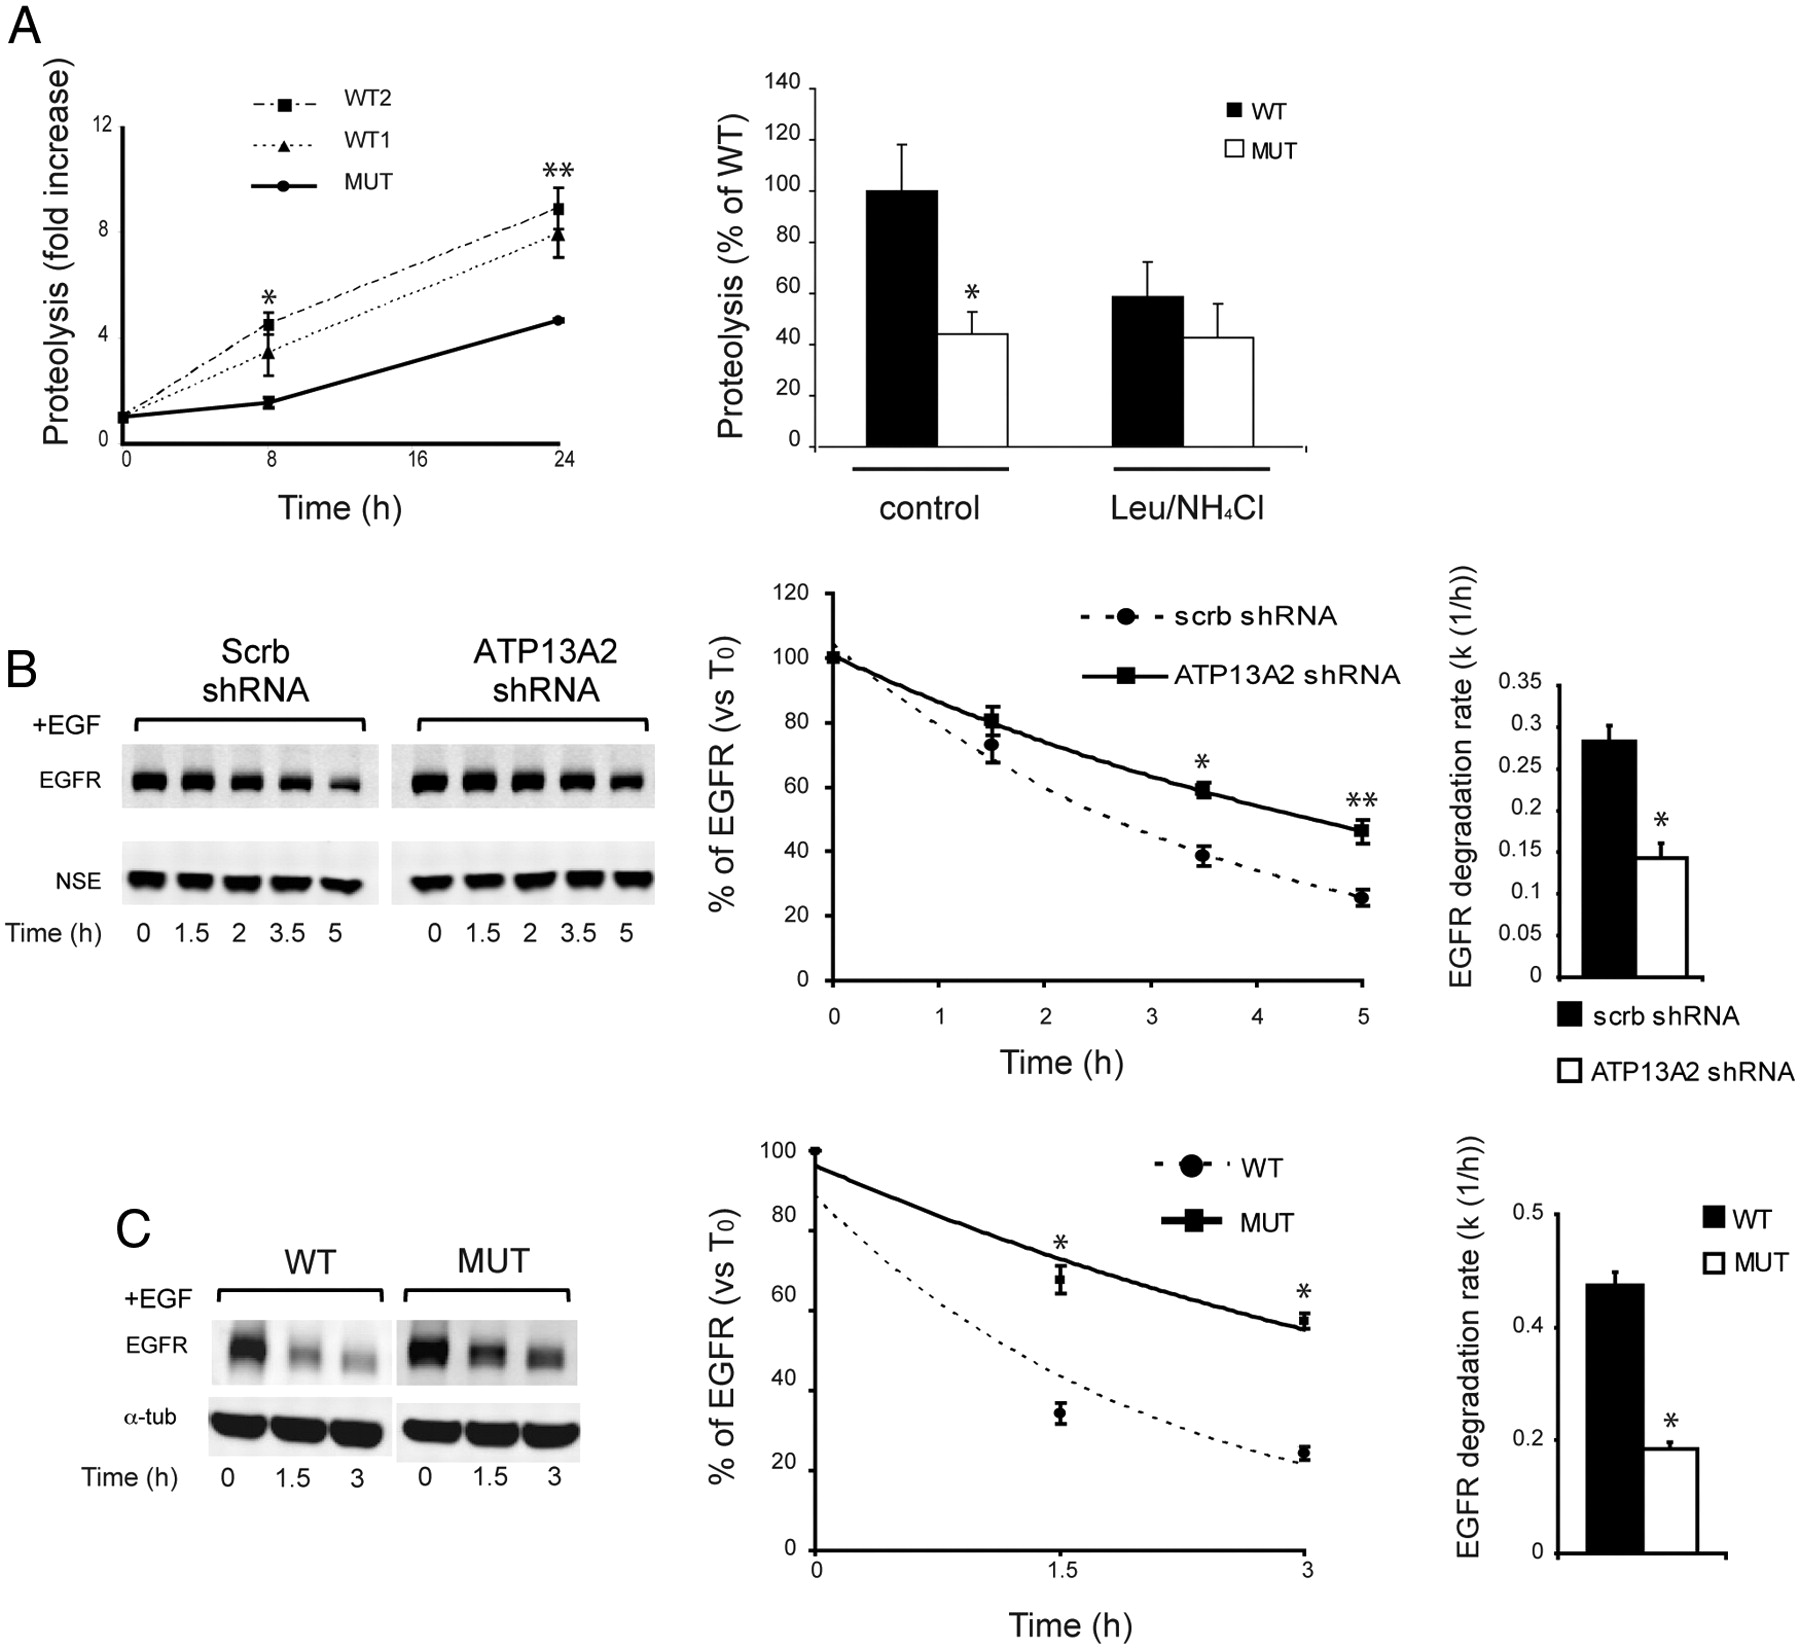
- Figure 2.
Decreased lysosomal degradation in ATP13A2-deficient neurons and patient fibroblasts. A, Left, Degradation of long-lived proteins in wild-type and mutant ATP13A2 fibroblasts at 8 and 24 h after incorporation of [3H]leucine (n = 4, *p < 0.05, **p < 0.005). Values are expressed as fold increase from the initial time point. Right, The effect of leupeptin and ammonium chloride was examined at 8 h (n = 4, *p < 0.05). B, Left, EGFR degradation in primary cortical neurons was followed for 5 h. Levels of EGFR were normalized to NSE levels and expressed as percentage levels of initial time point (T0; n = 6, *p = 0.019, **p = 0.008). Right, Average of degradation rates of EGFR is shown ([k (1/h)]; n = 6, *p < 0.001). C, EGFR degradation rate in patient fibroblasts compared with wild-type fibroblasts (n = 3, *p < 0.001). In all graphs, error bars indicate SEM.
- Figure 3.
Depletion of ATP13A2 leads to increased LC3-positive vesicles. A, LC3-II/LC3-I ratio is represented as fold change over scrambled (scrb) shRNA (n = 8, *p < 0.05). NSE was used as loading control. B, LC3-positive puncta in ATP13A2 shRNA neurons compared with scrb shRNA (n = 50, **p < 0.001). Leupeptin was used as positive control. Arrows indicate enlarged LC3 vesicles. Scale bar, 10 μm. C, MEF cells stably expressing mCherry-EGFP-LC3b fluorescence reporter were transfected with siRNA for ATP13A2, nontargeting control and VCP/p97. Graph presents quantifications of autophagosomes (yellow puncta) and autophagolysosomes (red puncta). In all graphs, error bars indicate SEM from three independent replicates.
- Figure 4.
Depletion of ATP13A2 leads to accumulation of α-syn and toxicity in primary neurons. A, Levels of α-syn protein normalized to NSE and presented as fold change over scrambled (scrb) shRNA levels (n = 6, *p = 0.002). B, Western blot analysis of Tau protein levels in scrb shRNA and ATP13A2 shRNA; α-tubulin was used as loading control (n = 10, p = 0.578). C, In-cell Western blot for neurofilament staining of neurons infected with lentivirus carrying ATP13A2 shRNA and scrb shRNA at DPI 5 and DPI 12. Graph shows quantification of neurofilament intensity expressed as a percentage of scrb shRNA (n = 4, *p < 0.001). D, LDH activity in neuronal culture medium at indicated time points (n = 4, *p < 0.001). E, Percentage of neurons with condensed nuclei [n (cells) = 180, four different fields, **p < 0.05]. F, Left, Quantification of neurofilament intensity of neurons with knockdown of α-syn and knockdown of ATP13A2 (n = 4, *p < 0.001). Right, Western blot showing silencing of endogenous α-syn (n = 3, *p < 0.001). In all graphs, error bars indicate SEM.


