

Article Figures & Data
Figures
- Figure 1.
Infraorbital nerve cut-induced multiple innervation of lemniscal fibers onto a relay neuron in the VPM. A, The experimental schedule and schematic showing the IONC operation. B, Schematic showing the position of a recorded relay neuron and the stimulation site of medial lemniscal fibers depicted on an infrared IR-DIC image of acute parasagittal thalamic slice of mice. C, Representative traces of lemniscal EPSCs recorded 1 week after the sham and the IONC operation under voltage-clamp condition at +40 and −70 mV. Several raw traces with different stimulus intensities are superimposed at each holding potential (Vh). D, The distributions of neurons with different numbers of lemniscal inputs for the intact, sham-operated, and IONC-operated VPM. n, Number of cells. E, Representative traces of lemniscal EPSCs in response to the alternate stimulation (with a 50 ms interstimulus interval) by two electrodes (Stim. I and Stim. II) from the same VPM neuron in the sham and IONC groups. Traces shown are the average of six consecutive EPSCs. F, Schematic showing of the position of a recorded relay neuron and stimulation sites on an IR-DIC image of a thalamic slice. ml, Medial lemniscus; Rt, reticular nucleus of thalamus; S1, primary somatosensory cortex; TG, trigeminal ganglion; TN, trigeminal nuclei.
- Figure 2.
IONC did not induce multiple-innervation of lemniscal fibers in the contralateral VPL or the ipsilateral VPM. The left infraorbital nerve was cut on P21. A–D, Lemniscal EPSCs were recorded from relay neurons in the contralateral (right) VPL (A, B) and in the ipsilateral (left) VPM (C, D), respectively, on P28–P32. A, Representative traces of lemniscal EPSCs in the contralateral VPL showing an all-or-none fashion. B, The distributions of neurons in the contralateral VPL with different numbers of lemniscal inputs. n, Number of cells. C, D, The same as in A and B, but in the ipsilateral VPM.
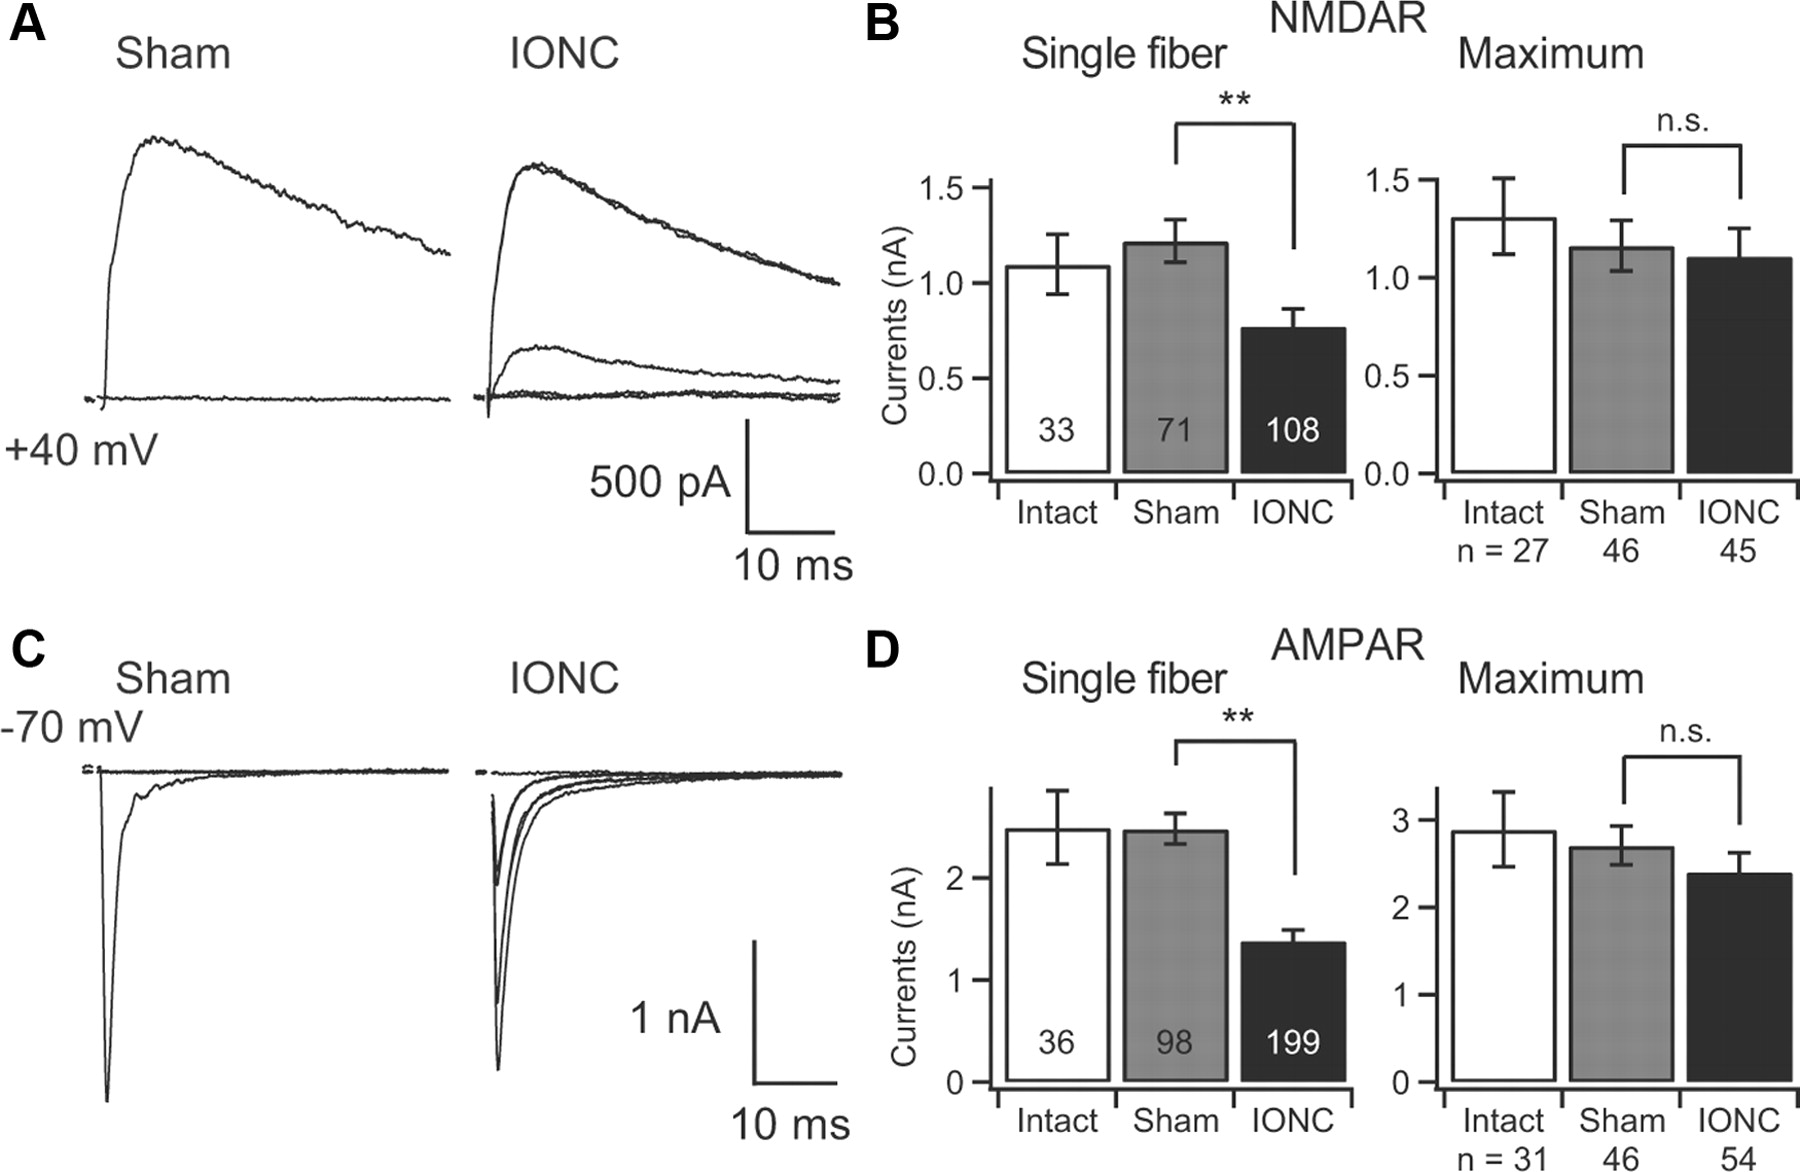
- Figure 3.
IONC reduces the mean amplitude of single-fiber-mediated lemniscal EPSCs. A, C, Representative traces of lemniscal EPSCs from both the sham- and IONC-operated mice are shown with the same scale. Several raw traces with different stimulus intensities are superimposed. Holding potentials were +40 mV (A) and −70 mV (C) for NMDAR- and AMPAR-mediated EPSCs, respectively. Traces shown in A and C were recorded from different relay neurons. B, D, Summary bar graphs showing the mean amplitude of single-fiber-mediated (left) and maximal (right) lemniscal EPSCs. Each bar represents the mean ± SEM. Numbers in columns mean numbers of fibers. n, Number of cells. Statistical significance was tested using two-tailed Student's t test. **p < 0.01. n.s., Not significant.
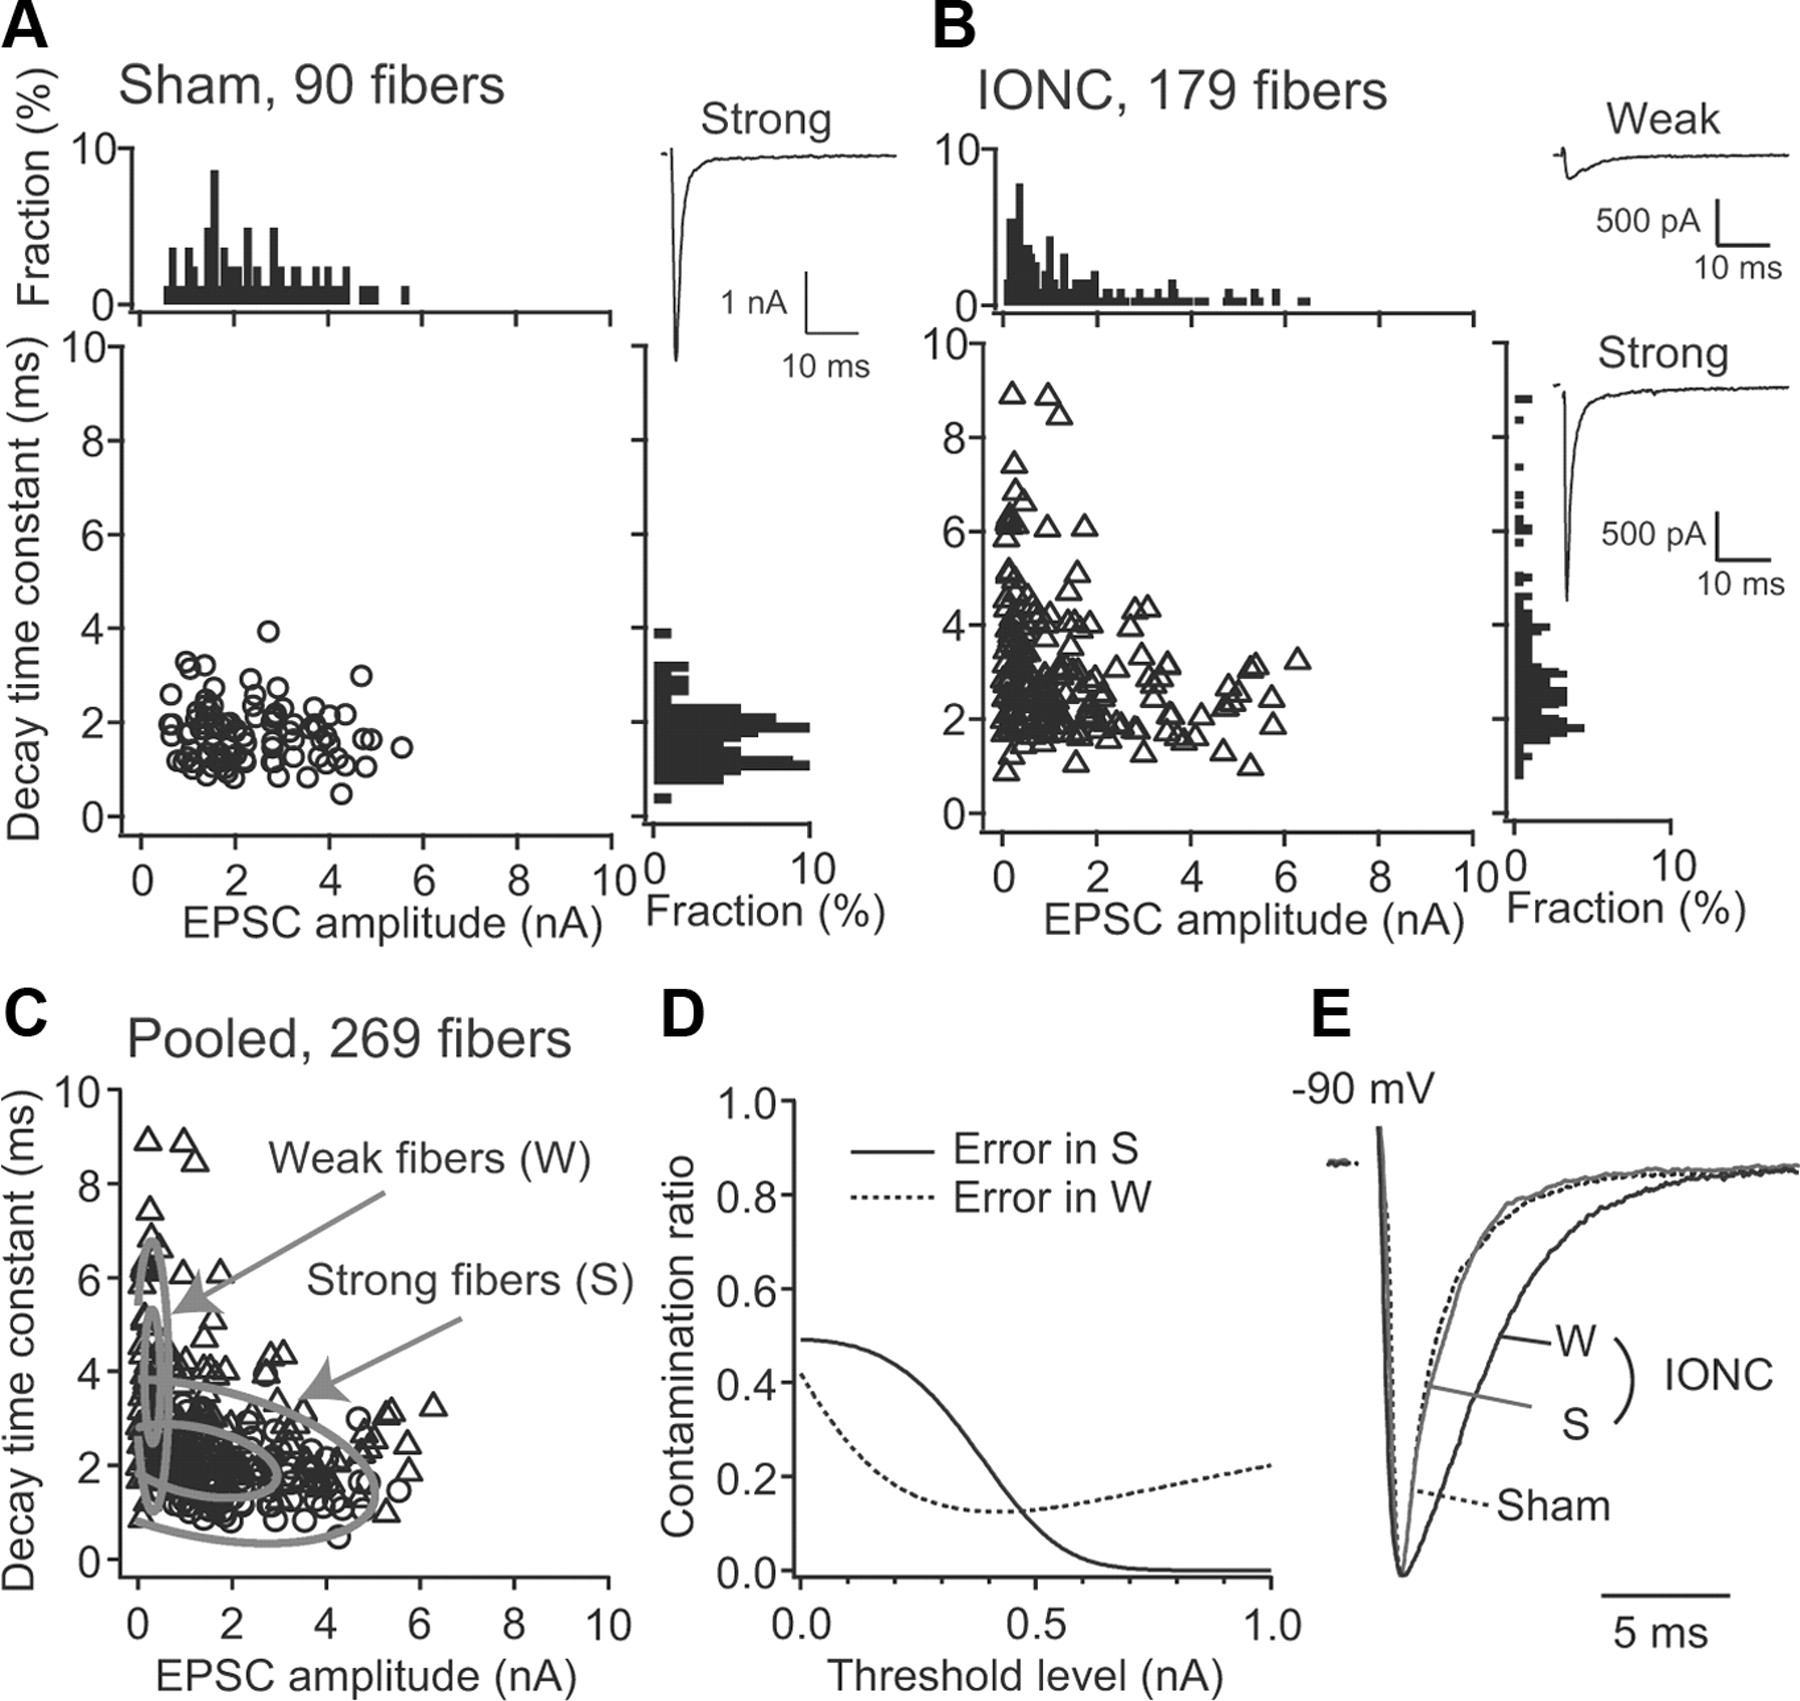
- Figure 4.
Single-fiber-mediated lemniscal EPSCs after the IONC are classified into weak and strong fiber groups. A, Decay time constant of single-fiber-mediated lemniscal EPSCs is plotted against its peak amplitude. Each symbol represents data from an individual lemniscal fiber at −70 mV. Histograms shown above and on the right are for EPSC amplitude and decay time constant, respectively. Inset shows a representative trace of single-fiber-mediated lemniscal EPSCs. B, The same as in A for the data from the IONC group. C, The pooled data from the sham and IONC groups were fitted with a summation of two independent Gaussian surfaces (see Materials and Methods). The two Gaussian surfaces represent two separable clusters for W- and S-fibers, respectively. Ellipsoidal lines represent 50 and 95% confidence regions for each Gaussian. D, The contamination ratio (see Materials and Methods) is plotted as a function of discriminating threshold (of EPSC amplitude). Each Gaussian was weighted. E, Distinct kinetics of AMPAR-mediated EPSCs among the three types of fibers. The pure AMPAR component was isolated in 100 μm dl-APV at −90 mV. Traces shown are normalized in amplitude [2633, 1436, and 551 pA for a sham fiber (broken line), an S-fiber in the IONC group (gray line), and a W-fiber in the IONC group (black line), respectively].
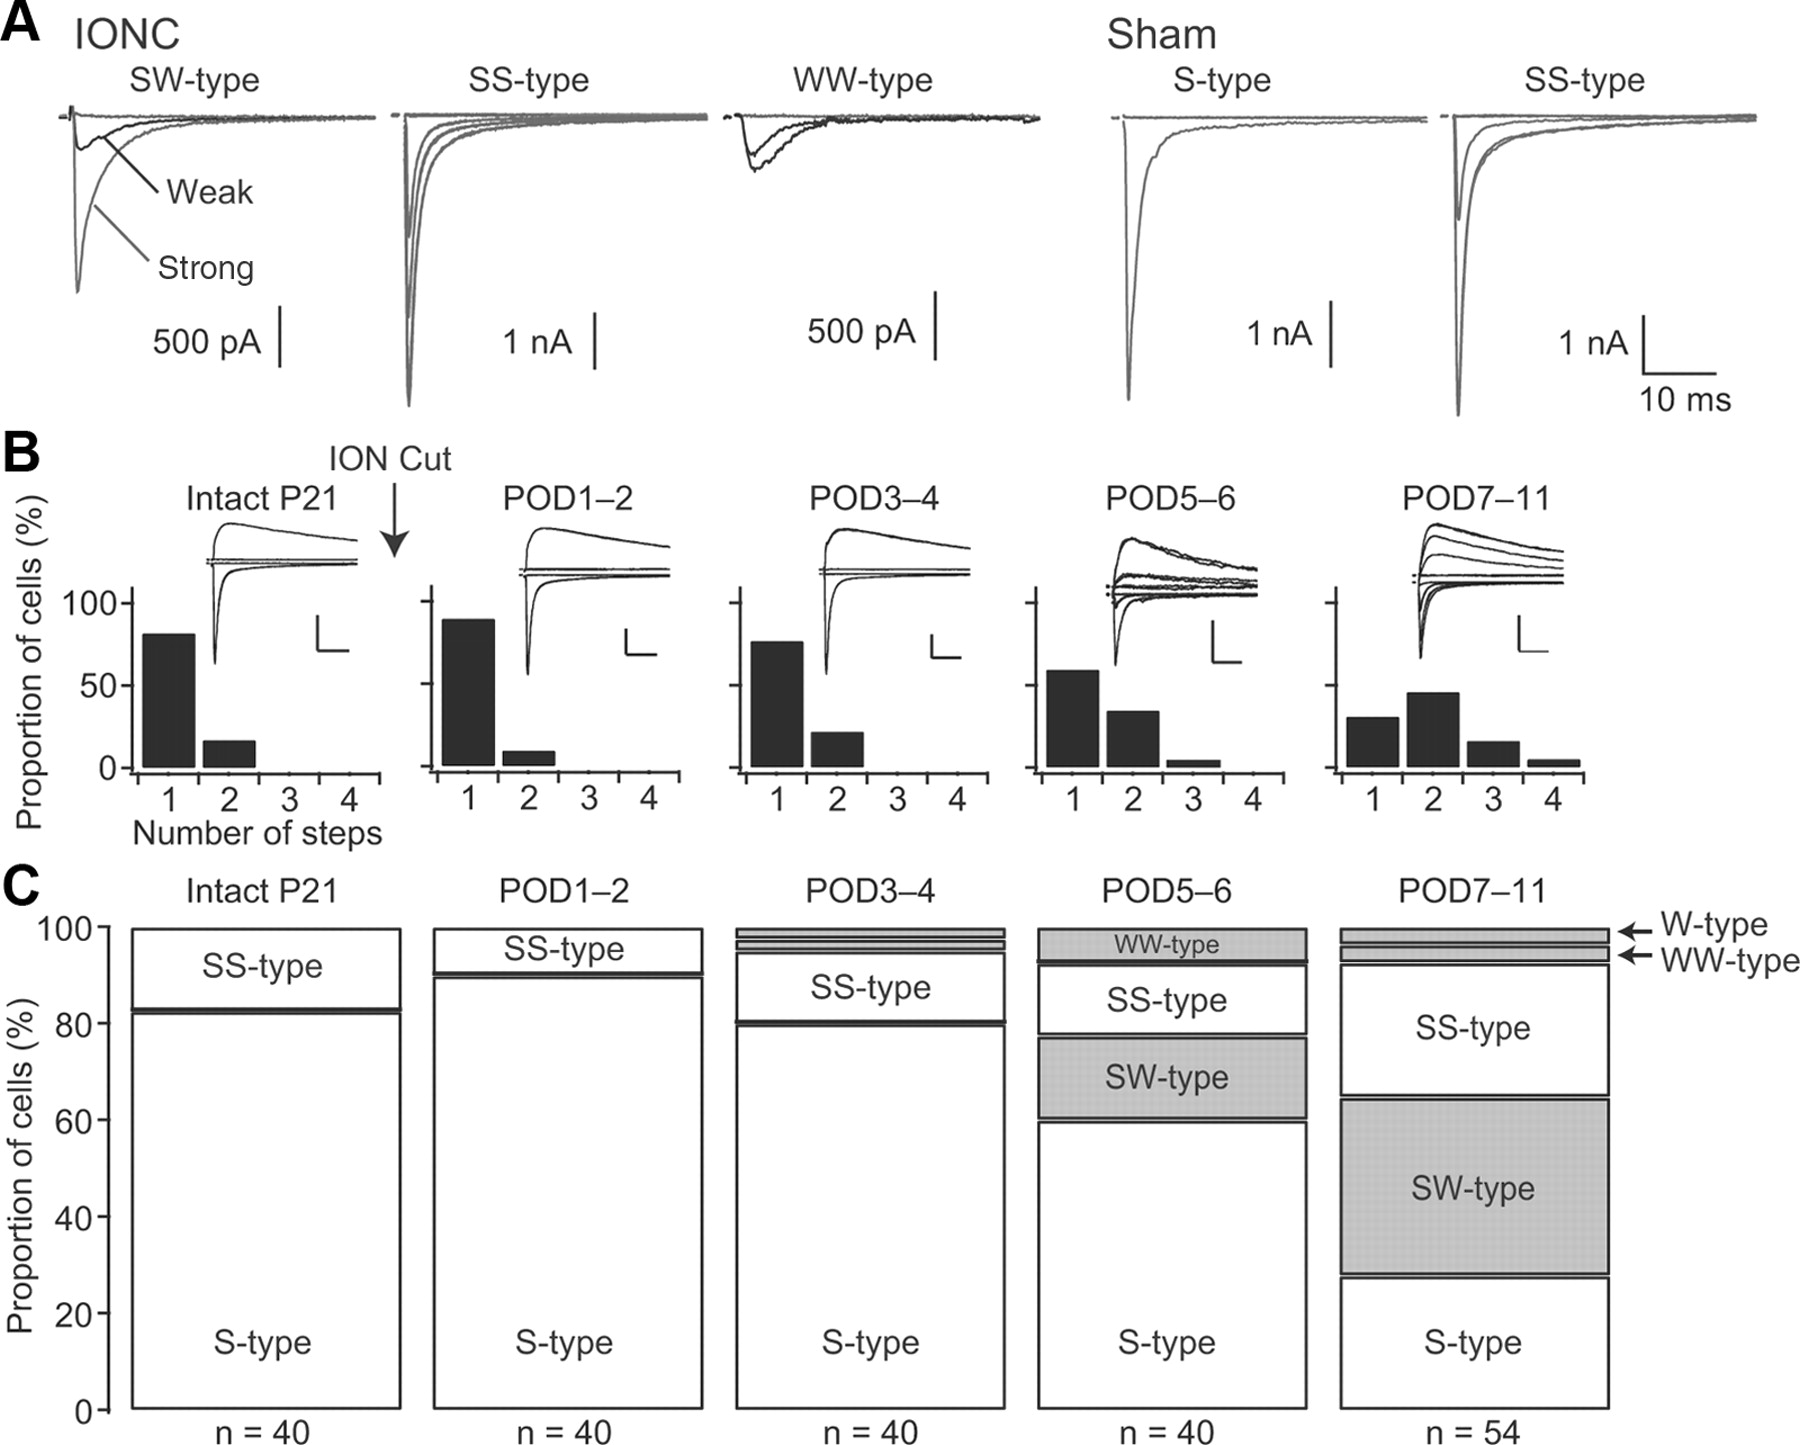
- Figure 5.
Time course of the rewiring after the IONC. A, Various innervation patterns of lemniscal fibers observed on POD7–POD11. S- and W-fiber-mediated EPSCs in the IONC group are represented as gray and black lines, respectively. Several raw traces at −70 mV with different stimulus intensities are superimposed. The S-type receives innervation from a single S-fiber; SS- and WW- types indicate relay neurons innervated by multiple S- and W-fibers, respectively; the SW-type is innervated by both S- and W-fibers. B, The distributions of neurons with different numbers of lemniscal inputs showing the time course of the rewiring after the IONC. Arrow indicates the operation day, P21. The first graph represents the data from intact P21 mice and the remaining four graphs from the IONC mice of POD1–POD2, POD3–POD4, POD5–POD6, and POD7–POD11, respectively. Insets show representative voltage-clamp traces of lemniscal EPSCs from each recording day. The holding potential was −70 or +40 mV. All time scales: 10 ms. Current scales: 2, 2, 2, 0.5, and 1 nA for P21, POD1–POD2, POD3–POD4, POD5–POD6, and POD7–POD11, respectively. C, Progressive changes in the way of lemniscal fibers innervating relay neurons on P21 and subsequent PODs. Shaded regions indicate the portions of relay neurons that contain input from W-fibers. Numbers of recorded cells are given at the bottom.
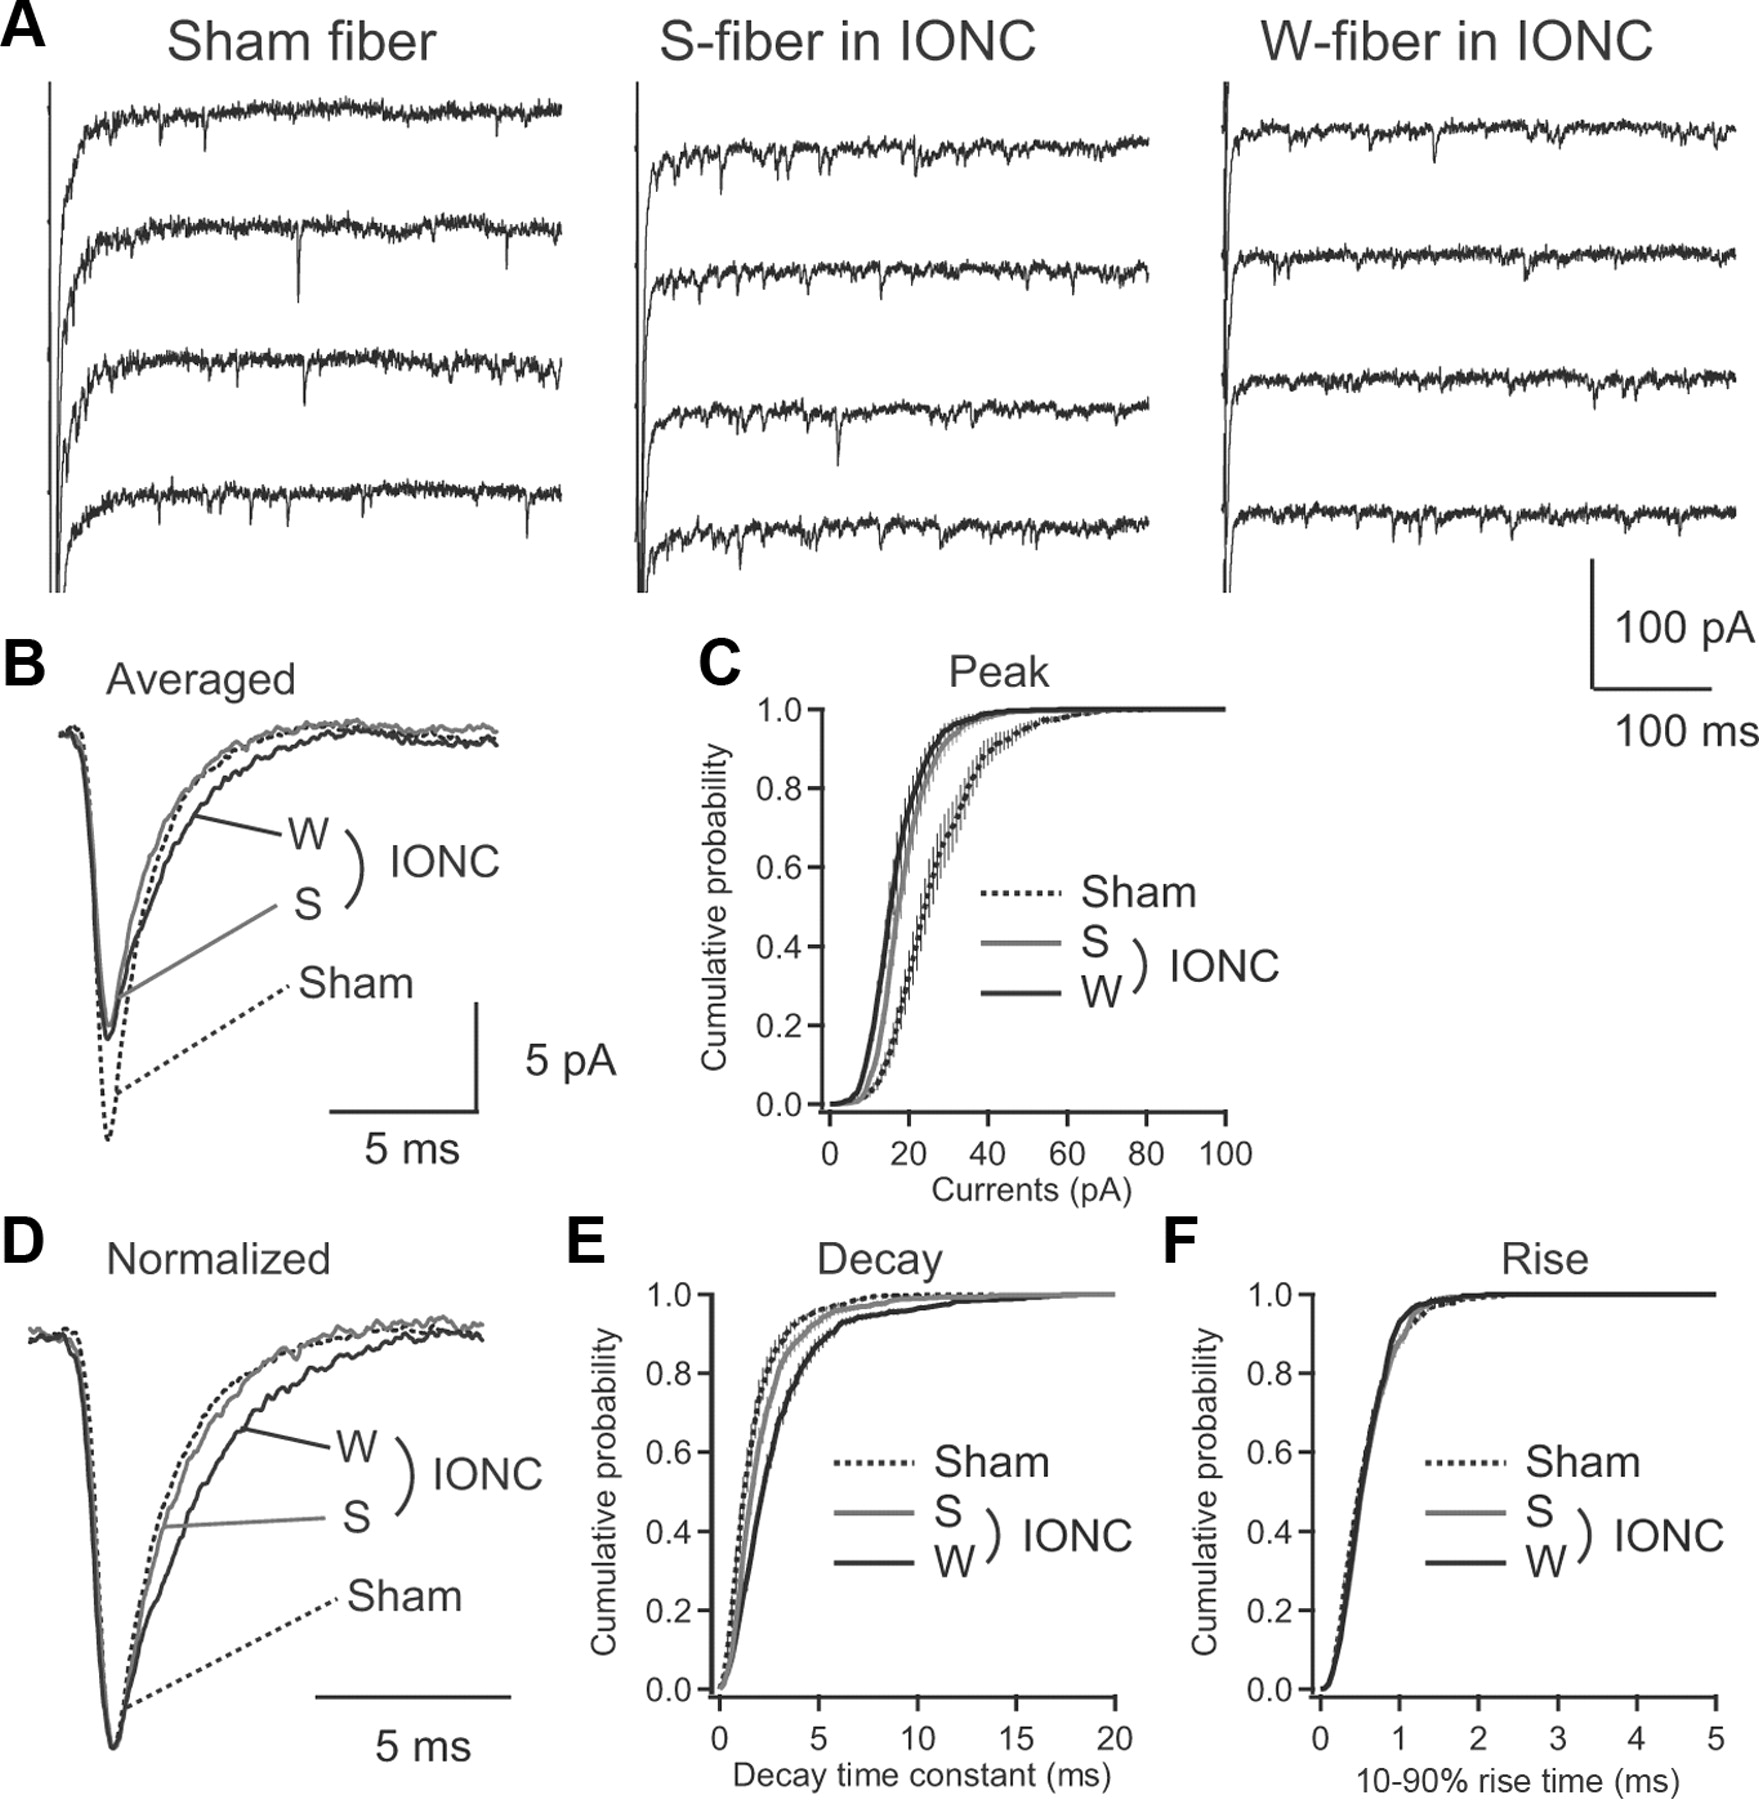
- Figure 6.
Analysis of asynchronous miniature EPSCs from individual lemniscal fibers. A, Representative traces of pure AMPAR-meditated asynchronous miniature EPSCs evoked by single lemniscal fiber stimulation in the presence of 4 mm Sr2+ ions. B, Averaged traces of asynchronous miniature EPSCs. Traces of 1517, 1341, and 1015 events from 12, 8, and 7 cells were averaged, respectively, for sham fiber (broken line), S-fiber in the IONC group (gray line), and W-fiber in the IONC group (black line). D, The same data as in B, but normalized by amplitude. C, E, F, Mean cumulative probabilities of amplitude, decay time constants, and 10–90% rise time, respectively. Data are represented as the mean ± SEM.
- Figure 7.
Relatively abundant GluA2-containing AMPARs at W-fiber synapses. A, Representative raw traces of pure AMPAR-mediated lemniscal EPSCs at holding potentials ranged ±60 mV in 10 mV steps in the three types of fibers. B, Current–voltage relationships of pure AMPAR-mediated lemniscal EPSCs in the three types of fibers. Asterisks indicate a significant difference between sham fiber and W-fiber in the IONC group. C, Summary bar graphs showing rectification indexes defined as EPSC amplitude at +40 mV divided by that at −40 mV. n, Number of fibers. D, Representative traces of the AMPAR-mediated lemniscal EPSCs in the presence (black) and absence (gray) of exogenously applied 1 mm spermine, an inhibitor of GluA2-lacking AMPARs. Each trace is the average of six consecutive raw traces. E, Summary bar graphs showing inhibitory effects of spermine on EPSC amplitude. n, Number of fibers. F, G, The same conventions as in D and E, respectively, but with 100 μm pentobarbital, an inhibitor of GluA2-containing AMPARs. All data are represented as the mean ± SEM. Statistical significance was tested by multiple t test with Bonferroni's correction following one-way ANOVA. *p < 0.05; **p < 0.01; n.s., not significant (two-tailed test).
- Figure 8.
The IONC operation causes small but significant increase in GluA2 expression in the contralateral VPM. A, A photomontage at low magnification showing a mild increase in GluA2 immunoreactivity in the contralateral VPM. B, C, Images at high magnification showing double immunofluorescence for GluA2 (red) and VGluT2 (green) in the ipsilateral (B1) and contralateral (C1) VPM and single immunofluorescence for GluA2 (B2, C2), respectively. Note that fluorescence intensity of VGluT2-associated GluA2 immunolabeling (indicated by arrows) is increased in the contralateral VPM. Hi (DG), Hippocampus (dentate gyrus); Rt, reticular nucleus of thalamus; Str, striatum; contra, contralateral; ipsi, ipsilateral. Scale bars: A, 1 mm; (in C2) B and C, 5 μm.
- Figure 9.
NMDAR-mediated component of lemniscal EPSCs after the IONC. A, Representative traces of lemniscal EPSCs mediated by a sham fiber, an S-fiber in the IONC group, and a W-fiber in the IONC group. Several raw traces with different stimulus intensities are superimposed. B, Summary bar graphs showing the mean of amplitude of NMDAR-mediated (left) and AMPAR-mediated (right) EPSCs. n, number of fibers. C, Summary bar graph showing the mean of NMDAR/AMPAR ratios (+40/−70 mV) from single-fiber-mediated lemniscal EPSCs. n, number of fibers. D, Representative raw traces of pure NMDAR-mediated lemniscal EPSCs at holding potentials between +40 and −100 mV in 10 mV steps with <20 μm NBQX. E, Current–voltage relationships of pure NMDAR-mediated lemniscal EPSCs. The number of tested fibers was 9, 10, and 10, respectively, for sham fibers, S-fibers in the IONC group, and W-fibers in the IONC group. F, Representative traces of pure NMDAR-mediated EPSCs are normalized by their peak amplitudes. Peak currents were 671, 1321, and 261 pA, respectively, for a sham fiber, an S-fiber in the IONC group, and a W-fiber in the IONC group. G, Summary bar graphs showing the decay time constants of NMDAR-mediated EPSCs from each of three kinds of fibers. n, Number of fibers. All data are expressed as the mean ± SEM. Statistical significance was tested by two-tailed multiple t test with Bonferroni's correction following one-way ANOVA (B, C), one-way ANOVA (G), and two-way repeated ANOVA (E), respectively. **p < 0.01. n.s., Not significant.
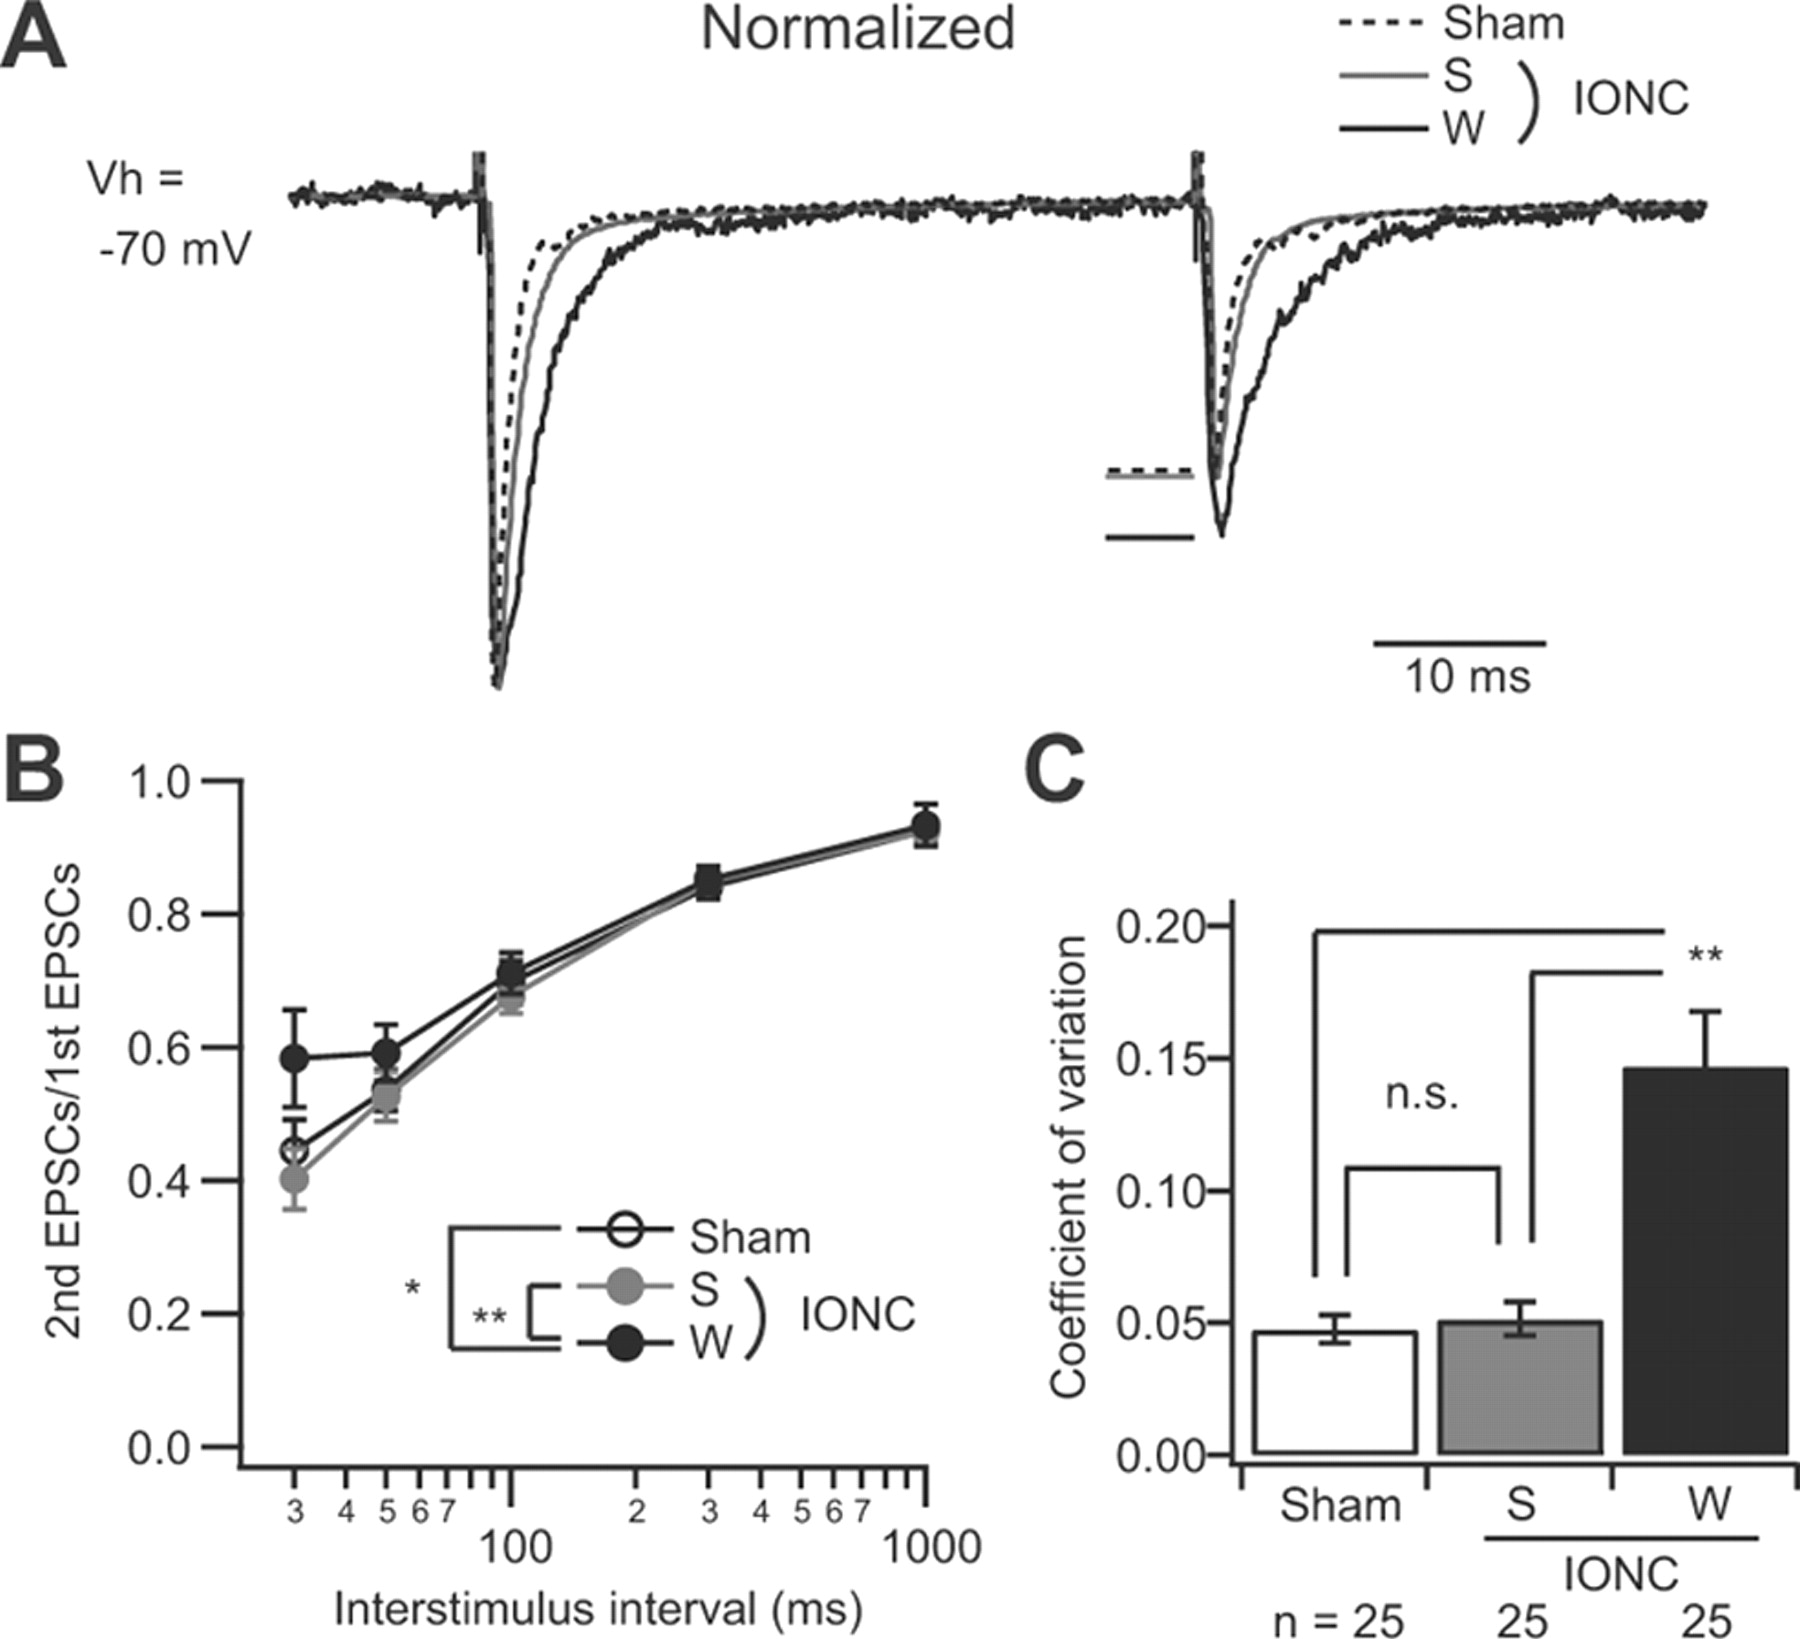
- Figure 10.
Altered presynaptic properties at W-fiber synapses. A, Representative traces of lemniscal EPSCs evoked by paired-pulse stimulation at a 50 ms interstimulus interval. Traces were normalized by peak amplitude of the first EPSC (2101, 5829, and 381 pA, respectively, for a sham fiber, an S-fiber in the IONC group, and a W-fiber in the IONC group). Horizontal lines indicate peak amplitudes of the second EPSCs. B, The mean of paired-pulse ratios plotted as a function of the interstimulus interval. The numbers of tested fibers are 6, 10, and 6, respectively, for sham fibers, S-fibers in the IONC group, and W-fibers in the IONC group. Each point represents the mean ± SEM. Statistical significance was tested by two-way repeated ANOVA. *p < 0.05. **p < 0.01. C, The coefficient of variation of 30 consecutive EPSC amplitudes was calculated and summarized. Each column represents the mean ± SEM from 25 separate fibers. Statistical significance was tested by two-tailed multiple t test with Bonferroni's correction following one-way ANOVA. **p < 0.01.
- Figure 11.
Neither whisker deprivation nor activity blockade of the infraorbital nerve induces multiple innervation of lemniscal fibers. A, The experimental schedule of whisker deprivation, which was performed every day from P21 to the recording day. B, Representative traces of lemniscal EPSCs from a deprived mouse, showing an all-or-none fashion. C, The distributions of neurons with different numbers of lemniscal inputs for the intact and deprived VPM. n, Number of cells. D, The experimental schedule of the infraorbital nerve blockade. Each arrow indicates the implantation day of EVAFLEX™ (EV) pieces containing either saline or tetrodotoxin (TTX). E, Representative traces of lemniscal EPSCs after EV-TTX implantation, showing an all-or-none response. F, The distributions of relay neurons in the VPM with different numbers of lemniscal inputs for the EV-saline-treated and EV-TTX-treated mice. n, Number of cells.


