

Article Figures & Data
Figures
- Figure 1.
Stepping on a horizontal ladder. The distance from the forward edge of the ladder rung and the tip of the cat's paw was measured (forward distance). All cats showed an overstep during the first week of intervention. By week 4, forward distance in the early training group had recovered to normal levels (p = 0.04). No improvement was found in the restraint-alone or delayed training groups.
- Figure 2.
Reaching to a target. Cats in the early and delayed training groups were trained five times per week, 1 h/d for 4 weeks. A–D, Density maps of reach endpoint positions. The black dot in the center of each density map indicates the position of the food target. Scale bar, 2 cm. Both the early (A) and delayed (C) training groups showed a dispersion of reaching endpoints in the first week of training. By week 4, reaching accuracy of the early training (B) group had significantly improved, indicated by a narrower distribution of reaching endpoints near the target. Insets in A and B show a drawing from a still-frame video image of the position of the arm at point of first contact. Note greater over-reaching in A than B. Accuracy in the delayed training group (D) did not improve by week 4. In A–D, the red ellipses indicate the distribution of reaches, as determined by principal components analysis.
- Figure 3.
A–C, Density maps of the distribution of axon terminations and synaptic boutons in the lower cervical spinal cord contralateral to the inactivated M1. Axons were traced from the inactivated M1. In all treatment groups, axon terminals and boutons were located in the lower part of the dorsal horn and the intermediate zone contralateral to the inactivated M1, their normal targets. D, Overlays of the distribution areas for untreated animals: inactivation alone, without intervention; control, no inactivation (from Friel and Martin, 2007). Although inactivation alone shifted axons and varicosities to the upper dorsal horn, all three interventions redirected axons and varicosities to the same region as controls. The upper row (A1-D1) presents data for CST axons; the lower row (A2-D2), for CST axon varicosities.
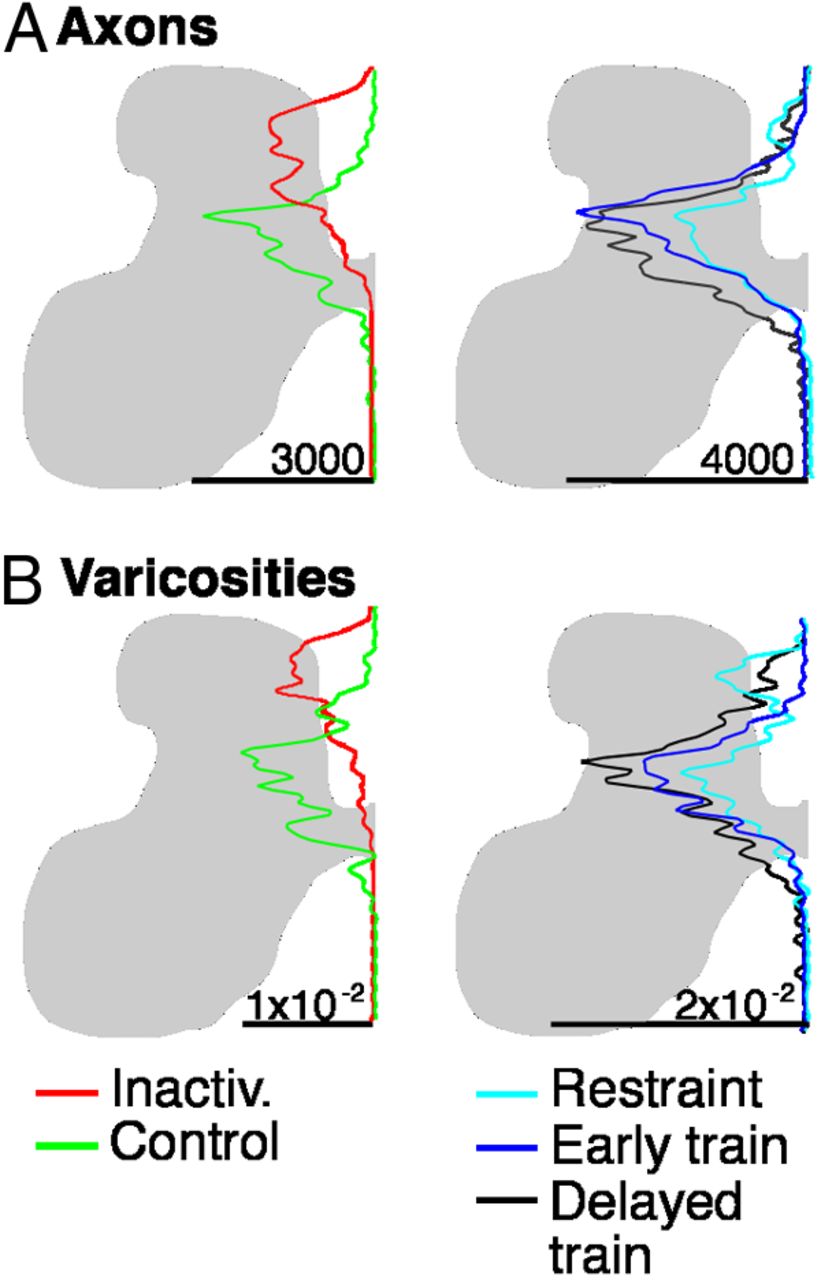
- Figure 4.
Dorsoventral distribution of CST axon within the gray matter of the lower cervical spinal cord contralateral to the inactivated M1 (A) and CST axon varicosities (B). Line graphs plot density on a left to right scale.
- Figure 5.
Confocal images of CST axon varicosity showing colocalization of BDA, PSD-95, and SYN. A, Axon terminal in the spinal intermediate zone from a control animal. A, Projection image (10 1-μm optical slices), triple labeled. A1–A3, One micrometer optical slice showing a BDA staining only (A1), PSD staining (A2), and SYN staining (A3). Yellow arrows point to labeling present; gray arrow point to the location in which optimal labeling for SYN (A3) and PSD (A5) is not present. A4–A6 are similar to A1–A3 but for the next optical slice. Insets in A1 and A4 show triple label for the single optical slices. B, Low-magnification view of location of CST label in the contralateral cervical spinal cord. Red box contains the axon used for analysis in C. C, Axon terminal in the spinal intermediate zone in a projection image; BDA staining only. The region outlined by the yellow square in C is shown in C1–C4, which are the same 1 μm optical slice but with different staining. The yellow arrow points to the same location in C1–C4. C1, Overlay of BDA, PSD-95, and SYN labels. C2, BDA only. C3, SYN only. The arrow points to a puncta of SYN. C4, PSD-95 only. The arrow points to a puncta of PSD-95. Scale bars, 10 μm.
- Figure 6.
Quantification of axon label and synaptic bouton density. A, Percentage axon label in dorsal, intermediate, and ventral spinal regions. Dashed lines represent values from inactivation/no-intervention and control/no-inactivation groups. All three treatment groups resulted in axons distributions similar to control/no-inactivation animals, with the greatest amount of label residing in the intermediate spinal laminae. B, Density of synaptic boutons in axon terminals in the intermediate zone. There were no statistically significant differences among treatment groups.
- Figure 7.
CST labeling of axons that originate in the right (contralateral to inactivation) M1 and terminate ipsilaterally, in the right side of the spinal cord. A–C, Density maps of the distribution of axon terminations (top) and CST axon varicosities (bottom) in the lower cervical spinal cord. There were no group differences in the amount of ipsilateral terminations or the density of synaptic boutons on these terminations. The upper row (A1-C1) presents data for CST axons; the lower row (A2-C2), for CST axon varicosities.
- Figure 8.
Distribution of ChAT-positive cells in the lower cervical spinal cord. A–C, Density maps of ChAT-positive cells in the cervical enlargement. The large dense clusters of cells in the ventral horn correspond predominantly to motoneurons. Note, the color scale is the same for all panels (red = 1.25 × 10⁻⁵ cells/square μm). Scale bar, 1 mm. D, Ratios of ChAT label on the affected (left side of spinal cord in figures) to the contralateral (right) sides of the spinal cord. Note that in the early training group, there was a much greater ratio of ChAT-positive cells in the intermediate zone (laminae I-VII) on the affected/trained side than the untrained side. The ratio of ChAT label in motor nuclei in all groups was symmetrical on the two sides.
- Figure 9.
Intracortical microstimulation. A, Representative motor maps from one animal in each treatment group. The dotted circle represents the approximate extent of the muscimol inactivation (Martin et al., 1999; Friel et al., 2007). The line midway between the columns of stimulation sites in each animal represents the cruciate sulcus. Site markers of multiple colors represent multijoint movements. Elbow and shoulder sites were combined and labeled proximal. No effect sites were tested up to 100 μA. The size of each site marker is proportional to the stimulus intensity needed to evoke a movement at that site. Scale bar, 1 mm. B, Percentage responsive sites in all groups. The percentage distal and multijoint sites were decreased in the inactivation, no-intervention, and restraint-alone groups, whereas the early and delayed training groups had similar amounts of distal and multijoint sites as control/no-inactivation animals. The inactivation, no-intervention, and restraint-alone groups had significantly more proximal sites than the no-inactivation, early, and delayed training groups. C, The thresholds at which movements could be evoked were statistically higher in the restraint-alone group than the early training, delayed training, and no-inactivation groups (*p < 0.05).


