

Article Figures & Data
Figures
- Figure 1.
VSD imaging provides high-resolution images of large region of the developing rat cortex. In this and all subsequent figures, 10 animals were used for group data analysis unless otherwise indicated. A, Diagram showing experimental setup. Panels to the right show simultaneously collected video of cortex and body. B, Montages of VSD images after cutaneous stimulation of limbs and tail. White dot is bregma. A, Anterior; L, left; P, posterior; R, right. C, EEGs recorded simultaneously with left hindlimb stimulation shown in B. VSD signal from HLS1,R is also shown. D, Map showing region of cortex activated by stimulating tail (green), right hind (red), and left hind (blue) relative to bregma (black circle). Open circles show geometric mean of activated cortex. Position of EEG electrode used for signals in C is shown. E, VSD signals evoked by stimulation of right hindlimb (right) and tail (left). In this and subsequent figures, light shaded region denotes SE.
- Figure 2.
Activity spreads asymmetrically after hindlimb stimulation. A, Mean images after right and left hindlimb stimulation. Images after left hindlimb stimulation has been flipped on medial–lateral axis. Top, Mean images showing VSD signal. Bottom, Intensity along a medial–lateral (black) and anterior–posterior (gray) axis through the point of initial activation (as shown by the solid line, first box, top). B, Left, VSD signal intensity at eight spatial points 0.975 mm from the point of initial activation, at three time points, after stimulation. Spatial points are shown and labeled in the rightmost image of the top of A. L-M, Lateral–medial axis; P-A, posterior–anterior axis; PM-AL, posterior–medial to anterior–lateral axis; AM-ML, anterior–medial to posterior–lateral axis. C, As described for B, except after tail stimulation. In this and subsequent figures, *p < 0.05.
- Figure 3.
Bursts of VSD signal in sensory cortex lead to correlation with the overall cortical pattern evoked by stimulating the limbs/tail. A, VSD signal (top), limb movement (middle), and concurrent correlation of instantaneous cortical activation pattern with pattern evoked by limb/tail stimulation (bottom). B, Montages showing cortical activity every 100 ms in shaded gray regions highlighted in A.
- Figure 4.
Cortical bursts and twitches have a variable relationship. A, VSD signal (top), limb movement (middle), and concurrent correlation of instantaneous cortical activation pattern with pattern evoked by limb/tail stimulation (bottom). Note that bursts may or may not be preceded by a twitch in the corresponding limb. B, Left, Probability density function of a limb twitch being followed by a burst in the corresponding subregion of S1, across time points relative to the twitch. Right, Probability density function of a burst of VSD signal in S1 being preceded by a twitch in the corresponding limb, across time points relative to the burst. C, Probability of a peak of VSD signal in a subregion of S1 being preceded by a corresponding limb twitch (y-axis), across correlation with appropriate sensory template at the time of the VSD peak (x-axis). Because of the small numbers of correlation values above 0.6 and below 0, we binned these values together.
- Figure 5.
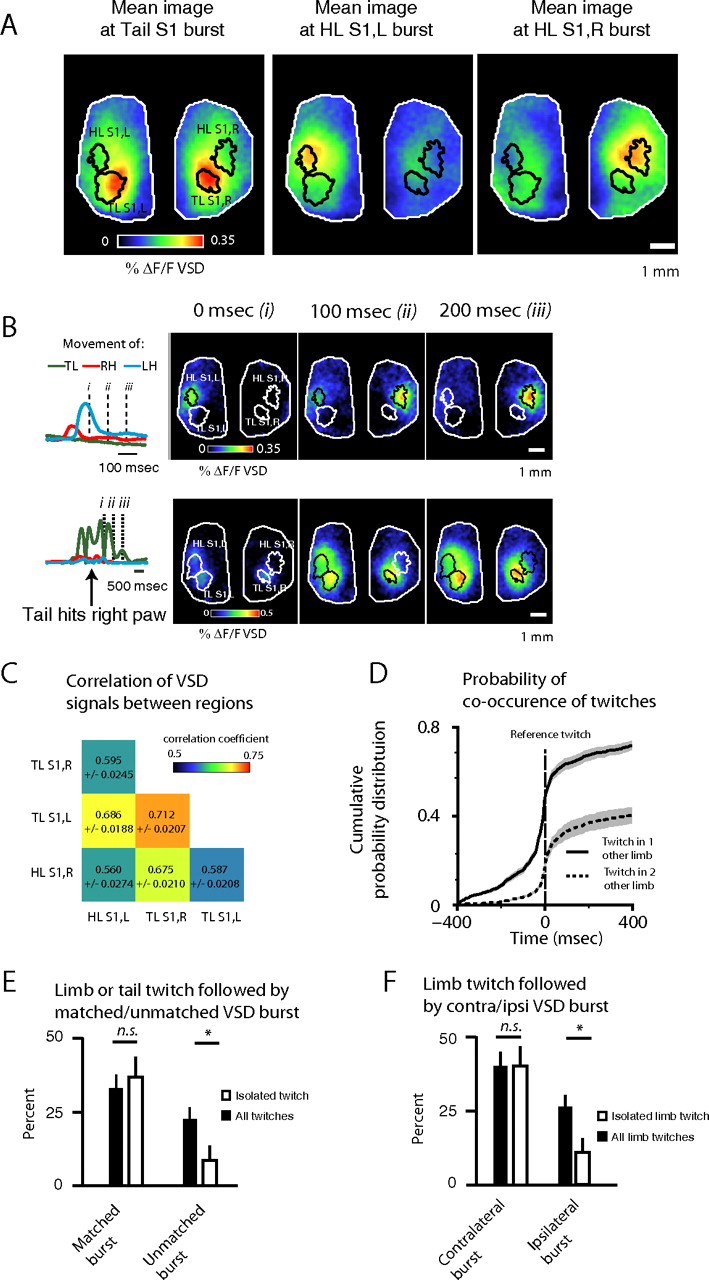
Changes in VSD signal are correlated across sensory regions. A, Images from one animal show the mean image of cortical activation for peaks of VSD signal in TLS1, HLS1,L, and HLS1,R. respectively. B, Interactions between limbs contribute to correlated VSD signals in sensory cortices. Montages show cortical activity after limb twitch, shown at right of montages. Dotted lines show time of images within montage. Top, Right and left hindlimb twitch in sequence. Bottom, Tail twitches and strikes left hindlimb. C, Matrix showing correlation of VSD signals between subregions of S1. D, Probability density function of one or two additional twitches across time points relative to a given twitch. E, Likelihood of a twitch being followed by a matched or unmatched burst, for all twitches (left) versus isolated twitches (right). F, Likelihood of a limb twitch being followed by a contralateral or ipsilateral bursts, for all bursts (left) versus isolated bursts (right).
- Figure 6.
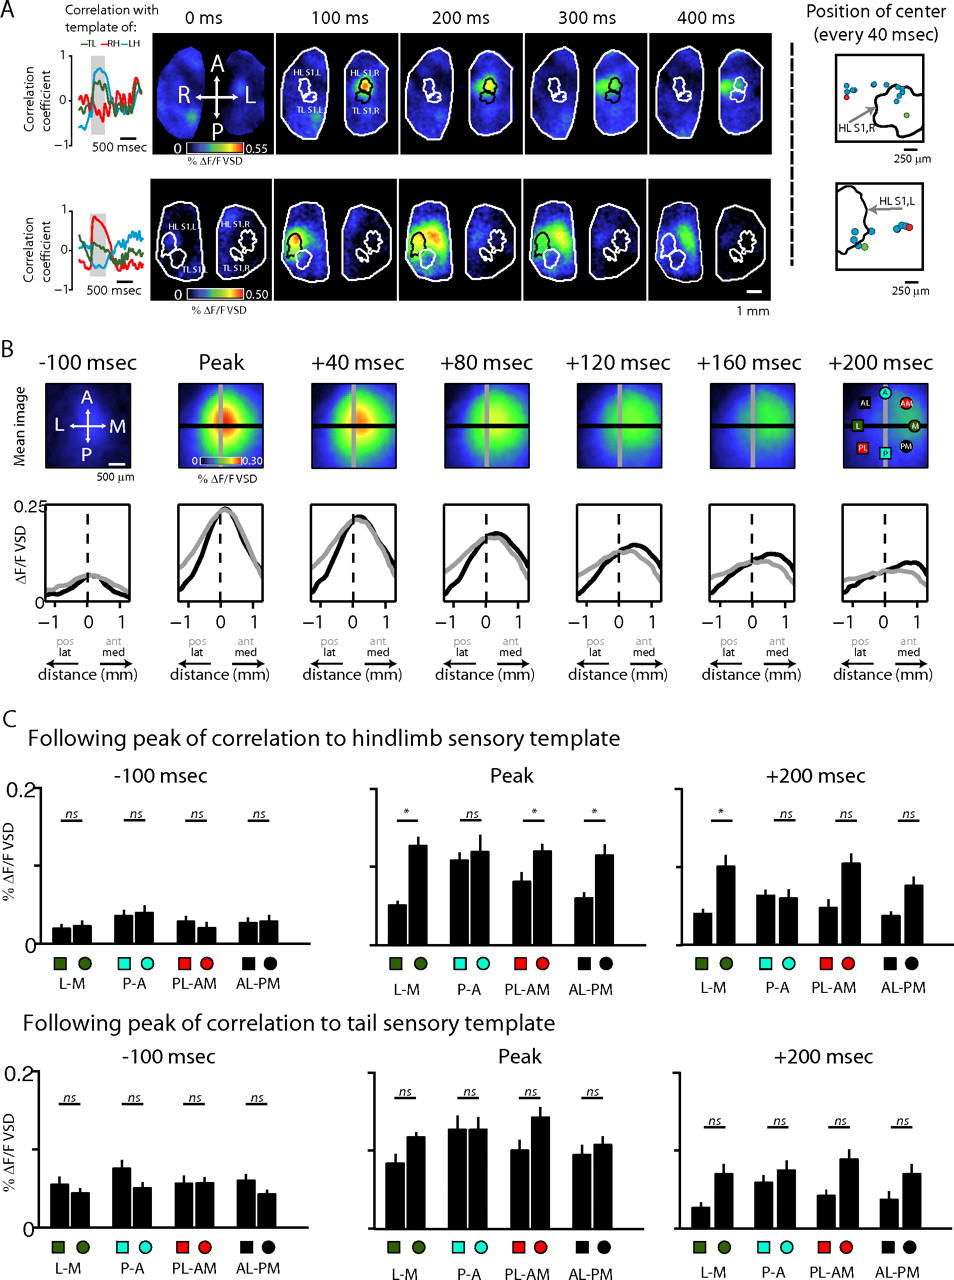
Cortical activation of sensory regions spreads medially. A, Montages show examples of cortical activity at time of HLS1,R (top) and a HLS1,L activation (bottom). At the left of the montages, ongoing correlation with sensory templates is shown. Gray region denotes times represented in montages. Panels at the right of the montages show instantaneous position of center of burst at 40 ms intervals; green dot denotes position at burst onset, and red dot denotes position at burst end. B, Top, mean images showing VSD signal before, during, and after bursts of VSD activity that were correlated with their corresponding sensory templates. Bursts were included if they had a correlation above 0.3 with their corresponding sensory template. Bottom, VSD signal along a medial–lateral (black) and an anterior–posterior (gray) axis through the center of the sensory cortex. Lines representing these axes are shown in top panels. C, Top, VSD signal intensity at eight spatial points 0.975 mm from the point of initial activation, at three time points, after stimulation. Spatial points are shown in the rightmost image, top panel, of Figure 6A. L-M, Lateral–medial axis; P-A, posterior–anterior axis; PM-AL, posterior–medial to anterior–lateral axis; AM-ML, anterior–medial to posterior–lateral axis. Bottom, as described for the top, expect for bursts correlated with tail template. A, Anterior; L, lateral; P, posterior; M, medial.
- Figure 7.
Limb twitches initiate dynamic activity across the cortex. A, Example VSD signals correlated with movement signals from one hindlimb. The correlation between the delayed VSD signal at each pixel and the movement signal was calculated and used to generate a map showing the correlation of VSD signals from each region with the limb movement signal (sequence of VSD images shown at left, VSD and limb movements shown in middle, final map of all correlation values shown at right). B, Example images from one pup showing the correlation value of each pixel with limb movement signals. Note the peak of correlation in, and medial to, the associated sensory cortex; note no correlation in the control (2 s delay) image. C, Correlation values between VSD signals and limb movements at points relative to sensory cortex across time delays. Time of maximal correlation is shown by vertical line in matching color. Note close cluster of times, except for medial region of cortex (red). Control signal offset by 2 s. D, Top panels show delay giving maximal correlation across medial–lateral axis (left) and anterior–posterior axis (right). Colors match C. Bottom panels show maximal value of correlation across same axes. Med, Medial; Lat, lateral; Pos, posterior; Ant, anterior; Cont, control.
- Figure 8.
Bursts in the absence of twitches may occur in non-somatosensory regions of cortex. A, Montages show two examples of bursts not associated with twitches in any limbs. B, Maps showing relative frequency of activation of cortex for bursts following within 300 ms (left), or not following (right), a twitch. We calculated the mean image of each burst and aligned all bursts across animals on the center of HLS1. Each pixel is colored to represent the relative number of bursts that overlapped it. Note the different scale bars in the two images. C, Correlation between mean VSD image after a twitch and the corresponding sensory template (Twitch, matched), compared with the same value for bursts that do not follow a twitch (No twitch). Because there is no corresponding sensory template with which to calculate the correlation value, it was calculated with all three templates, and the maximum of the three was considered the correlation with a sensory template. For comparison, correlation between brain activity after a twitch and two non-corresponding sensory templates are also shown (Twitch, unmatched).


