

Article Figures & Data
Figures
- Figure 1.
Example of analysis of the effects of DBS on the activity of one single unit recorded in GPe. A, Firing rate over a 15 min recording session. Bar indicates 130 Hz STN-DBS. Firing rate of this unit did not change during DBS. Bin size = 5 s. B, ISI histograms before (pre-stim), during (stim), and after (post-stim) stimulation. Peaks during stimulation indicate that the neuron fired at integer multiples of the interpulse interval (IPI). Arrow indicates second harmonic of the IPI. Bin size = 1 ms. C, Spectral power pre-stim, stim, and post-stim. Low-frequency peak at ∼9 Hz present in pre-stim and post-stim periods was reduced during DBS (arrowheads). Power at stimulation frequency of 130 Hz was increased during DBS (arrows). Peaks at 130 Hz during the pre-stim and post-stim periods are due to blanking periods inserted at the stimulation frequency (arrows). D, PSTH. Peaks at 1.2 and 2.9 ms (arrows) indicate that this neuron fired at regular intervals during DBS. Bar indicates stimulation artifact. Bin size = 0.1 ms. E, Coherence between single unit analyzed in A–D and another single unit recorded simultaneously in SNr over the pre-stim, stim, and post-stim periods. Coherence significantly decreased from pre-stim to stim and post-stim to stim only at 7–10 Hz (p < 0.05). Coherence significantly increased from pre-stim to stim and post-stim to stim only at 128–133 Hz (p < 0.05). There were no significant differences in coherence between pre-stim and post-stim conditions. Significance levels were calculated from estimates of the variance using a jackknife over tapers and 10 s segments (Bokil et al., 2007).
- Figure 2.
Histological evaluation of extent of dopaminergic cell loss and location of stimulating and recording electrodes. A, Coronal section from a 6-OHDA-lesioned rat immunostained for tyrosine hydroxylase (brown) and counterstained with cresyl violet (purple). Note dopaminergic cell loss in SNc on lesioned side (arrows). B–D, Coronal sections from a 6-OHDA-lesioned rat stained for cytochrome oxidase. Dashed lines indicate borders of STN (B), SNr (C), and GPe (D). B, Stimulating electrode track with tip located in STN. C, D, Recording electrode tracks with tips located in SNr (C) and GPe (D). E, Locations of stimulation electrode tips (red dots) used for bipolar stimulation (n = 13 rats). In all rats, at least one electrode used for bipolar stimulation was positioned within STN. STN, Dark gray; cerebral peduncle, light gray.
- Figure 3.
Effect of DBS frequency on methamphetamine-induced circling. A, Effect of DBS frequency on circling rate across all rats (frequency was a significant factor p < 0.05, one-way repeated-measures ANOVA; different letters indicate significant differences p < 0.05, post hoc Fisher's PLSD). B, Effect of DBS frequency on distance traveled across all rats (frequency was a significant factor p < 0.05, one-way repeated-measures ANOVA; different letters indicate significant differences p < 0.05, post hoc Fisher's PLSD). Bars represent mean ± SE (n = 13).
- Figure 4.
Effect of DBS frequency on haloperidol-induced akinesia. Asterisks indicate time points at which 130 and 185 Hz conditions were significantly different from all other conditions (p < 0.05, two-way repeated-measures ANOVA; p < 0.05, post hoc Fisher's PLSD). Hash marks indicate time points at which 30 and 75 Hz conditions were significantly different from all other conditions (p < 0.05, two-way repeated-measures ANOVA; p < 0.05, post hoc Fisher's PLSD). Bars represent mean ± SE (n = 11).
- Figure 5.
A–F, Effects of DBS frequency on neuronal firing rates in GPe (A, C, E) and SNr (B, D, F). A, B, Mean firing rate for GPe (A) and SNr (B). No difference in mean firing rate was observed between healthy and lesion conditions in either region, or between DBS-off and DBS-on at any frequency in either region (two-way repeated-measures ANOVA). C, D, Firing rate for individual neurons (a single row in colorplot represents one neuron) normalized to DBS-off firing rate in GPe (C) and SNr (D). Color maps are sorted based on response during stimulation from most inhibitory to most excitatory within each stimulation condition. Note increase in number of neurons with either excitatory or inhibitory responses with increasing stimulation frequency. E, F, Categorization of individual neurons in GPe (E) and SNr (F) based on change in firing rates. Difference in percentage of neurons with decreased, increased, or no change in firing rates across various frequencies of stimulation was significant (Pearson's χ2 test, p < 0.05). Bars represent mean ± SE (GPe: healthy, n = 91; postlesion, n = 62 and SNr: healthy, n = 70; postlesion, n = 51). Gray boxes separate results by the neural regions analyzed.
- Figure 6.
A–F, Effects of DBS frequency on neuronal oscillations quantified from power spectra of single-unit firing times in GPe (A–C) and SNr (D–F). A, D, Power spectra for healthy (A1, D1) and lesioned rats with and without stimulation at 30 Hz (A2, D2) and 130 Hz (A3, D3). Insets are zoomed views (5–15, 25–35, or 125–135 Hz) of wider frequency range (0–200 Hz). Peak centered at ∼9 Hz was present in both GPe (A2, A3) and SNr (D2, D3) in lesioned rats with no stimulation. Peak was not present in healthy condition (A1, D1), and HFS reduced these low-frequency oscillations in GPe (A3) and SNr (D3). Peaks in spectrum at the stimulation frequency increased in magnitude during DBS in both GPe (A2, A3) and SNr (D2, D3). Lines represent mean (colored) ± SE (shaded gray) (GPe: healthy, n = 91; postlesion, n = 62 and SNr: healthy, n = 70; postlesion, n = 51). B, C, E, F, Sum of spectral power over low-frequency (7–10 Hz) (B, E) and stimulation frequency (stimulation frequency ± 1 Hz) (C, F) bands in GPe (B, C) and SNr (E, F). HFS reduced low-frequency oscillations (B, E) and increased oscillatory activity at stimulation frequency (C, F) (p < 0.05, two-way repeated-measures ANOVA; Different letters indicate significant differences p < 0.05, post hoc Fisher's PLSD). Bars represent mean ± SE (GPe: healthy, n = 91; postlesion, n = 62 and SNr: healthy, n = 70; postlesion, n = 51). D, E, and F use the same figure legends as A–C. Gray boxes separate results by the neural regions analyzed.
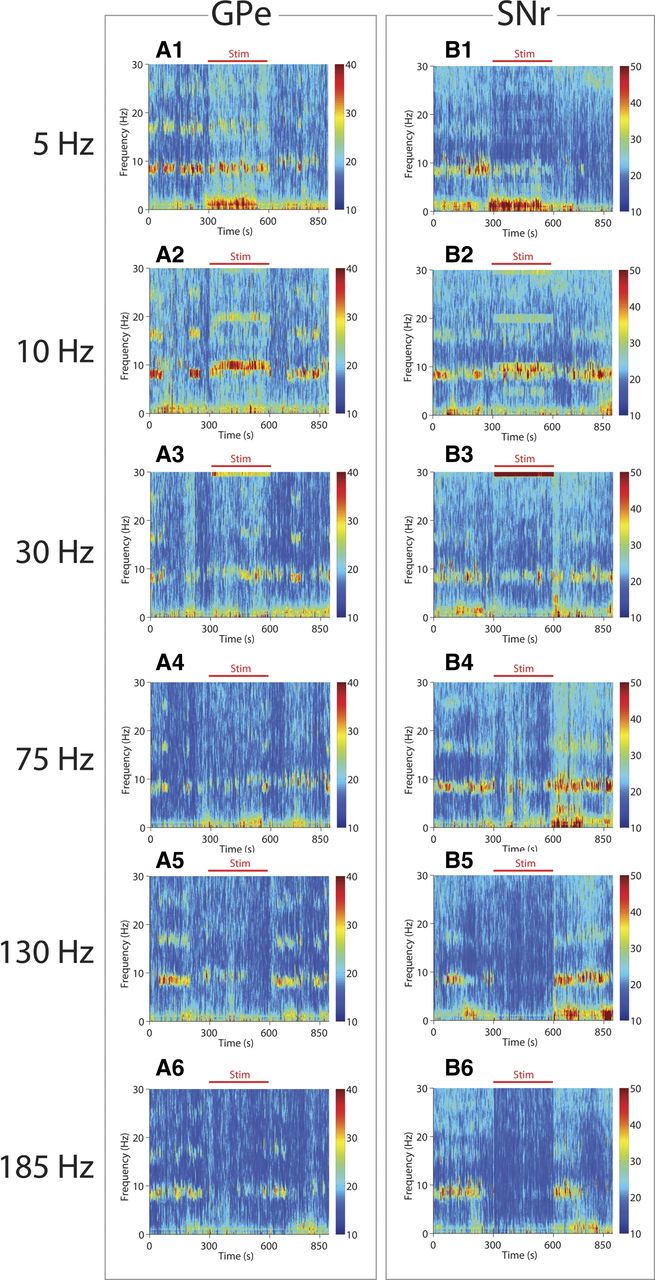
- Figure 7.
A1–B6, Time-frequency spectrograms showing effect of DBS on low-frequency neuronal oscillations in GPe (A1–A6) and SNr (B1–B6). Plots show mean spectral power (GPe = 62 neurons; SNr = 51 neurons). Color bar indicates spectral power. Note inhibition of low-frequency oscillations (7–10 Hz) during HFS (A5, A6, GPe; B5, B6, SNr). Gray boxes separate results by the neural regions analyzed.
- Figure 8.
Effect of DBS frequency on phase locking of neuronal firing to the stimulus pulse as measured by vector strength. HFS was associated with high vector strength, indicating that neuronal activity was more synchronized with stimulation pulses during HFS. Bars represent mean ± SE (p < 0.05, one-way repeated-measures ANOVA. Different letters indicate significant differences p < 0.05, post hoc Fisher's PLSD. GPe = 62 neurons; SNr = 51 neurons).
- Figure 9.
Effect of DBS frequency on coherence between pairs of simultaneously recorded neurons within and across GPe and SNr. A1–B3, The percentage of neuron pairs categorized as showing decreased, no change, or increased coherence during DBS with different stimulation frequencies within GPe (A1, B1), SNr (A2, B2), and across GPe and SNr (A3, B3). Within GPe (A1) and within SNr (A2), DBS at stimulation frequencies ≤75 Hz decreased coherence in the 7–10 Hz band less than stimulation frequencies ≥130 Hz. Within GPe (B1) and within SNr (B2), there was a trend toward increased coherence in the stimulation band with increased stimulation frequency. A3, Across GPe and SNr, DBS at stimulation frequencies ≤75 Hz decreased coherence in the 7–10 Hz band less than stimulation frequencies ≥130 Hz. B3, Across GPe and SNr, there was a trend toward increased coherence in the stimulation band with increased stimulation frequency. Difference in percentage of neurons with decrease, increase, or no change in coherence across frequencies of stimulation was significant (Pearson's χ2 test, p < 0.05; GPe: 283 unique neuronal pairs across 7 rats; SNr: 203 unique neuronal pairs across 6 rats; GPe and SNr: 263 unique neuronal pairs across 3 rats). Gray boxes separate results by the neural regions analyzed.


