

Abstract
Many previous studies have demonstrated that changes in selective attention can alter the response magnitude of visual cortical neurons, but there has been little evidence for attention affecting response latency. Small latency differences, though hard to detect, can potentially be of functional importance, and may also give insight into the mechanisms of neuronal computation. We therefore reexamined the effect of attention on the response latency of both single units and the local field potential (LFP) in primate visual cortical area V4. We find that attention does produce small (1–2 ms) but significant reductions in the latency of both the spiking and LFP responses. Though attention, like contrast elevation, reduces response latencies, we find that the two have different effects on the magnitude of the LFP. Contrast elevations increase and attention decreases the magnitude of the initial deflection of the stimulus-evoked LFP. Both contrast elevation and attention increase the magnitude of the spiking response. We speculate that latencies may be reduced at higher contrast because stronger stimulus inputs drive neurons more rapidly to spiking threshold, while attention may reduce latencies by placing neurons in a more depolarized state closer to threshold before stimulus onset.
Introduction
Attention can alter firing rates of visual cortical neurons (Moran and Desimone, 1985; Mountcastle et al., 1987; Spitzer et al., 1988; Roelfsema et al., 1998; McAdams and Maunsell, 1999; Reynolds et al., 1999, 2000; Treue and Martínez Trujillo, 1999; McAdams and Reid, 2005; Williford and Maunsell, 2006; Mitchell et al., 2007; Khayat et al., 2010). Its effect on the timing of the response is less obvious. Elevation of contrast reduces the response latency of visual cortical neurons (Celebrini et al., 1993; Carandini and Heeger, 1994; Albrecht, 1995; Gawne et al., 1996; Reich et al., 2001). Models of contrast gain control can account for this contrast-dependent reduction in latency (Victor, 1987; Carandini and Heeger, 1994; Carandini et al., 1997) and there is evidence that attentional feedback modulates the circuitry that mediates contrast gain control (Reynolds et al., 1999, 2000; Reynolds and Chelazzi, 2004; Reynolds and Heeger, 2009; Lee and Maunsell, 2009; but see, Thiele et al., 2009). However, current evidence suggests that changes in attention do not significantly alter response latency (Reynolds et al., 2000; Bisley et al., 2004; Cook and Maunsell, 2004; McAdams and Reid, 2005; Lee et al., 2007).
Modest changes in the relative latency of neurons can be functionally important (VanRullen et al., 2005). Feedforward inhibition has been shown to have powerful effects in cortex for timing changes on the order of 2 ms or less (Pouille and Scanziani, 2001; Swadlow, 2003). It has also been proposed that small changes in relative timing of inputs could create a temporal gating system for controlling information flow in cortex (Gawne, 2008). Small changes in response latency could also yield insight into the mechanisms of neuronal computation.
Given the potential importance of even small changes in response latency, we revisited the question of whether attention modulates response latency. We examined the latencies of the spiking and local field potential (LFP) responses evoked by a stimulus when attention was either directed toward the stimulus or away to a second stimulus that was placed contralateral to the receptive field. The LFP is the low-frequency (typically <100 Hz) component of the potential recorded from a microelectrode. It provides information that is complementary to that of spikes, reflecting the subthreshold potentials driven primarily from a local population of neurons (Mitzdorf, 1985; Kamondi et al., 1998; Logothetis, 2002, 2003; Buzsaki, 2006; Monosov et al., 2008). Changes in attention could therefore affect response dynamics of the LFP that are not obvious in spiking responses.
We find that attention causes a small but significant reduction in the latency of the spiking and LFP responses. Attention and contrast are distinct in their influence on the magnitude of the stimulus-locked local field potential, with increasing contrast causing an increase in the depth of the initial LFP transient response, and attention diminishing the depth of the same trough. Thus, while attention changes response latency, it most likely does so via different mechanisms than those involved in contrast changes. We considered possible underlying mechanisms in the Discussion.
Materials and Methods
Subjects and surgery.
Preoperative MRI was used to identify the stereotaxic coordinates of V4 in two adult male rhesus monkeys (Macaca mulatta). Experimental and surgical procedures have been described previously (Reynolds et al., 1999). A recording chamber was placed over the prelunate gyrus. At the beginning of the study, several recordings were made at different positions in each recording chamber to ensure that the electrode was in area V4, on the basis of receptive field (RF) sizes, topographic organization, and feature preferences. To inhibit granulation tissue growth in the chamber, the anti-mitotic 5-fluorouracil was applied to the tissue in the chamber three times each week (Spinks et al., 2003). Experimental and surgical procedures were approved by the Salk Institute Institutional Animal Care and Use Committee and conformed to NIH guidelines for the care and use of laboratory animals.
Electrophysiology and stimulus presentation.
In each experimental session, two to four tungsten electrodes (FHC) were advanced into cortex using a multielectrode drive (NAN 4-tower drive, Plexon; or 3NRM-3A microdrive, Crist Instrument). Electrodes were passed through guide tubes that touched but did not penetrate the dura. Guide tubes were positioned using a grid with 1 mm spacing between adjacent locations. Neuronal signals were recorded extracellularly, filtered, and stored using the Multichannel Acquisition Processor system (Plexon). To record spiking activity, the signal was filtered from 400 Hz to 8.8 kHz and digitized at 40 kHz. Single units were isolated online with Rasputin software (Plexon). Spike sorting was then repeated offline using the Plexon Offline Sorter to ensure that all action potentials were well isolated throughout the recording session. Single units recorded on a given electrode were isolated by waveform shape and included for analysis only if the waveforms formed an identifiable cluster when projected into the space defined by the principal components derived from the all waveforms recorded on that electrode.
The cortical LFP consists of two components: a fast local (retinotopic) component and a slow distributed (nonretinotopic) one (Doty, 1958; Ebersole and Kaplan, 1981; Gawne, 2010; Kasamatsu et al., 2005; Kitano et al., 1994, 1995). In this study, we restricted our analysis to the fast local component of the LFP, because it is the one that is most closely associated with local neuronal activity. In particular, the fast local component has a latency and retinotopic spread that is closely related to local spiking activity. To record LFP activity, the signal was filtered from 0.7 Hz to 170 Hz and digitized at 1 kHz.
Stimuli were presented on a computer monitor (Sony Trinitron Multiscan, TC, 640 × 480 pixel resolution, 120 Hz) placed 57 cm from the eye. Lookup tables were linearized using a PR-650 or PR-701S spectroradiometer (Photo-Research). Eye position was continuously monitored with an infrared eye tracking system (240 Hz, ETL-400; ISCAN). Experimental control was handled by NIMH Cortex software (http://www.cortex.salk.edu/).
Behavioral task.
Neuronal responses were recorded as the monkey performed an attention-demanding multiple-object tracking task. Task and stimulus conditions were as described by Sundberg et al. (2009). Briefly, the monkey began each trial by fixating a central point for 200 ms and then maintained fixation through the trial. Four identical square-wave gratings presented in a circular aperture (2° diameter, 2 cycles/degree) appeared, positioned so that they fell outside each neuron's classical RF. One or two stimuli were then briefly elevated in luminance, identifying them as targets. All stimuli then moved along independent trajectories at ∼10°/s for 950 ms, placing them at a new set of equally eccentric locations, with one stimulus in the receptive field of the neurons under study, and the others outside the receptive field. Attention was either directed into or away from the receptive field, depending on whether or not the stimulus in the receptive field was cued at the beginning of the trial. Following the pause period, stimuli moved to another set of locations, the fixation point disappeared, and the monkey made a saccade to each target. Reward was delivered if the monkey made a saccade to all cued targets, without first making a saccade to a nontarget.
During the movement and pause phases of the trial, stimuli were flashed for 50 ms with a 150 ms blank between flashes. Eight flashes occurred during the pause period. Each time the stimuli flashed, they were presented at a different contrast value (99%, 57%, 33%, 19%, 11%, 6.5%, 3.5%, and 0%).
Analyses were performed only on correctly completed trials to ensure that the monkey was attending to the cued items. Incorrect trials were repeated later in the experimental session. Both monkeys performed this task above 70% correct, well above chance levels of 25% for experiments with one-target tracking and 16.5% for two-target tracking experiments in which monkeys had to identify both targets. All cells in the first monkey and approximately half (38 of 86) of cells in the second monkey were recorded in the one-target tracking paradigm.
Data analysis.
Analysis was done using the MATLAB software package (Mathworks). Over the course of 124 sessions, 164 single units and 309 LFPs were recorded in two monkeys. Single units and LFPs were included for analysis if a stimulus of any contrast elicited a response robust enough to allow accurate latency estimation (see below for latency calculation methods). Analyses that required direct comparisons between contrasts were restricted to the subset of cells that met this inclusion criterion for both of the contrasts compared.
Response latency for spiking activity was calculated by a metric used by Lee et al. (2007), as the time the spike density function reached 50% of the maximum firing rate in the transient response following stimulus onset. To calculate the latency, the response histogram was first smoothed with an 8 ms σ Gaussian kernel. The response maximum was defined to be the first local maxima occurring at least 45 ms after stimulus onset, if it exceeded 3.72 times the standard error of the baseline response and exceeded 3 times the maximum baseline response. In cases where the first local maximum failed to meet these criteria, the global maximum of the smoothed response histogram was used. The response latency was defined as the time the smoothed response histogram reached half the difference between the maximum amplitude and baseline amplitude, where baseline amplitude is defined as the mean response to a zero contrast stimulus. To determine the reliability of the latency measurement, bootstrap confidence intervals were calculated (1000 resamplings). A latency was only included in the analysis if the 95% bootstrap confidence intervals were <30 ms. Latency estimates became increasingly unreliable at low contrasts. Of the original eight contrasts tested, we only included contrasts for which latencies could reliably be estimated for at least 30 individual neurons in both attention conditions, as indicated by the bootstrap test. This resulted in exclusion of the four contrasts <19% from further consideration. Response amplitude was defined as the maximum firing rate of the response histogram.
Two response latencies for LFPs were calculated, the first as the time the stimulus-evoked LFP reached the peak of its first negative deflection (restricted to a window 50–100 ms poststimulus onset) and the second as the time the stimulus-evoked LFP reached the peak of its first positive deflection (restricted to a window 75–125 ms poststimulus onset). To determine the reliability of the latency calculation, bootstrap confidence intervals were calculated (1000 resamplings). A latency was only included in the analysis if the 95% bootstrap confidence intervals were <10 ms. Response amplitude was defined as the amplitude of the deflection of the stimulus-evoked LFP.
Attention-dependent shifts in latency were defined as Delta latency = attended latency − unattended latency. Contrast-dependent shifts in latency were defined as Delta latency = higher contrast unattended latency − lower contrast unattended latency. Attention-dependent changes in response magnitude were defined as Difference index = (attended − unattended)/(attended + unattended). Contrast-dependent changes in response magnitude were defined as Difference index = (higher contrast − lower contrast)/(higher contrast + lower contrast). Indexes were used to calculate changes in response magnitude due to differences in absolute response magnitudes. This index varies over a range from −1.0 to +1.0, with 0 indicating no effect of attention or contrast.
Statistical significance of population latency and magnitude shifts were tested with nonparametric tests to avoid making potentially unwarranted assumptions about underlying distributions, using Matlab (Wilcoxon signed rank test, signrank function, Mathworks). Correlation coefficients were calculated using Matlab (corrcoef function, Mathworks).
Rate-matching procedure.
For each neuron, we measured the baseline firing rate with no stimulus within the receptive field in each attention condition and the stimulus-evoked response over a time period chosen to cover the onset of the stimulus-evoked response for all neurons in the population—a window that ranged from 40 ms (25 ms before the shortest latency observed for any cell) to 162 ms (25 ms longer than the longest observed latency). We then equated baseline firing rates across attention conditions by randomly deleting spikes from whichever attention condition had the higher baseline firing rate and equated stimulus-evoked responses across attention conditions by, again, deleting spikes at random from whichever attention condition had the higher stimulus-evoked response. This was repeated at each level of luminance contrast.
Results
Figure 1 illustrates recordings of the spiking responses of well isolated neurons and the mean response of the neuronal population after normalizing each individual neuron's response to the peak response evoked in any condition. Each row corresponds to the luminance contrast of the stimulus that fell within the receptive field, with contrast decreasing from top to bottom. Each of the three main columns is split into panels; the left shows the response over the initial 150 ms following stimulus onset, and the right zooms in on the initial phase of the response to aid in seeing the change in latency. Attended responses are shown in red, unattended in blue.

Examples of single site spiking responses (one from each monkey) and the amplitude-normalized population average for the top four contrasts (right two columns). Each spike density function is shown at two time scales (broad and zoomed in) arranged in parallel columns. Stimulus onset occurred at time 0. The blue line is the unattended condition; the red line is the attended condition. Vertical dashed lines in the zoomed panels for the examples indicate response latency. Amplitude is in spikes/s for the individual examples and normalized units for the population mean. At each level of contrast, attention caused a reduction in spiking response latency with attention in the single-unit examples and the population average response.
When attention was directed toward the stimulus in the receptive field, the firing rate was modulated. In example unit 1, the effect of attention on firing rate was modest. Example neuron 2 exhibited a more robust attention-dependent increase in firing rate. We calculated response latencies using a metric adopted from an earlier study examining the effect of attention on the latencies of V4 neuronal responses (Lee et al., 2007). This metric estimates latency as the time at which the neuron's firing rate reached the midpoint between its baseline firing rate and its peak response. It has the advantage of being relatively invariant to changes in the magnitude or statistical reliability of neuronal responses (Levick, 1973; Gawne et al., 1996; Lee et al., 2007). The calculated response latencies are indicated by dashed vertical lines superimposed on the single-unit examples. Both example neurons showed reductions in latency with attention at most of the contrasts shown. The population average responses, on the right, show the trend across the population. Attention increased the magnitude of the response at the lower levels of luminance contrast. There also appeared, by eye, to be a modest reduction in latency with attention.
To quantify the effects of contrast and attention on latency and response magnitude across the population of neurons, we applied the same latency measure to every neuron in the population. The results are shown in Figures 2 (contrast) and 3 (attention). We first show the effect of changes in contrast on response latency and response amplitude to validate our metrics and to allow comparison to previous studies of contrast. For each neuron, we calculate the contrast-dependent change in latency (delta latency) and a contrast-dependent amplitude difference index (see Materials and Methods), comparing across contrasts, with attention directed away from the receptive field. These values are plotted in the scatter plots in the first column of Figure 2, with each point corresponding to one neuron (latency difference on the abscissa, amplitude index on the ordinate). We limited our analysis to neurons whose latencies could be accurately estimated. As described further in Materials and Methods, this was assessed using a bootstrap procedure to determine the confidence interval of each latency estimate. Neurons were included only if the 95% bootstrap confidence interval was <30 ms at each of the two contrasts being compared. This resulted in smaller populations of neurons being included at lower contrasts. The top panel illustrates the effect of increasing the contrast from 57% to 99%. Most points cluster in the upper left quadrant, indicating that an elevation in contrast results in a reduction in latency (negative delta latencies) and an increase in response amplitude (positive amplitude difference indices). These results are also shown in the histograms in the middle column for latency (mean delta latency: −4.34 ms, p < 0.0001) and in the right column for amplitude (mean amplitude difference index: 0.042, p = 0.002). Significant reductions in latency and elevations in response amplitude are seen for the other two contrast increments: 33% to 57% contrast in the middle row and 19% to 33% contrast in the bottom row.

Contrast elevation reduces response latency and increases response magnitude of the spiking response, with attention held fixed. All data were recorded with attention directed away from the receptive field. Rows show changes in latency and response magnitude for contrast elevation from 57% to 99% (top), 33% to 57% (middle), and 19% to 33% (bottom). Left, Change in response latency versus change in the difference index for change in stimulus contrast. Middle and right, Histograms for the latency and amplitude data, respectively. There was a consistent reduction in latency and elevation in response strength with increasing contrast.

Directing attention into the receptive field reduces response latency and tends to increase response magnitude of the spiking response at fixed contrasts. Left, Change in latency (horizontal axis) versus change in amplitude (vertical axis) for attended versus unattended conditions. Change in amplitude is calculated as a normalized difference index (see Materials and Methods). Different stimulus contrasts are plotted on different rows, with the highest at the top. Middle, Histograms of the change in latency with attention at each contrast. Population statistics are in the inset: significance tested with a nonparametric Wilcoxon signed-rank test. Right, Histograms of the change in response amplitude with changes in attention for different contrasts. At all four contrasts, attention caused a significant reduction in latency. Attention also increased firing rate at low to intermediate contrasts, but not at high contrasts.
Having demonstrated the expected effect of contrast elevations on latency and response amplitude, we conducted a similar analysis to test for attention-dependent changes in latency and amplitude with attention (Fig. 3). For each neuron, we computed the identical latency difference and amplitude difference index, but across attention conditions, at each contrast (see Materials and Methods, above). As was done in comparing contrasts, we limited our analysis to neurons whose latencies could be accurately estimated. Neurons were included at each contrast only if their latencies could be estimated reliably in both attention conditions, according to the bootstrap test described above (see Materials and Methods). These values are plotted in the scatter plots in the first column of Figure 3, with each point corresponding to one neuron (latency difference on the abscissa, amplitude index on the ordinate). The top panel illustrates the effect of directing attention to a 99% contrast stimulus. There is no significant correlation between the two measures. Points tend to fall to the left of the origin (negative attention-dependent delta latency), corresponding to attention-dependent reductions in latency, with no clear effect of attention on response amplitude. The distribution of effects of attention on latency can be seen clearly in the histograms in the middle column (mean delta latency: −1.26 ms, significantly less than zero, p = 0.03) and the lack of an effect on amplitude is shown in the right column (mean amplitude difference index: 0.018, p = 0.28). The population showed a significant reduction in latency with attention at all four luminance contrasts, with a range of −0.94 to −1.97 ms. Significant attention-dependent elevations in peak response amplitude were found for the two lower contrast values (19% and 33% contrast) but were not significant for the two higher contrast values (57% and 99% contrast).
To test whether these results depended critically on the selection criterion, which excluded cells whose latency could not be reliably estimated, we repeated the above analyses using more liberal criterion for inclusion. When the inclusion criterion was relaxed to include neurons if the 95% bootstrap confidence interval was <50 ms, the results did not change: significant latencies were still observed (p < 0.05). The motivation for excluding neurons whose latencies could not be reliably estimated was that that inclusion of unreliable neurons could potentially mask a true attention-dependent reduction in latency. Consistent with this, when we included unreliable cells, we no longer observed a significant reduction in latency. An earlier study that examined whether attention reduces response latency (Lee et al., 2007) restricted their analysis to neurons that exhibited at least a 10% increase in firing rate with attention. Imposing this criterion did not alter our finding: we still found significant attention-dependent reductions in latency (p < 0.05).
One important question is whether the reduction in latency in the population average could be a measurement artifact, resulting from the elevation in firing rate. This was unlikely, as attention-dependent reductions in latency were observed for neurons showing both increases and decreases in mean peak rate with attention. There was no correlation between the attention-dependent modulation of firing rate and latency, as would be expected if our estimates of latency were biased by attention-dependent differences in peak response rate (Fig. 3, leftmost panels). Further, significant attention-dependent reductions in response latency were found at 99% and 57% contrast values even though significant elevations in peak response amplitude were not observed at these contrasts (Fig. 3, top two panels, right column). Prior studies have found latency estimates made using the metric used are insensitive to changes in response amplitude (Levick, 1973; Gawne et al., 1996; Lee et al., 2007). However, to test this directly, we repeated the latency analysis after matching firing rates across the two attention conditions for each neuron. This was accomplished by randomly removing spikes from the higher firing rate condition until firing rates were equal across attention conditions (for details of the rate matching procedure, see Materials and Methods). If the latency reduction we see with attention were a measurement artifact stemming from attention-dependent changes in firing rate (either in the baseline response or the stimulus-evoked response), then it would be expected to disappear after equating rates. As shown in Table 1, after equating for attention-dependent differences in firing rate, latencies were still significantly reduced when attention was directed into the neuronal receptive field at all contrasts tested. Therefore, the attention-dependent reductions in latency we report are not an artifact of changes in firing rate.
Latency of the spiking response is reduced at each level of luminance contrast before and after equating spike rates across attention conditions
These findings show that both attention and contrast elevation reduce the response latencies of V4 neurons, which could be taken as suggesting that attention and contrast elevation both influence a common set of mechanisms. To examine this further, we examined a measure that is complementary to spiking activity: the LFP. The LFP is thought to reflect subthreshold changes in potential driven by synaptic activity within a local population of neurons (Mitzdorf, 1985; Kamondi et al., 1998; Logothetis, 2002, 2003; Buzsaki, 2006; Monosov et al., 2008). It is thus thought to give access to subthreshold signals before the emission of an action potential (Monosov et al., 2008). In the LFP, we find some parallels, as well as qualitative differences between the effects of attention and contrast elevation. Figure 4 is arranged the same as Figure 1, but shows the LFP responses for two recording sites (left and middle columns) and across the population (right column) rather than spiking responses. Unlike spiking activity, which is composed of discrete spiking events, the local field potential is an inherently analog signal. The stimulus-evoked LFP is a complex waveform with multiple peaks and troughs defining its full dynamics. As a convenient way of quantifying the timing of the LFP response, we have, for the purpose of the present study, adopted an operational definition of latency that is borrowed from ERP analysis, in which latencies of ERP components are defined based on the time of the peaks and troughs of the ERP waveform. For each recording, we computed two response latency estimates: time to first negative peak (restricted to a window 50–100 ms poststimulus onset) and time to first positive peak (restricted to a window 75–125 ms poststimulus onset). As with the spiking response, attention caused alterations in both the time course and magnitude of the LFP signal. Attention caused the first negative deflection of the LFP to peak and reverse earlier, leading to a reduction in latency and a reduction in amplitude. For the first positive deflection, attention also caused an earlier peak (reduction in latency) and an elevation in amplitude.
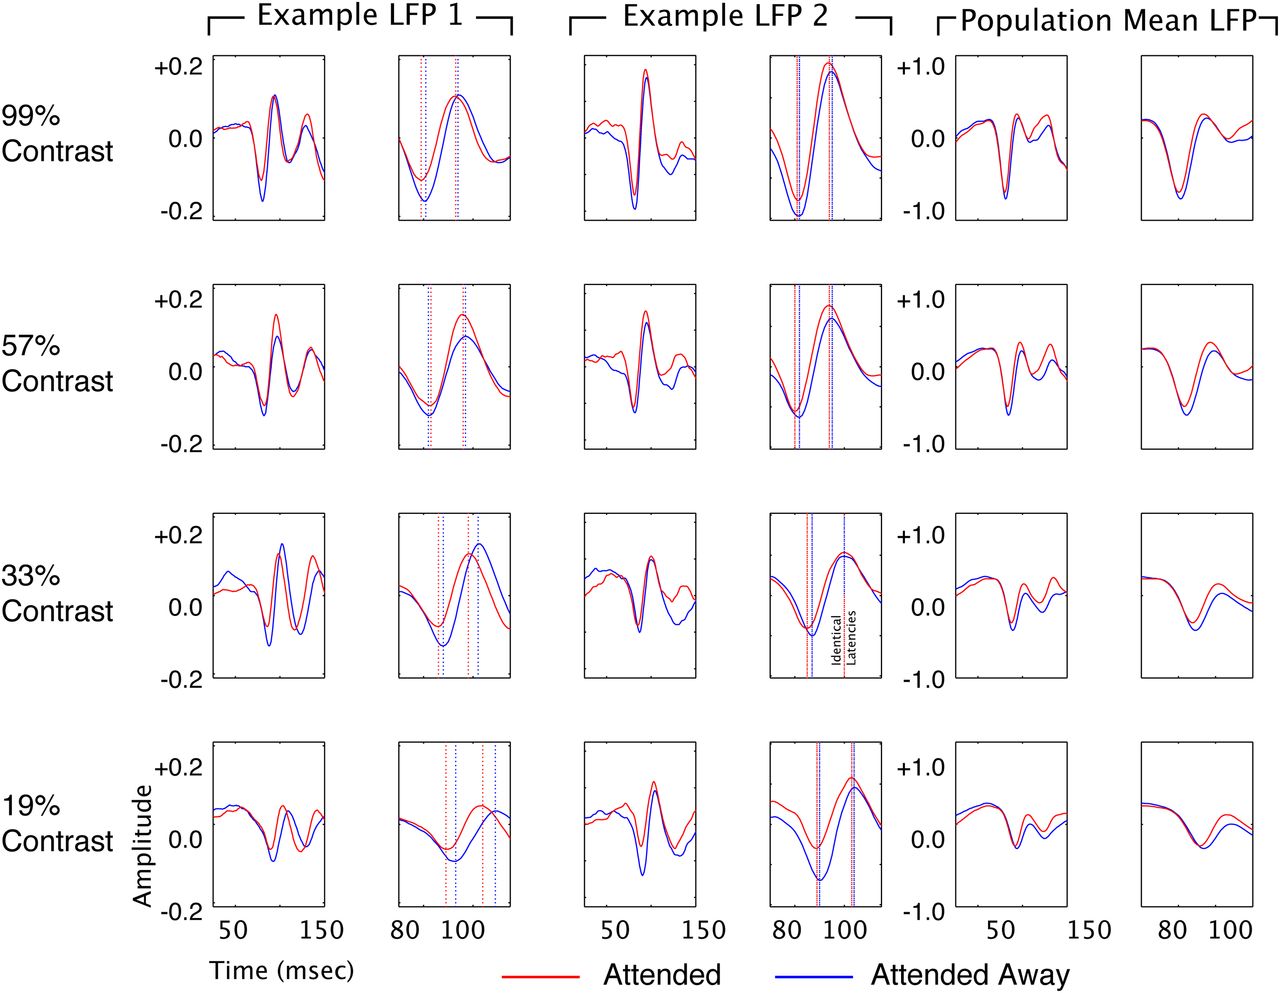
Attention reduces latency to first negative and positive peak of the stimulus-locked LFP. Examples of single-site LFPs (one from each monkey; left two pairs of columns) and the amplitude-normalized population average for the top four contrasts (left pair of columns). Each LFP is shown at two time scales (broad and zoomed in on the negative deflection), arranged in parallel columns. Stimulus onset occurred at time 0. The blue line shows data recorded in the unattended condition, and the red line shows the attended condition. Vertical dashed lines in the zoomed panels for the examples indicate response latency. Amplitude is in volts for the individual examples, and normalized units for the population mean. There is a clear advance in LFP response latency in the attended condition at all four contrasts.
For the population of single units, we found that both elevations of contrast and addition of attention lead to reductions in response latency and increases in response amplitude. Figure 5 is organized to facilitate comparison of the effects of attention and contrast on the latencies of the first negative and positive peaks of the LFP response across LFP recordings. The histograms in the left column of Figure 5 are all significantly shifted to the left of zero, showing that attention reduces the time to the peak of the first negative LFP deflection at each of the four contrasts. Latency changes ranged from −1.03 to −1.68 ms. The three histograms in the second column of Figure 5 show changes in latency to the first negative peak with each contrast increment, with attention directed away from the receptive field. In each case, incrementing contrast significantly reduced latency to peak. Latency reductions ranged from −4.02 to −6.2 ms. Similar results are found for the effect of attention (third column) and contrast elevation (fourth column) on the time to peak of the first positive LFP deflection. Attention and contrast both, therefore, lead to significant reductions in the latency to the first positive and negative deflection of the LFP response, consistent with their effects on the latency of the spiking response.

Both attention and contrast elevation reduce latencies to peak of first and second LFP deflection. First column, Distribution of attention-dependent changes in latencies to the first LFP deflection at each of the four contrasts tested. Second column, Changes in latency to peak of first LFP deflection, in attended away condition, with contrast elevation [elevation of contrast from 19% to 33% (bottom), 33% to 57% (middle), and 57% to 99% (top)]. Right two columns, Attention- and contrast-dependent reductions in latency to peak of second LFP deflection.
While attention and contrast elevation had similar effects on the latencies of spiking and LFP responses, they differed markedly in their effects on the magnitude of the LFP response. Figure 6 is organized in the same format as Figure 5 to facilitate this comparison. The top histograms in the left column show the effect of attention on the magnitude of the first negative deflection of the LFP. With the exception of measurements made at 19% contrast, attention significantly reduced the amplitude of the first negative LFP deflection (19% contrast showed a small, nonsignificant reduction in amplitude). The panels in the second column show changes in the amplitude of the first negative peak resulting from contrast increases (with attention directed away from the receptive field). In each case, increases in contrast led to a significant increase in the amplitude of the first negative LFP deflection. This dissociation between contrast and attention in the first deflection of the LFP signal may provide important clues into the mechanisms underlying attention-dependent response modulations. A similar dissociation is not seen for the first positive deflection of the LFP. Both attention (third column) and contrast (fourth column) show significant increases in the amplitude of the first positive deflection of the LFP for most contrast values tested.

Attention and contrast elevation differ in their effects on the magnitude of LFP deflections. First column, Distribution of attention-dependent changes in magnitude of the first LFP deflection at each of the four contrasts tested. Except at the lowest contrast, attention caused a significant reduction in LFP magnitude. The second column shows the opposite effect: increases in the magnitude of the first LFP deflection, with elevation of contrast (attention directed away from the receptive field). Elevations of contrast are from 19% to 33% (bottom), 33% to 57% (middle), and 57% to 99% (top). Right two columns, Attention- and contrast-dependent increases in magnitude of the second LFP deflection, with both attention (column 3) and contrast elevation (column 4).
Discussion
Summary
This study provides the first demonstration that attention reduces the response latencies of visual cortical neurons. As in prior studies (Celebrini et al., 1993; Carandini and Heeger, 1994; Albrecht, 1995; Gawne et al., 1996; Reynolds et al., 2000; Reich et al., 2001; Lee et al., 2007), we found a significant reduction of response latency with elevations of luminance contrast. These attention-dependent and contrast-dependent reductions in latency were observed in both the spiking response and in the stimulus-locked LFP response. Although attention and contrast elevation both caused significant reductions in latency, they differed in their effects on the magnitude of the LFP: increasing stimulus contrast increased the magnitude of the first LFP deflection, whereas attention toward the stimulus decreased the first LFP deflection.
Magnitude of the latency reduction
The population-mean shifts in latency with attention that we observed are modest, but could still be functionally significant. Millisecond-range differences in relative spike timing between neurons could be an important part of the neuronal code (Victor, 1999; Oram et al., 2002; Guyonneau et al., 2004; VanRullen et al., 2005; Tiesinga et al., 2008; Di Lorenzo et al., 2009). Data from hippocampal cortex, where it is possible to directly control the inputs to a neuron, show that small changes in input timing and relative firing time can have powerful effects on hippocampal computation (Jarsky et al., 2005; Dekay et al., 2006; Klyachko and Stevens, 2006; Kandaswamy et al., 2010). Given the parallels between neocortical and hippocampal cortices (Shepherd, 2011), it would be surprising if the hippocampal circuitry was sensitive to small changes in relative spike timing and the neocortical circuitry was not, and there are studies showing similar sensitivity to small timing differences in the cerebral cortex (Gabernet et al., 2005).
Relationship to earlier studies that have not found attention-dependent reductions in the spiking response latency
Several prior studies have failed to find reductions in the latency of the spiking response with attention (Reynolds et al., 2000; Bisley et al., 2004; Cook and Maunsell, 2004; McAdams and Reid, 2005; Lee et al., 2007). The study that most closely parallels the present study examined latency differences in the spiking responses in macaque V4 using the same latency measure and found no significant effects of attention (Lee et al., 2007). Our study differed in some of the selection criteria used to determine which neurons to include for analysis. One difference is that we excluded neurons for which the peak response was less than three times the baseline response. We found that this was necessary, in our dataset, because the latency metric we adopted from Lee et al. (2007) often generated false positive responses for neurons with low peak responses—giving latency estimates that were clearly earlier than the response onset visible by eye. Lee and colleagues (2007) did not report this issue. The earlier study also excluded neurons if they did not show an attention-dependent increase in firing rate greater than 10%. In our main analysis, we included neurons regardless of whether their firing rates were modulated by attention, reasoning that attention-dependent changes in latency might be observed independently of whether attention modulated a given neuron's firing rate. However, we also found significant reductions in latency after applying the 10% threshold used in the earlier study. Our study also differed from the earlier study in the treatment of neurons whose latencies could not reliably be estimated. With the exception of a regression analysis comparing the effects of attention and contrast, the earlier study included neurons for which reliable estimates of latency could not be obtained—neurons for which the 95% confidence intervals on estimated latency exceeded 50 ms. The application of this exclusion criterion in their regression analysis resulted in the exclusion of 50% of the neurons in their sample, which were included in other analyses, including the analysis where they asked whether attention measurably reduced latency. Our motivation for excluding neurons whose latencies could not be reliably estimated was that that inclusion of unreliable neurons could potentially mask a true attention-dependent reduction in latency. Consistent with this, inclusion of neurons whose latencies could not reliably be estimated caused us to fail to detect this difference. Therefore, a plausible explanation for the different conclusions of the two studies is that, in the analysis that directly tested for a reduction in latency with attention, the prior study included neurons whose latencies could not reliably be determined.
Relationship of the present results to earlier studies of attention and variation in contrast
Earlier studies have found parallels between the effects of spatial attention and contrast elevation. Luminance contrast can cause a multiplicative scaling of orientation tuning curves (Dean, 1981; Sclar and Freeman, 1982; Bradley et al., 1987). These findings have motivated modeling studies, including Heeger (1992), who showed that contrast-dependent scaling of tuning curves could be accounted for by a normalization circuit in which elevation of contrast scaled excitation and divisive inhibition. Reynolds et al. (1999) proposed a related model in which attentional feedback scaled excitation and divisive inhibition, leading to the prediction that attention and contrast elevation should have similar effects on firing rates. This is consistent with the findings of McAdams and Maunsell (1999), who found that directing spatial attention toward a stimulus caused a scaling of orientation tuning curves and noted the parallel with contrast elevation. Studies in which attention was directed to a stimulus varying in contrast (Reynolds et al., 2000; Williford and Maunsell, 2006) have led to the development of more refined normalization models of attention (Lee and Maunsell, 2009; Reynolds and Heeger, 2009).
The parallels between attention and contrast elevation extend to studies in which multiple stimuli appear in and around a neuron's receptive field. For example, when two stimuli, one preferred, the other nonpreferred, fall within a neuron's classical receptive field, the nonpreferred stimulus can often reduce the response evoked by the preferred stimulus (Miller et al., 1993; Rolls and Tovee, 1995; Recanzone et al., 1997; Reynolds et al., 1999; Britten and Heuer, 1999; Heuer and Britten, 2002; but see Gawne and Martin, 2002). This observation led to the proposal that attention and contrast both act to modulate the circuitry that mediates competitive interactions among stimuli (Reynolds et al., 1999; Reynolds and Chelazzi, 2004; Lee and Maunsell, 2009; Reynolds and Heeger, 2009). Consistent with this proposal, elevating the contrast of the nonpreferred stimulus in the classical receptive field or directing attention to it can increase its capacity to suppress the response evoked by preferred stimulus appearing in the classical receptive field (Reynolds and Desimone, 2003). A similar parallel is observed for surround suppression in V4. Presenting a stimulus in the suppressive surround of a V4 neuron will reduce the response evoked by a stimulus appearing within the center of the classical receptive field. Elevating the luminance contrast of the center stimulus diminishes the magnitude of suppression, as does directing attention toward the center stimulus. Elevating the contrast of the surround stimulus or directing attention to it magnifies surround suppression (Sundberg et al., 2009).
Despite these striking parallels, contrast elevation and attention are distinct in their effects on neuronal processing, and it would be an oversimplification to equate the two. One obvious difference is that contrast elevation activates contrast gain control mechanisms at multiple stages of processing, including the retina (Shapley and Victor, 1978), which is not thought to be subject to attentional feedback. There are also, within V4, key differences in the effects of attention and contrast elevation. Hudson et al. (2009) showed that they differ in their effects on adaptation, with attention counteracting reductions in gain that are produced by the adaptation that occurs following increases in contrast. Differences have also been reported in primary visual cortex. One study in macaque primary visual cortex found additive effects of contrast and attention (Thiele et al., 2009). Recent evidence implicating the cholinergic system in attentional modulation and gain control in macaque V1 point to nicotinic and muscarinic mechanisms that are expressed in distinct components of the cortical circuit (Disney et al., 2007; Herrero et al., 2008). Together, these studies highlight the complexity of the underlying circuitry and suggest that while attention and contrast elevation may both influence a common set of mechanisms, the pathways by which they converge on these mechanisms and the neurons that make up these pathways are likely to be somewhat distinct. Consistent with this emerging picture, the present experiments find both parallels and differences between the effects of attention and contrast elevation. Both were found to cause reductions in response latencies in spiking and LFP responses. Both caused increases in spike rate during the initial period of the response at lower contrasts. However, the two had opposite effects on the magnitude of the initial LFP deflection following stimulus onset, indicating differences in underlying mechanisms.
Here we consider how these findings may relate to one another. In the task, attention was either directed toward or away from the receptive field, after which stimuli flashed within the neuronal receptive field. Attentional state was therefore set before the appearance of each flashed stimulus. One possible explanation for the observation that attention reduced response latency is that it may have depolarized the neuron, placing it closer to spiking threshold. This would be expected to reduce the time required for the neuron to reach spiking threshold upon arrival of stimulus-evoked afferent input. Consistent with this proposal, intracellular recordings in the primary visual cortex of anesthetized cats have found reductions in the latency of spiking responses and increases in response strength when cortical neurons are in a depolarized state (Sanchez-Vives et al., 2000; Haider et al., 2007).
The contrast of each stimulus was randomized, so the particular contrast of a given stimulus could, in principle, only have its influence on latency after the stimulus appeared. Part of the observed contrast-dependent latency reduction is likely inherited from earlier stages of processing, beginning in the retina. However, there is evidence that response latencies become increasingly contrast-dependent going from early to later stages of visual processing (Perrett et al., 1992), suggesting that each stage contributes to latency increments as contrast is reduced, possibly resulting from a slower drift toward response threshold at lower contrasts. Higher contrast stimuli tend to produce responses with more abrupt onset transients and higher peak firing rates (Gawne, 2008), which would naturally be expected to cause a more rapid depolarization and spike firing.
This hypothesis, in which elevation of contrast results in more rapid depolarization due in part to more abrupt afferent input while attention sets the neuron in a more depolarized state before the arrival of afferent input, could also help to account for the counterintuitive finding that the initial LFP deflection was reduced in magnitude with attention. The LFP is thought to result from each neuron's integration of local synaptic activity (Monosov et al., 2008), which gives rise to return currents that are combined across multiple neurons to yield changes in the extracellular potential recorded across the electrode tip. These return currents are what give rise to the current sources and sinks that are the basis, in current-source-density analysis, for estimating the position of spiking neurons within a laminar circuit (Mehta et al., 2000; Ahrens et al., 2002; Swadlow et al., 2002). An appearance of positive charge (a source) designates current that is flowing out of neurons into the extracellular space, corresponding to a net hyperpolarization of membrane potentials. Disappearance of positive charge (a sink) designates current that is flowing into neurons, corresponding to net depolarization of membrane potentials (Nicholson and Freeman, 1975). The relationship between the local field potential and intracellular potentials can be seen in studies that have simultaneously recorded field potentials and intracellular potentials and found that the magnitude of intracellular potential fluctuations are mirrored by deflections of the field potential in the vicinity of the neuron (Frost, 1967; Okun et al., 2010). If directing attention to the location of a neuron's receptive field places the neuron closer to its response threshold, it would be expected to reduce the change in depolarization that the neuron undergoes as it moves toward response threshold. This reduction in the change in depolarization might then be reflected in the reduced magnitude in the LFP we observed with attention.
In conclusion, we have demonstrated that across a population of V4 cortical neurons, there is a significant reduction in response latency with selective attention. The magnitude of this shift is smaller than that observed when we approximately doubled stimulus contrast, but is still large enough to be of potential functional significance. Latency shifts with attention were also seen in the LFP, but the effect of attention differed in its effects on the magnitude of the LFP response. These findings thus help us to dissociate the effects of attention and contrast elevation, and help motivate a simple model in which attention-dependent depolarization primes the target neuron to quickly detect a stimulus by placing it near its response threshold.
Footnotes
This work was supported in part by a grant from the National Eye Institute (EY13802 to J.F.M. and J.H.R.), a National Institutes of Health Training Fellowship (J.F.M.), a grant from the National Science Foundation (IOS 0622318 to T.J.G.), and by a grant from The Gatsby Charitable Foundation (J.H.R.). We thank C. Williams and J. Reyes for help with animals and technical support.
The authors declare no financial conflicts of interest.
- Correspondence should be addressed to John H. Reynolds, Systems Neurobiology Laboratory, The Salk Institute for Biological Studies, La Jolla, CA 92037. Reynolds{at}salk.edu


