

Abstract
Attention-deficit/hyperactivity disorder (ADHD) is characterized by symptoms of inattention and hyperactivity/impulsivity that often persist in adulthood. There is a growing consensus that ADHD is associated with abnormal function of diffuse brain networks, but such alterations remain poorly characterized. Using resting-state functional magnetic resonance imaging, we characterized multivariate (complex network measures), bivariate (network-based statistic), and univariate (regional homogeneity) properties of brain networks in a non-clinical, drug-naive sample of high-functioning young men and women with ADHD (nine males, seven females) and a group of matched healthy controls. Data from our sample allowed the isolation of intrinsic functional connectivity alterations specific to ADHD diagnosis and symptoms that are not related to developmental delays, general cognitive dysfunction, or history of medication use. Multivariate results suggested that frontal, temporal, and occipital cortices were abnormally connected locally as well as with the rest of the brain in individuals with ADHD. Results from the network-based statistic support and extend multivariate results by isolating two brain networks comprising regions between which inter-regional connectivity was significantly altered in the ADHD group; namely, a frontal amygdala-occipital network and a frontal temporal-occipital network. Brain behavior correlations further highlighted the key role of altered orbitofrontal-temporal and frontal-amygdala connectivity for symptoms of inattention and hyperactivity/impulsivity. All univariate properties were similar between groups. Taken together, results from this study show that the diagnosis and the two main symptom dimensions of ADHD are related to altered intrinsic connectivity in orbitofrontal-temporal-occipital and fronto-amygdala-occipital networks. Accordingly, our findings highlight the importance of extending the conceptualization of ADHD beyond segregated fronto-striatal alterations.
Introduction
Attention-deficit/hyperactivity disorder (ADHD) is characterized by symptoms of inattention and hyperactivity/impulsivity that tend to become chronic and can lead to significant personal and societal costs (Hinnenthal et al., 2005; De Ridder and De Graeve, 2006; Frazier et al., 2007). However, core neurobiological alterations related to the diagnosis of the disorder and to symptoms of inattention and hyperactivity/impulsivity are hitherto to be defined.
While changes in fronto-striatal networks supporting executive and reward functions in ADHD have often been reported, recent neuroimaging findings point to broader functional alterations in the disorder (Makris et al., 2009; Liston et al., 2011; Castellanos and Proal, 2012; Tomasi and Volkow, 2012). Specifically, functional magnetic resonance imaging (fMRI) investigations have suggested that altered executive and reward processes in ADHD are related to deregulations in brain networks encompassing frontal, parietal, and occipital cortices as well as the striatum in ADHD (Bush et al., 2005; Wolf et al., 2009; Vloet et al., 2010; Castellanos and Proal, 2012; Volkow et al., 2012).
The aforementioned findings have recently been complemented by studies of functional brain networks in ADHD at rest. In addition to decreased inter- and intra-regional functional connectivity in fronto-striatal networks (Cao et al., 2006; Casey et al., 2007b; Rubia et al., 2011), results also suggest more widespread alterations in connectivity within and between frontal, parietal, temporal, and occipital cortices (Castellanos et al., 2008; Wang et al., 2009b; Fair et al., 2010; Qiu et al., 2011).
The hypothesis of systemic functional alterations in ADHD is supported by findings from structural neuroimaging studies (Hill et al., 2003; Makris et al., 2007; Konrad and Eickhoff, 2010), as well as neuropsychological and phenomenological observations (Swanson et al., 1998; Nigg and Casey, 2005; Luman et al., 2010). However, direct evidence characterizing such hypothetical alterations is required. Previous studies have been mainly conducted on developing brains, with functional network alterations in the brains of adults with ADHD remaining poorly characterized. Findings have also typically been derived from clinical samples that often include medicated individuals with high comorbidity. Methodologically, resting state studies in ADHD have generally investigated functional connectivity changes between a few brain regions selected a priori rather than a more comprehensive characterization of systemic alterations. Finally, it is unclear whether suggested functional connectivity alterations in ADHD involve abnormal coupling between brain regions, local decoherence within regions, or both.
The current study attempts to overcome the above shortcomings by characterizing functional network alterations in ADHD at a multivariate (complex network characteristics; Rubinov and Sporns, 2010), bivariate (connectivity between pairs of regions; Zalesky et al., 2010b), and univariate (intra-regional connectivity; Zang et al., 2004) level. Using this multilevel approach, we do the following: (1) describe functional connectivity alterations in a sample of non-clinical, drug-naive young adults with ADHD; (2) establish whether these hypothesized alterations in the ADHD group are related to abnormal functional connectivity between regions or local decoherence within regions or both; and (3) investigate the categorical [Diagnostic and Statistical Manual of Mental Disorders, fourth edition (DSM-IV) diagnosis; American Psychiatric Association, 2000] and dimensional (symptoms of inattention and symptoms of hyperactivity/impulsivity) relevance of detected alterations in functional connectivity.
Materials and Methods
Participants
Three-hundred and ninety-seven students attending the ninth semester at the medical school of the Federal University of Rio de Janeiro (Brazil) from the years 2008 to 2011 completed a self-report ADHD symptom checklist, the Portuguese version of the Adult Self Report Scale (ASRS) (Mattos et al., 2006). All positively screened individuals were invited to a semi-structured interview that further inquired about and confirmed ADHD symptoms [using the Portuguese version of the Kiddie Schedule for Affective Disorders and Schizophrenia, K-SADS scale for ADHD, adapted for adults; Grevet et al., 2005]. These interviews were conducted by two trained psychiatrists supervised by a senior psychiatrist (P.M.) and included additional investigation of comorbid disorders through a semi-structured interview (Sheehan et al., 1998; Amorim, 2000; Mini International Neuropsychiatric Interview, MINI-PLUS) and examination of other exclusionary criteria (see below, following paragraphs).
Sixteen individuals (nine men and seven women) meeting the DSM-IV (American Psychiatric Association, 2000) symptom criteria of ADHD (at least six of nine current symptoms of inattention and/or hyperactivity/impulsivity and elevated past symptoms, see Table 1) were included in the ADHD group. Importantly, all individuals were medication naive for psycho-stimulants. Individuals were excluded if they presented with any of the following: current illicit drug use, current major depression or anxiety disorders (MINI-PLUS corresponding modules), history of neurological disorders, left hand dominance (Oldfield, 1971), or any contraindications for MRI.
Sample characteristics
A control group of 18 individuals was recruited from the same sample of 397 students who completed the initial ASRS screening. Individuals who fulfilled the aforementioned exclusion criteria and reported no more than three current symptoms of inattention or hyperactivity/impulsivity were selected to closely match the ADHD group for age, gender, handedness (Oldfield, 1971), years of formal education, IQ (Wechsler Abbreviated Scale of Intelligence; Yates et al., 2006), and socio-economic status (Table 1). Data quality assurance tests were performed in both groups (Huettel et al., 2009). Three individuals in the control group were excluded from the analysis due to excessive head motion (>2.0 mm and 2.0°) during the functional acquisition or problems with data normalization.
All individuals provided informed written consent to participate in the study. The study was approved by the ethics committees of the Institute of Psychiatry of the Federal University of Rio de Janeiro (Brazil) and of the D'Or Institute for Research and Education (IDOR, Brazil).
Magnetic resonance imaging
Acquisitions were conducted on an Philips Achieva 3T magnetic resonance scanner at the IDOR research center. Functional sequences consisted of single-shot, fast-field echo, echo-planar imaging (EPI) (8 min of resting state, 240 volumes) with time to repetition (TR) of 2000 ms, time to echo (TE) of 22 ms, flip angle of 90° within a field of view of 240 × 240 mm2 having an in-plane resolution of 3 × 3 mm2, and a slice thickness of 3 mm (no gap). Thirty-six bottom-up axial slices were acquired to cover the whole brain except the caudal part of the cerebellum. The first four volumes were discarded to allow the magnetization to reach steady state.
Data analysis
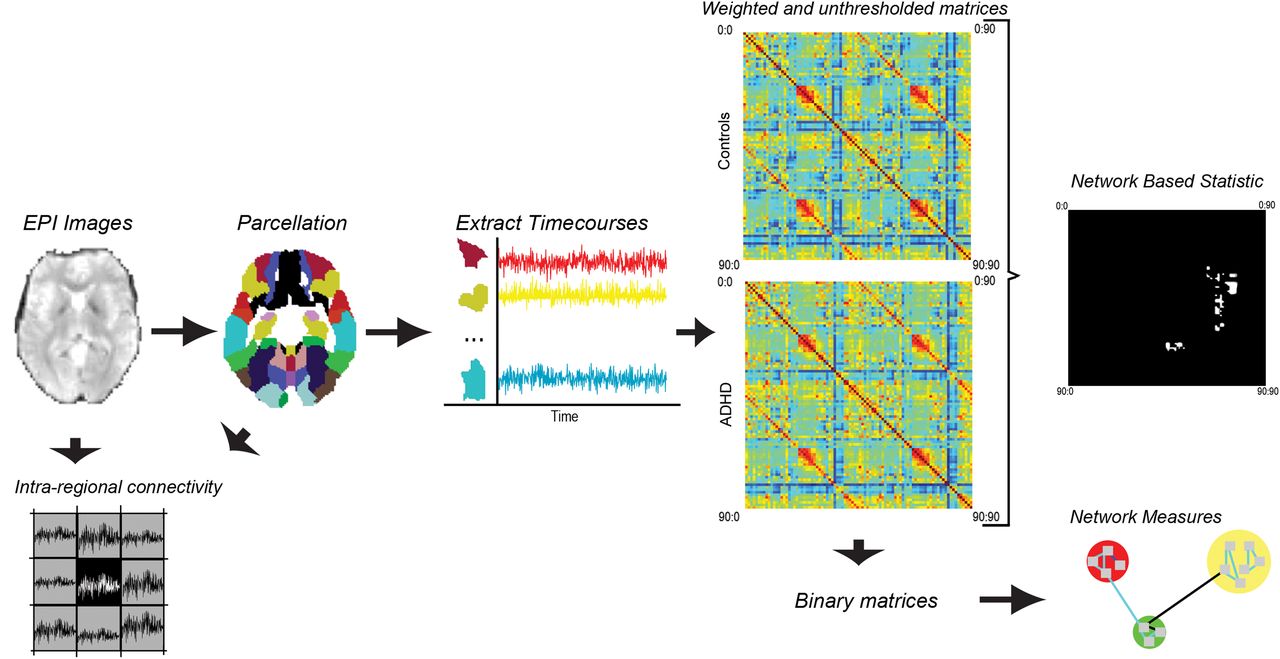
A flowchart presenting an overview of data processing and analysis pipeline is depicted in Figure 1.

Flowchart of methods pipeline: overview of data processing and analysis pipeline. Resting-state fMRI data were acquired in 16 individuals meeting DSM-IV criteria for ADHD and a group of 15 matched healthy controls. Data were corrected for a temporal shift in acquisition (slice timing), realigned to the middle slice, normalized to an EPI template, smoothed using a full width at half maximum kernel of 6 mm, detrended, and bandpass filtered (0.01–0.08 Hz). The six head-motion parameters (matched between the two groups), as well as the white matter and cerebrospinal fluid signals, were regressed out from each voxel's time course. Time courses were extracted for the 90 cerebral regions comprising the AAL template and the extent of dependency between every pair of regions was represented at the subject level with a 90 × 90 connectivity matrix. The resulting connectivity matrices were then investigated for between-group differences in connectivity using the network-based statistic as well as differences in key network measures. Intra-regional connectivity was also assessed from the EPI images (voxel wise) and the AAL regions of interest.
Preprocessing.
Image preprocessing was performed with the Matlab (MathWorks, http://www.mathworks.com.au/index.html) toolbox Data Processing Assistant for Resting-State fMRI (version 2.0, Chao-Gan and Yu-Feng, 2010). DICOM (Digital Imaging and Communications in Medicine) data were first converted to NIfTI (Neuroimaging Informatics Technology Initiative) format, corrected for any temporal shift in acquisition (slice timing), realigned to the middle slice, normalized to the MNI template, smoothed using a full-width at half-maximum (FWHM) kernel of 6 mm, detrended, and bandpass filtered (0.01–0.08 Hz). The nuisance signals of the six head motion parameters as well as the white matter and cerebrospinal fluid signals were regressed out from each voxel's time course. In addition to the six standard head motion parameters, we also controlled for several additional parameters describing complex head motion characteristics [i.e., number of significant movements (>0.10 mm relative displacement between adjacent volumes), mean head displacement, maximum head displacement, and mean head rotation; Van Dijk et al., 2012]. All head motion parameters, including the six standard parameters, were similar between groups (t statistics, p > 0.05). Finally, a time course was computed for each of the 90 cortical and subcortical regions comprising the automated anatomical labeling (AAL) template (Tzourio-Mazoyer et al., 2002) by averaging over the relevant set of voxels. Unsmoothed data were used for investigating intra-regional connectivity.
Functional connectivity measurements.
A 90 by 90 connectivity matrix was computed for each participant. The connectivity matrix quantified the extent of inter-regional functional connectivity between every pair of regions. For the multivariate analysis, the connectivity between a pair of regions was computed using Pearson's correlation coefficient. The connectivity matrices predominantly comprised positive correlations (>95%) that alleviated the difficulty of interpreting negative weights in the context of network measures (Rubinov and Sporns, 2011). The partial correlation coefficient was used for the bivariate analysis to minimize the contribution of indirect paths (Salvador et al., 2005; Bassett et al., 2008; Marrelec et al., 2009).
Multivariate connectivity analysis: complex network measures.
Single-subject connectivity matrices were binarized to yield networks with a common connection density. A range of connection densities was considered from 5% to 30% in increments of 5%. For a connection density of X%, the largest X% of values in each connectivity matrix was set to unity (indicating a connection), while all other elements in the connectivity matrix were set to zero (indicating no connection). The topological organization of the resulting binary networks was characterized using both global and local network measures (Rubinov and Sporns, 2010; Sporns, 2011).
The global measures investigated were the characteristic path length and the average clustering coefficient. These measures quantified the overall extent to which the networks were integrated and segregated, respectively. To serve as a benchmark, these two global measures were also quantified in random networks with the same number of nodes, same connection density, and same nodal degree distribution. Ensembles of 20 random networks were generated for each connection density using a well known network randomization algorithm (Maslov and Sneppen, 2002). The ratio was then computed between the original network measure and the average of the network measure across the ensemble of 20 random networks. This ratio quantified how much more or less integrated and segregated the networks of each participant were relative to a random network. Finally, the ratio of the normalized average clustering coefficient and the normalized characteristic path length was computed. This is known as the small-world ratio (Humphries and Gurney, 2008).
The local measures assessed were nodal path length and nodal clustering coefficient. These measures were computed for each of the 90 nodes separately and quantified the extent to which each particular region was integrated within the network and segregated among its immediate neighbors, respectively. A more detailed interpretation of these complex networks measures and associated formulae can be found elsewhere (Bassett and Bullmore, 2009; Bullmore and Sporns, 2009; Guye et al., 2010; He and Evans, 2010; Rubinov and Sporns, 2010; Sporns, 2011).
A two-tailed t statistic was used to assess the significance of any between-group differences in each of the network measures investigated. A separate t test was used for each network measure and each connection density. For the local network measures, a two-sample t test was used for each of the 90 regions. To correct for the 90 independent tests, an alpha level of 1/90 (p < 0.01) was used to declare significance for the local measures (Lynall et al., 2010).
Bivariate connectivity analysis: network-based statistic.
The network-based statistic (NBS) was used to identify pairs of regions between which the strength of connectivity was altered in the ADHD group. The NBS has been described in detail previously (Zalesky et al., 2010b,2012a). This approach was applied to the nonbinarized connectivity matrices for each participant. A two-sample t-statistic was calculated for each pair of regions to test the null hypothesis of equality in the mean value of partial correlation between groups. This was repeated independently for each of the (90 × 89)/2 = 4005 pairs of regions. Pairs of regions with a t statistic (absolute value) exceeding an uncorrected threshold of 3.5 (p < 0.01) were systematically searched for any interconnected networks that may be evidence of a between-group difference and which are referred to as connected components in graph theory. A familywise error (FWE)-corrected p value was then ascribed to each network using permutation testing. For each permutation, participants were randomly exchanged between the ADHD and control groups. The NBS was then applied to the randomized data, and the size of the largest network (connected component) was recorded. A total of 10,000 permutations were generated in this manner to yield an empirical null distribution for the size of the largest network. Finally, a corrected p value for a network of size k found in the original data was calculated as the proportion of permutations for which the largest network was greater than or equal to k. Using the size of the largest network in the permuted data ensured weak control of the FWE rate (Nichols and Holmes, 2002; Maris and Oostenveld, 2007).
The NBS can be sensitive to the choice of template used to parcellate the brain into distinct regions (Wang et al., 2009a; Zalesky et al., 2010a; Wig et al., 2011). The reproducibility of our findings was therefore evaluated using a variety of different parcellation templates. In particular, each region comprising the original AAL template was displaced by d millimeters along a randomly generated vector. An independent displacement vector was generated for each region. Any portion of a displaced region lying outside the brain volume was omitted. Displacements of d = 1.5, 3, 4.5, and 6 mm were evaluated, with four independent parcellation templates generated for each displacement magnitude. The extent of overlap between the significant networks identified with the NBS across the original and displaced parcellation templates was then assessed. This quantified the reproducibility and robustness of our findings to registration misalignment and inaccuracy in regional boundaries.
Univariate regional analysis: regional homogeneity.
The regional homogeneity (ReHo) of each voxel was determined using the appropriate function in the Matlab toolbox REST (Song et al., 2011). Regional homogeneity refers to the extent of similarity in the time courses associated with a given voxel and its immediate neighboring voxels. Thus, ReHo provides a measure of intra-regional connectivity (Zang et al., 2004). Two distinct measures were used to quantify the ReHo of a given voxel: (1) the coherence of that voxel's time course with its 26 nearest neighbors; and (2) the Kendall's coefficient of concordance (KCC). The first measure (Cohe-ReHo) is detailed in Liu et al. (2010), and the second (KCC) is described in Song et al. (2011). This resulted in a separate ReHo map for each participant that quantified the extent to which each voxel was synchronized in terms of its BOLD signal with each of its 26 immediate neighbors. The ReHo map for each participant was smoothed with a FWHM kernel of 6 mm using functions implemented in SPM8 (Wellcome Trust Centre for Neuroimaging, London, UK). A two-sample t statistic was then computed for each voxel to test the null hypothesis of equality in the mean value of regional homogeneity between groups. Correction was performed with the false discovery rate (FDR, p < 0.05) at a cluster level, where clusters were isolated with p < 0.001 uncorrected (Chumbley et al., 2010).
Brain–behavior associations.
Pearson's correlation coefficient was used to assess potential relationships between changes in inter- and intra-regional functional connectivity and the number of past and current ADHD symptoms.
Results
Multivariate connectivity analysis: complex network measures
Figure 2 shows plots of the global network measures versus the network connection density. Each plot represents the group average, and separate plots are presented for the ADHD and control groups. In both groups, the characteristic path length was approximately the same as that expected in a random network (the normalized characteristic path length was approximately unity; Fig. 2A), but the average clustering coefficient was substantially greater than expected in a random network (the normalized average clustering coefficient was >1; Fig. 2B). This indicated that the brain was a small-world network in both the ADHD and control groups, as further verified by the small-world ratio exceeding unity (Fig. 2C).

Measures of global topological attributes of brain connectivity. Multivariate measures describing topological attributes of brain connectivity were quantified in a drug-naive, non-clinical sample of young adults with ADHD and matched healthy controls. No significant differences were found between the two groups for the five measures and six densities considered. A, Characteristic path length and normalized characteristic path length. B, Average clustering coefficient and normalized average clustering coefficient. C, Small worldness.
No significant between-group differences were identified for the five global network measures investigated (Fig. 2C).
Across the connection densities considered, between-group differences were identified in the nodal (region-specific) measures, indicating focal topological alterations in the ADHD group. Specifically, compared with controls, the nodal clustering coefficient was significantly greater in the ADHD group in the left orbitofrontal and right superior temporal cortices (p < 0.01). In contrast, controls showed increased nodal clustering in the left superior occipital cortex (p = 0.01). The nodal path length was significantly lower in the ADHD group in the right medial frontal and right superior occipital cortices (p < 0.011) (see Table 2 for details).
Complex networks measures of functional segregation and integration
Bivariate connectivity analysis: network-based statistic
The NBS identified two significant networks (p < 0.05 FWE corrected; see Fig. 3A,B, Table 3, and Table 4 for details). The first network encompassed the left orbitofrontal cortex, left superior frontal cortex, right precentral gyrus, left amygdala, and the right lingual gyrus (Fig. 3A). The ADHD group showed decreased connectivity between the orbitofrontal cortex and the amygdala (depicted in red in Fig. 3A). In contrast, connectivity was higher in the ADHD group between the following: (1) the left orbitofrontal cortex and the right lingual gyrus; (2) the left orbitofrontal and the left superior frontal cortices; and (3) the left amygdala and the right precentral gyrus (depicted in blue in Fig. 3A).

Group differences in inter-regional functional connectivity. Two abnormal networks in ADHD identified with the NBS. In both panels, red lines indicate reduced inter-regional functional connectivity in the ADHD group compared with controls. In contrast, blue lines designate enhanced inter-regional functional connectivity in individuals with ADHD compared with healthy controls. A, Network 1: 1, superior frontal cortex; 2, mid-orbitofrontal cortex; 3, precentral gyrus; 4, amygdala; 5, lingual gyrus. B, Network 2: A, superior occipital cortex; B, fusiform gyrus; C, superior temporal gyrus; D, temporal pole; E, inferior part of the orbitofrontal cortex; F, medial orbitofrontal cortex.
Inter-regional changes in functional connectivity (network-based statistic)
Average values of functional connectivity in the pairwise connections of interest (network-based statistic)
The second network comprised the medial and left orbitofrontal cortices as well as the left temporal and occipital cortices (left cuneus and right fusiform gyrus; Fig. 3B and Table 3). The ADHD group showed decreased connectivity between the orbitofrontal and temporal cortices but increased temporal-occipital connectivity (Fig. 3B).
The two networks identified were exactly reproduced when each AAL region was randomly displaced by a distance of d = 1.5 mm. However, displacements beyond 1.5 mm did not yield any significant findings. While indicating mild dependence of the reported results on the AAL template, results from these control analyses highlight the reproducibility of the identified between-groups differences.
Univariate regional analysis: regional homogeneity
Significant between-group differences were not found in regional homogeneity. This negative result was replicated using an alternative measure of inter-regional connectivity, the Kendall's coefficient of concordance or KCC, (Zang et al., 2007; Liu et al., 2010). Additional analyses assessing functional connectivity changes within each AAL region in the two networks isolated by the NBS also did not yield differences between groups.
Brain–behavior associations
For each pair of regions comprising the two networks identified with the NBS, we assessed whether functional connectivity between the pair of regions was correlated with the number of symptoms in the ADHD group (see Table 1 for symptoms). This analysis showed that the number of current symptoms of hyperactivity/impulsivity correlate with connectivity between the left medial-orbitofrontal and the left superior temporal gyrus (network 2, r = 0.6, p = 0.01, Fig. 4A). The total number of current symptoms (r = 0.5, p = 0.03; Fig. 4B) and the number of past symptoms of hyperactivity/impulsivity (r = 0.7, p < 0.01; Fig. 4C) also correlated with connectivity between the left medial-orbitofrontal cortex and the left superior temporal gyrus (network 2). These correlations reveal that stronger anticorrelation (negative connectivity) between the left mid-orbitofrontal and the superior temporal gyrus is associated with fewer symptoms.

Associations between values of intrinsic functional connectivity and symptoms of ADHD. A–C, Correlations between ADHD individuals' functional connectivity values in the left medial orbitofrontal-superior temporal connection (network 2) and the following: current symptoms of hyperactivity/impulsivity (A); total number of current symptoms (hyperactivity/impulsivity and inattention) (B); and number of past symptoms of hyperactivity/impulsivity (C). D, Representation of the correlation between the number of past symptoms of inattention and connectivity values in the left amygdala-right precentral gyrus connection (network 1).
The number of past symptoms of inattention was negatively correlated with connectivity between the left amygdala and the right precentral gyrus (network 1, r = −0.5, p = 0.05, Fig. 4D). In this connection, increased functional connectivity correlated with fewer symptoms.
Discussion
This study used a multilevel approach to characterize categorical and dimensional alterations in resting-state brain connectivity in a non-clinical sample of drug-naive, young adults meeting DSM-IV symptom criteria for ADHD. Evidence was found suggesting that the diagnosis of ADHD and its two major symptom dimensions were related to abnormal inter-regional connectivity in distinct functional networks encompassing orbitofrontal, frontal, temporal, occipital cortices, and the amygdala. Between-group differences in intra-regional connectivity were not detected, suggesting that measurement of aberrant functional connectivity in ADHD is mainly a measurement of altered coupling between regions. Our findings support the hypothesis that systemic alterations related to ADHD diagnosis and symptom dimensions extend beyond segregated frontal-striatal networks (Castellanos and Proal, 2012).
There is a growing consensus that many psychiatric disorders, including ADHD, are associated with impaired function of brain networks (Rubinov and Bassett, 2011; Xia and He, 2011; Castellanos and Proal, 2012; Cocchi et al., 2012a,b; Zalesky et al., 2012b). While functional alterations within or between prefrontal and striatal regions in ADHD have been suggested by several fMRI studies, recent results point to a more diffuse set of alterations also encompassing occipital, parietal, temporal, and limbic regions (Casey et al., 2007a; Tian et al., 2008; Makris et al., 2009; Fair et al., 2010; Konrad and Eickhoff, 2010; Castellanos and Proal, 2012; Tomasi and Volkow, 2012). Direct evidence supporting the existence of such widespread alterations in association with ADHD diagnosis and symptoms is however limited and mainly confined to clinical, medicated, and pediatric populations. Our data from a community sample of high-functioning young adults allowed investigation of functional connectivity in ADHD independent of developmental delays, general cognitive dysfunction, or history of medication use.
Significant between-group differences in brain network topology were identified in occipital and temporal regions. Functional alterations in these regions (Castellanos and Proal, 2012), together with impaired attentional and perceptual functions, have been associated with ADHD (Tian et al., 2008; Ahrendts et al., 2011; Liston et al., 2011). Furthermore, functional connectivity between the left orbitofrontal and the right occipital cortex was enhanced in ADHD (network 1). In contrast, connectivity was reduced in the ADHD group between the medial and left orbitofrontal cortices and the left temporal cortex (network 2). However, the reduction in orbitofrontal-temporal connectivity was paralleled by enhanced temporal-occipital connectivity compared to controls. Together, these findings support the existence of complex alterations in orbitofrontal-temporal-occipital connectivity, possibly underpinning altered attentional and perceptual control in ADHD (Cao et al., 2006; Rubia et al., 2009).
Functional alterations in the orbitofrontal cortex have been consistently reported in ADHD and are generally associated with fronto-striatal deregulations thought to underline executive and motivational deficits (Castellanos and Proal, 2012; Volkow et al., 2012). Analysis of brain network topology suggested greater functional segregation of the left orbitofrontal cortex in ADHD. We also found altered functional connectivity between the left orbitofrontal cortex and the amygdala in individuals with ADHD (network 1). Moreover, enhanced connectivity between the left amygdala and the right precentral gyrus in the ADHD group was negatively correlated with the severity of past symptoms of inattention. This negative correlation between values of connectivity and symptoms support previous and current findings suggesting altered integration of autonomic and emotional signals with cognitive mechanisms in ADHD (Castellanos et al., 2006; Proal et al., 2011). Together with the orbitofrontal-temporal-occipital alterations discussed above, abnormal connectivity between prefrontal cortices and the amygdala suggests the existence of a deficit in both emotional/motivational (“hot”) and attentional/perceptual (“cool”) control systems in ADHD (Tomasi and Volkow, 2012) (but see Rubia, 2011).
The ADHD group also showed reduced functional integration in the medial frontal cortex. This is consistent with accumulating findings showing altered dynamics of the default mode network in ADHD, possibly contributing to abnormal function of other systems, including the fronto-striatal and attentional systems (Sonuga-Barke and Castellanos, 2007; Liston et al., 2011; Wilson et al., 2012). We found that stronger anticorrelation between the left medial orbitofrontal and superior temporal cortices in ADHD was associated with fewer numbers of current and past symptoms of hyperactivity/impulsivity and total current symptoms. This finding is consistent with evidence indicating greater levels of anticorrelation between task-positive brain regions, such as the superior temporal gyrus, and regions encompassing the default mode brain network (i.e., the medial orbitofrontal cortex) are associated with reduced symptoms of ADHD (Sonuga-Barke and Castellanos, 2007; see also Kelly et al., 2008; Fassbender et al., 2009; Liddle et al., 2011). Thus, observed reductions in medial prefrontal-superior temporal anticorrelation in highly symptomatic individuals are likely to highlight an impaired functional segregation between task-positive and default mode networks. In this context, attentional fluctuations and interference between interoceptive and exteroceptive behavior in ADHD are thought to be related to the default mode network interference with task-positive networks (Sonuga-Barke and Castellanos, 2007; Chabernaud et al., 2011).
Some important caveats should be considered. First, the degree of brain coverage during image acquisition precluded analyses of the cerebellum, a structure that is thought to be dysfunctional in ADHD (Krain and Castellanos, 2006). In addition, the parcellation of the brain into meaningful regions remains an open issue (Wang et al., 2009b; He and Evans, 2010; Wang et al., 2010; Zalesky et al., 2010a,b; Sporns, 2011; Wig et al. 2011). To address this issue, the positions of the regions comprising the AAL template were displaced to introduce random variability in regional demarcations. The connectivity alterations identified with respect to the displaced template were found to be robust to this variability, thereby suggesting minimal dependency on regional demarcations. A separate issue is the effect of head micro-motion on the measurement of functional connectivity (Power et al., 2012; Satterthwaite et al., 2012). While the effect of head motion in group comparisons needs to be further investigated, the following precautions were taken: participants with excessive head motion were excluded outright, the degree of head movements was verified to be closely matched between the two groups, and the six standard motion parameters were regressed out.
This study includes a group of high-functioning young adults with ADHD. To increase the internal validity of the sample and investigate ADHD-specific alterations, individuals with comorbid symptoms were excluded and the gender ratio was balanced. As the rates of comorbidity are typically high in individuals with ADHD and the disorder is more commonly reported in males (Biederman et al., 1991; Simon et al., 2009), generalization of the current findings to a clinical sample requires caution. On the other hand, the functional brain connectivity alterations identified in the current sample are consistent with structural and functional brain changes previously reported in clinical samples (Konrad and Eickhoff, 2010; Castellanos and Proal, 2012). Assessment of past symptoms was based on retrospective self-report, precluding a reliability check (Sibley et al., 2012). However, in contrast to most previous studies that have relied on self-report symptom checklists for ADHD diagnosis, our study employed extensive semi-structured clinical interviews that required subjects to report examples of ADHD symptoms and the degree of impairments across multiple areas of functioning.
Taken together, our findings suggest that ADHD is associated with altered functional connectivity in large-scale brain networks encompassing the orbitofrontal, frontal, temporal, occipital cortices, and the amygdala. Moreover, the level of these connectivity alterations appears to be strongly coupled with ADHD symptoms. In conclusion, our results support an extension of the conceptualization of brain alterations in ADHD beyond segregated fronto-striatal networks.
Footnotes
This study was supported by a joint research agreement between OIST and IDOR. L.C. was supported by the National and International Research Alliance Program from the Queensland Government (Australia). A.Z. is grateful for the support provided by Prof. Trevor Kilpatrick as part of the inaugural Melbourne Neuroscience Institute Fellowship. This work was also supported by the Australian Research Council Grant DP0986320 (to A.Z.). L.F.F., P.M., I.E.B., and J.M. were supported by D'Or Institute for Research and Education Grants. L.F.F. was supported by Fundação de Amparo à Pesquisa do Estado do Rio de Janeiro (FAPERJ) Awards ID E-26/111.176/2011 and E-26/103.252/2011 and Conselho Nacional de Desenvolvimento Científico e Tecnológico (CNPq) Award (303846/2008-9). We thank Prof. Jason B. Mattingley and Dr. Natasha Matthews for providing important scientific input to the initial drafts of this manuscript. Dr. Cocchi had full access to all of the data in the study and takes responsibility for the integrity of the data and the accuracy of the data analysis.
P.M. was on the speakers' bureau and acted as consultant for Eli-Lilly, Janssen-Cilag, Novartis, and Shire in the last three years. He also received travel awards (air tickets and hotel) to take part in scientific meetings from Janssen-Cilag, Novartis, Eli-Lilly, and Shire in 2010, 2011, and 2012. The Attention-Deficit/Hyperactivity Disorder outpatient program GEDA (Grupo de Estudos do Déficit de Atenção /Institute of Psychiatry) chaired by him received research support from the following pharmaceutical companies in the last three years: Novartis and Shire.
- Correspondence should be addressed to either of the following: Luca Cocchi, Queensland Brain Institute, The University of Queensland, St Lucia 4067, Queensland, Australia, l.cocchi{at}uq.edu.au; or Paulo Mattos, Institute D'Or of Research and Education (IDOR), Rua Diniz Cordeiro 30, Rio de Janeiro, Rio de Janeiro, Brazil CEP 22281-100, Paulo.mattos{at}idor.org


