

Article Figures & Data
Figures
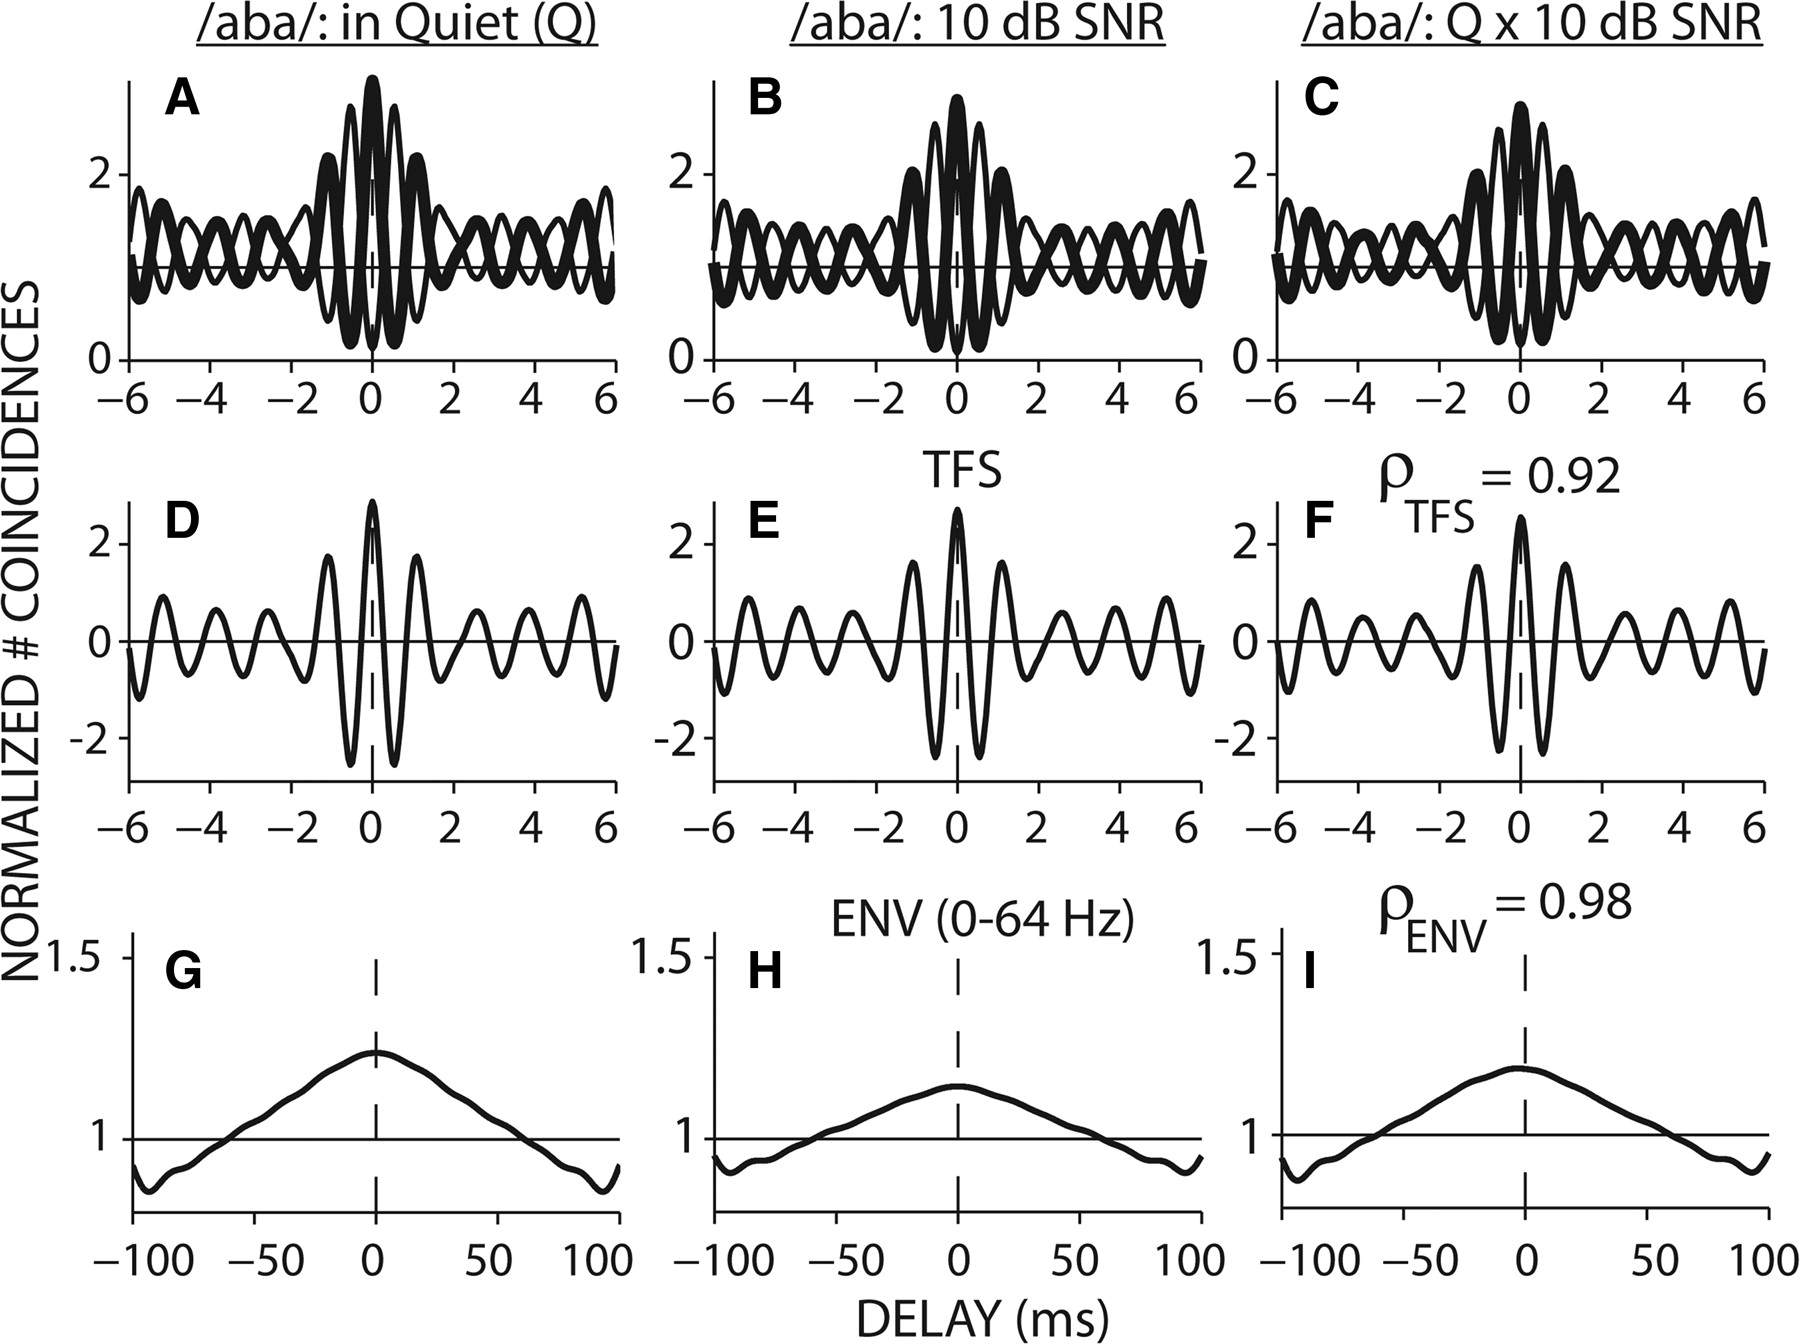
- Figure 1.
Correlogram analyses to quantify the neural coding of ENV and TFS in noise-degraded speech. Columns 1 and 2 show temporal coding of /aba/ in quiet (Q) and for a 10-dB SNR, respectively; column 3 illustrates the similarity in temporal coding between these two conditions. A, B, Normalized shuffled auto correlograms (thick line) and cross-polarity correlograms (thin line). C, Shuffled cross-stimulus correlogram (thick line) and cross-polarity, cross-stimulus correlogram (thin line). D–F, Difcors represent TFS coding, with ρTFS shown in F. G–I, Sumcors represent phonemic (0–64 Hz) ENV coding, with ρENV shown in I. Fiber CF = 1000 Hz.
- Figure 2.
The effects of noise on speech identification and neural coding are compared between intact speech and four speech vocoders that differed in their composition of acoustic ENV and TFS. A, Mean consonant identification scores across listeners (with SEM bars) are shown as a function of signal-to-noise ratio, SNR, with chance level (1/16) indicated by the dashed line. As noise level increased (SNR decreased), identification became more difficult in all cases; however, the relative performance across vocoders differed for positive and negative SNRs. B, C, Neural coding of TFS (ρTFS) and phonemic ENV (ρENV), where the neural cross-correlation coefficients were computed between model spike train responses to the noisy vocoded speech and the intact speech in quiet. Mean ρTFS and ρENV values across AN fibers [all eight CFs ≤ 2.5 kHz for TFS (Johnson, 1980); all 10 CFs ≤8 kHz for ENV] are plotted with SEM bars. Recovered phonemic envelope coding [e.g., from the periodicity envelope (PDENV), broadband TFS (BBTFS), and narrowband TFS (NBTFS) speech vocoders] is represented by dashed curves in C, whereas true phonemic envelope coding is represented by solid curves. Black dashed line at ρENV = 0.1 in C represents the ENV noise floor; the TFS noise floor was negligible (ρTFS = 0.01).
- Figure 3.
Neural coding of phonemic envelope and fine structure predicts VCV identification scores at both positive (A) and negative (B) SNRs. Consonant identification scores for intact and vocoded speech are plotted against predicted identification scores from linear regression models based on ρENV and ρTFS. Data from all five stimulus types (i.e., intact, BBTFS, NBTFS, PHENV, and PDENV) are included for all SNRs. The Adj R2 and p value are inset for each panel (regression coefficients are shown in Table 2). The diagonal line represents a perfect one-to-one match between measured and predicted identification scores.
- Figure 4.
The effects of noise on specific reception of phonetic features for intact and vocoded speech. Mean reception of voicing (A), manner (B), place (C), and nasality (D) is plotted (with SEM bars across listeners) as a function of signal-to-noise ratio. Reception of phonetic features was measured in terms of relative information transmitted (i.e., 1.0 represents perfect reception).
- Figure 5.
Specific reception of voicing, place, manner, and nasality in quiet (filled black symbols) and degraded listening condition (−10 dB SNR; open red symbols) for intact, 16-band phonemic envelope speech (PHENV), broadband TFS speech (BBTFS), narrowband TFS speech (NBTFS), and periodicity envelope speech (PDENV).
- Figure 6.
Neural coding of phonemic envelope and fine structure predicts (Eq. 3, Table 2) measured reception of phonetic features at positive (A–D) and negative (E–G) SNRs. Measured information transmission from psychoacoustical data (from Fig. 4) is plotted against predicted information transmission from neural coding of phonemic envelope and fine structure (ρENV and ρTFS from Fig. 2B,C) for voicing, manner, place, and nasality. At negative SNRs the reception of manner was negligible for most of the vocoder conditions, and thus the regression model was not fit. The adjusted R2 and p value of the regression models are inset for each panel. The diagonal lines represent a perfect one-to-one match between measured and predicted reception scores.


Tables
Consonant Voicing Manner of articulation Place of articulation Nasality /p/ Unvoiced Occlusive Front Non-nasal /t/ Unvoiced Occlusive Middle Non-nasal /k/ Unvoiced Occlusive Back Non-nasal /b/ Voiced Occlusive Front Non-nasal /d/ Voiced Occlusive Middle Non-nasal /g/ Voiced Occlusive Back Non-nasal /f/ Unvoiced Constrictive Front Non-nasal /s/ Unvoiced Constrictive Middle Non-nasal /∫/ Unvoiced Constrictive Back Non-nasal /v/ Voiced Constrictive Front Non-nasal /z/ Voiced Constrictive Middle Non-nasal /j/ Voiced Constrictive Middle Non-nasal /m/ Voiced Constrictive Front Nasal /n/ Voiced Constrictive Front Nasal /r/ Voiced Constrictive Middle Non-nasal /l/ Voiced constrictive Middle Non-nasal Classification of consonants by acoustic phonetic features: voicing (voiced versus unvoiced), manner (occlusive versus constrictive), place (front versus middle versus back), and nasality (nasal versus non-nasal).
- Table 2.
Predictive models of VCV identification and phonetic feature reception based on neural coding of ENV and TFS
Percent Correct Voicing Manner Place Nasality Positive SNRs ENV 0.87 (0.0032) 1.19 (0.0046) 1.21 (0.0018) 1.07 (0.0020) 1.18 (0.0042) TFS 0.66 (0.0317) 1.14 (0.0120) 0.77 (0.0493) 0.85 (0.0194) 1.81 (0.0003) E×T −0.61 (0.1634) −1.02 (0.1100) −0.63 (0.2614) −0.70 (0.1691) −1.73 (0.0091) Adj R2 0.68 0.65 0.75 0.73 0.73 p value (0.0003) (0.0006) (<0.0001) (0.0001) (0.0001) Negative SNRs ENV 0.76 (<0.0001) 0.30 (0.0028) NF 0.40 (0.0042) 0.40 (0.0560) TFS 0.33 (0.0011) 0.19 (0.0031) NF 0.11 (0.1705) 0.82 (<0.0001) E×T 2.65 (0.0004) 1.48 (0.0017) NF 3.84 (<0.0001) 3.24 (0.0023) Adj R2 0.95 0.92 NF 0.95 0.94 p value (<0.0001) (<0.0001) (<0.0001) (<0.0001) Coefficients from the regression models (i.e., b1, b2, and b3 in Eq. 3, corresponding to ρENV, ρTFS, and their interaction, E×T) are shown with their p values in parentheses, along with the overall model goodness of fit (Adj R2) for overall percentage correct (Fig. 3) and the reception of individual phonetic features (voicing, manner, place, and nasality; Fig. 6). Statistically significant coefficients (p < 0.01) are underlined and bold; marginally significant coefficients (0.01 ≤ p < 0.05) are underlined. Top and bottom sections represent positive (Q, 10, 5, 0 dB) and negative (−5, −10, −15, −20 dB) SNRs, respectively. NF, Not fit (e.g., reception of manner was too poor to fit for negative SNRs).


