

Abstract
Information is encoded in the nervous system through the discharge and synchronization of single neurons. The striatum, the input stage of the basal ganglia, is divided into three territories: the putamen, the caudate, and the ventral striatum, all of which converge onto the same motor pathway. This parallel organization suggests that there are multiple and competing systems in the basal ganglia network controlling behavior. To explore which mechanism(s) enables the different striatal domains to encode behavioral events and to control behavior, we compared the neural activity of phasically active neurons [medium spiny neurons (MSNs), presumed projection neurons] and tonically active neurons (presumed cholinergic interneurons) across striatal territories from monkeys during the performance of a well practiced task. Although neurons in all striatal territories displayed similar spontaneous discharge properties and similar temporal modulations of their discharge rates to the behavioral events, their correlation structure was profoundly different. The distributions of signal and noise correlation of pairs of putamen MSNs were strongly shifted toward positive correlations and these two measures were correlated. In contrast, MSN pairs in the caudate and ventral striatum displayed symmetrical, near-zero signal and noise correlation distributions. Furthermore, only putamen MSN pairs displayed different noise correlation dynamics to rewarding versus neutral/aversive cues. Similarly, the noise correlation between tonically active neuron pairs was stronger in the putamen than in the caudate. We suggest that the level of synchronization of the neuronal activity and its temporal dynamics differentiate the striatal territories and may thus account for the different roles that striatal domains play in behavioral control.
Introduction
The striatum, the input stage of the basal ganglia (BG), is known to be involved in motor, cognitive and emotional functions (Graybiel, 2008; Balleine et al., 2009; White, 2009). In primates, the striatum is partitioned into three subregions: the caudate nucleus, the putamen nucleus and the ventral striatum (VS). The caudate and putamen together comprise the dorsal striatum (DS) and the VS includes the nucleus accumbens and the medial and ventral portions of the caudate and putamen (Haber et al., 2011). This double or tripartite division of the striatum is based on both anatomy and functionality (Parent and Hazrati, 1995). However, it is not clear if/ how striatal subregions differentially encode behavior.
Anatomically, the afferent projections of the striatum are derived from the cerebral cortex, thalamus, and brainstem, all of which terminate in a functional, topographic manner in the striatum (Parent, 1986). For example, the putamen and caudate receive cortical input from the sensory–motor and associative areas, respectively (Ragsdale and Graybiel, 1981; Haber et al., 2011), whereas the VS receives input from the limbic areas of the frontal cortex, the amygdala, and the hippocampus (Haber, 2003).
Functionally, lesion studies have suggested that the VS is implicated in reward and motivation (Everitt et al., 1991; Cardinal et al., 2002), whereas the DS is involved in motor and cognitive control (Packard and Knowlton, 2002). Furthermore, within the DS, lesions (or inactivation) of the dorsolateral striatum (putamen) but not of the dorsomedial striatum (caudate) shift habitual to goal-directed behavior (Miyachi et al., 1997; Yin et al., 2004; Yin et al., 2006). Therefore, lesions to the caudate but not to the putamen cause goal-directed actions to become habitual (Miyachi et al., 1997; Yin et al., 2005a; Yin et al., 2005b).
These parallel anatomical and functional corticostriatal loops suggest that there are multiple behavior controllers. Assuming that a behavior is regulated by a single control system raises the question of what mechanism enables one particular striatal domain to control behavioral output (Daw et al., 2005; Redgrave et al., 2010). A small number of studies have attempted to answer this question to achieve a better understanding of striatal functionality using electrophysiological recordings from different striatal subregions. Typically, these studies have involved instrumental conditioning (Miyachi et al., 2002; Williams and Eskandar, 2006), primarily of rodents (Kimchi et al., 2009; Yin et al., 2009; Thorn et al., 2010), and have compared striatal subregions at the level of single cell firing properties. However, no electrophysiological study has compared the response properties of all three subregions in primates performing the same behavioral task. Furthermore, there have been no studies comparing striatal subregions using correlation measures of simultaneously recorded neurons. Therefore, whether and how information is differentially encoded within these corticostriatal loops and the ways in which this could lead to different behavioral outcomes remain unclear. The present study was designed to test the possibility that neuronal synchronization enables the encoding of behavioral events in both the spatial domain (striatal subregions) and the temporal domains (during the performance of a behavioral task).
Materials and Methods
Animals
Two monkeys (Macaque fascicularis, monkey G, male, 4.5 kg; monkey L, female, 3 kg) were used in this study. All experimental protocols were conducted in accordance with the National Research Council Guide for the Care and Use of Laboratory Animals and the Hebrew University guidelines for the use and care of laboratory animals in research. The experimental protocols were approved and supervised by the institutional animal care and use committee of the Hebrew University and Hadassah Medical Center. The Hebrew University is an Association for Assessment and Accreditation of Laboratory Animal Care internationally accredited institution. Surgery procedures, data-recording methods, and single cell analysis have been described in detail previously (Adler et al., 2010; Adler et al., 2012). We present them briefly here and describe the methods not used in the previous manuscripts.
Behavioral task
The monkeys were trained (monkey G for 4 months; monkey L for 3 months) on a classical conditioning task (Fig. 1a) and were engaged in the task during recordings of the neuronal activity. Briefly, each trial began with the presentation of a visual cue [full-screen fractal images generated using the Chaos Pro 3.2 program (www.chaospro.de) and displayed on a 17′ LCD monitor 50 cm in front of the monkeys' faces] for a period of 2 s. The cues were immediately followed by an outcome that could be in one of three categories: liquid food in the reward trials, air puff (directed at both eyes) in the aversive trials, or neither in the neutral trials. The beginning of the outcome state was signaled by one of three sounds (duration, 80 ms) that discriminated the three outcome categories. Trials were followed by a variable intertrial interval (ITI) of 5–6 s. In each category, there were three different visual cues for monkey G and two for monkey L. In the rewarding and aversive trials, the cues were differentiated by the magnitude or intensity of the liquid food or air puff, respectively. In the neutral trials, the cues were differentiated by a change in the duration of the ITI (−2/0/+2 s to ITI duration). In total, there were nine different visual cues for monkey G (six for monkey L); three (two for monkey L) for each outcome category. In some of the analyses, we combined the trials within each outcome category and present the results for the rewarding trials (which include all amounts of liquid food), the aversive trials (which include all air puff intensities), and the neutral trials. Visual fractal cues and auditory sounds were randomized between monkeys.
Magnetic resonance imaging
We estimated the stereotaxic coordinates of the physiological recordings using magnetic resonance imaging (MRI) scans. After surgery, an MRI scan (General Electric or Siemens 3 tesla system, T2 sequence) was performed with five tungsten electrodes at accurate coordinates of the recording chamber [Y,X = (6,0) (0,−6), (0,0), (0,6), and (−6,0) in mm from the chamber center]. We then aligned the two-dimensional MRI coronal scans with the sections of the atlas of M. fascicularis (Martin and Bowden, 2000). We performed an additional MRI scan at the final stage of the recording period to verify our coordinate system and to rule out a significant brain shift. We used additional physiological parameters (as described below) to identify the putamen, caudate, and VS. At the completion of the experiments and after a recovery period, we sent the monkeys for rehabilitation to the Ben-Shemen Primate Sanctuary (http://www.monkeypark.co.il/), which is operated by the Israeli Primate Sanctuary Foundation (http://ipsf.org.il/). We therefore did not make microlesions at the end of each electrode track and cannot report postmortem histology.
Recording and data acquisition
During recording sessions, the monkeys' heads were immobilized. Licking and blinking behavior was recorded by an infrared reflection detector (Dr. Bouis) and video computerized analysis (Mitelman et al., 2009). Neuronal activity was recorded by eight glass-coated tungsten microelectrodes (impedance at 1 KHz = 0.3–0.8 MΩ) that were advanced separately (EPS; Alpha-Omega Engineering) into the striatum (AC −1 to AC +4). We identified the putamen and caudate subregions by mapping the medial-lateral plane and used the typical axonal activity of the internal capsule as a divider between the two regions. The axonal activity of the internal capsule is characterized by extremely sharp and narrow waveforms deflected upward (initial positive), as opposed to the wide, downward deflections (initial negative phase) of somatic action potential spikes (Lemon, 1984). We identified the VS by lowering the vertical position of the electrodes at least 4 mm below the first identification of the striatum. The average vertical distance of the units from the first identification of the striatum was 1.04 ± 0.04 mm (average ± SEM) for putamen cells, 1.08 ± 0.05 mm for caudate cells, and 4.56 ± 0.03 mm for VS cells. In each recording session, we targeted either the lateral part of the striatum (i.e., four electrodes in the dorsolateral striatum, the putamen and four electrodes in the VS) or the medial part (i.e., four electrodes in the dorsomedial striatum, the caudate and four electrodes in the VS). Spike activity was sorted online using a template-matching algorithm (ASD; Alpha Omega Engineering) by two experimentalists (each responsible for no more than four electrodes).
Recorded neurons were subjected to offline quality analysis that included tests for rate stability, refractory period, and waveform isolation (Hill et al., 2011). First, the firing rate was graphically displayed as a function of time and the largest continuous segment of stable data was selected for further analysis. Second, cells in which >0.02 of the total ISIs were shorter than 2 ms were excluded from the database. Third, only cells with an isolation score (Joshua et al., 2007) >0.7 were included in the database. Finally, only single cells recorded for >18 min for monkey L and 21 min for monkey G during task performance and only pairs of cells simultaneously recorded on two different microelectrodes for >21 min for monkey L and >30 min for monkey G during task performance were included in the database.
Single cell analysis
We conducted a clustering analysis to differentiate the activity of single medium spiny neurons (MSNs) into groups of cells with similar response profiles (Adler et al., 2012). Briefly, we first characterized the neural responses to the behavioral events by the poststimulus time histogram (PSTH) and then ran a principal component analysis on the normalized PSTHs. We used the projection of the data points on the first two principal components to represent the response vector of each cell and applied the K-means algorithm on the cells' principal component representation. We ran the analysis on all MSNs recorded in all striatal territories together and on the MSNs recorded in each territory separately. We obtained three temporally distinct response profiles (i.e., clusters; see Fig. 4) when we ran the analysis on both the entire striatal MSN population and separately within each territory. Eighty percent of the cells were classified into the same temporal cluster in the two runs. We present the data below from the analysis of all MSNs recorded in all striatal territories together.
Pairwise correlation analysis
Signal correlation.
Signal correlation measures the similarity of the responses to behavioral events (i.e., PSTHs) of two neurons. We used a time window of 2 s starting at event (i.e., cue and outcome) onset. For each neuron, we computed the PSTHs in 100 ms bins (without smoothing) for all behavioral events. We combined all PSTHs of a single cell into one matrix with rows (n = 9 for monkey G and n = 6 for monkey L) for each behavioral event and columns (n = 20) for each 100 ms time bin. For each column (time bin), we subtracted that column's mean and then flattened the matrix (column after column) into a single vector. For each pair of simultaneously recorded neurons, we computed the signal correlation by calculating the correlation coefficient of these two vectors. Because a noise correlation can significantly bias the signal correlation, we applied a correction procedure (Rothschild et al., 2010). Briefly, we calculated the covariance of the average responses using the single trial responses; however, we removed the simultaneous trial terms from the sum to achieve a nonbiased estimate of the signal correlation. We obtained similar results with and without the correction (data not shown). We also calculated the signal correlation for all pairs, including pairs that were not simultaneously recorded, and were therefore likely to be further from one another, and obtained similar results. The data displayed below were not subjected to the noise correlation correction procedure and refer to simultaneously recorded pairs.
Noise correlation.
Noise correlation is a measure of the similarity of the trial-to-trial variability (around the average PSTH) of two neurons. We computed the spike counts in 2000 ms bins after the onset of all behavioral events for each neuron for all trials. For each event, we computed the average spike count over all trials and then subtracted this mean from the trial-to-trial spike counts. We then combined all spike counts from all behavioral events into a single vector. For each pair of simultaneously recorded neurons (by definition, the noise correlation can be calculated only for simultaneously recorded neurons), we computed the noise correlation by calculating the correlation coefficient of these two vectors.
Joint PSTH analysis.
Noise correlation measures the similarity of the trial-to-trial variability over large 2000 ms bins. To characterize the temporal dynamics of the noise correlation during the behavioral epochs we calculated the joint PSTH (JPSTH). We first calculated the raw JPSTH, in which the (t1,t2) time bin was the count of the number of times there was a coincident event in which neuron number one spiked in time bin t1 and neuron number two spiked in time bin t2 in the same trial. To correct for rate modulations, we calculated the PSTH predictor matrix, which is the product of the single neuron PSTHs. The JPSTH was calculated by subtracting the PSTH predictor from the raw matrix (Aertsen et al., 1989; Joshua et al., 2009) in bins of 50 ms and smoothed with a two-dimensional Gaussian window with an SD of 50 ms (single bin). We also computed the JSPTH using a shift predictor and obtained similar results (data not shown). The data from the two monkeys were grouped because no significant differences were detected between them. Data analysis was performed on custom software using MATLAB version 7 (MathWorks).
Results
Behavioral task and neuronal database
We recorded striatal neuronal activity from two monkeys while they were engaged in a classical conditioning task. The monkeys were introduced to visual fractal images that predicted a food outcome in the rewarding trials, an air puff in the aversive trials, or neither in the neutral trials (Fig. 1a, left). Recording sessions followed an extensive training period of several months; therefore, during recordings, the monkeys were overtrained on the task, were familiar with the visual cues, and displayed the appropriate anticipatory licking and blinking behavior (Fig. 1a, right). We used conventional physiological methods to record the spiking activity of striatal phasically active neurons (presumably striatal MSNs) and striatal tonically active neurons [presumably cholinergic interneurons (tonically active neurons or TANs)]. Classification of striatal cells was done online based on the spike waveforms, firing rate, and pattern (Berke et al., 2004; Sharott et al., 2009) and was validated offline (compare Fig. 2 with Fig. 8; note the different ranges of the X-axes). Recordings were made from the three territories of the anterior striatum, putamen, caudate, and VS (Fig. 1b) and from two to eight electrodes simultaneously (Fig. 1c is an example of simultaneous recording of six electrodes in the putamen). Overall, the recordings of 896 MSNs (334, 265, and 287 in the putamen, caudate, and VS, respectively), 309 TANs (145, 125, and 39 in the putamen, caudate, and VS, respectively), and 617 (337, 148, and 132 in the putamen, caudate, and VS, respectively) MSN-to-MSN pairs and 110 (72 and 38 in the putamen and caudate, respectively) TAN-to-TAN pairs satisfied our analysis inclusion criteria (see Materials and Methods) and are reported here.

Behavior and recording during the classical conditioning task. a, Left, Classical conditioning paradigm. Visual cues were presented for 2 s and predicted the delivery of food (reward trials, upper row), air puff (aversive trials, third row), or only sound (neutral trials, second row). The trial outcome epoch was followed by a variable ITI of 5–6 s. Right, Normalized behavioral response (average ± SEM, solid line and shaded envelope, respectively). The monkeys' licking and blinking behavioral responses were normalized between 0 and 1. In each time bin (20 ms), the licking and/or blinking response (x) was transformed by (x − min)/(max − min), where min and max are the minimal and maximal values of the response over all time bins, respectively. Ordinate shows normalized licking response minus normalized blinking response; abscissa shows time. Time 0 indicates the cue presentation followed by outcome delivery at time 2 s. Blue indicates reward trials; green, neutral trials; and red, aversive trials. b, Recording sites. Shown is a representative coronal section +3 mm from the anterior commissure (adapted from Martin and Bowden, 2000). Eight electrodes were advanced separately into one or two of the three subregions of the striatum. P, Putamen; C, caudate; V, VS. c, Example of six simultaneously recorded units from the putamen. Each row is for a single electrode. Left, A 4 s analog trace of extracellular recording filtered between 300 and 6000 Hz. Right, Examples of spike waveforms. The spike waveform plot includes 100 superimposed 4 ms waveforms selected randomly from the whole recording time of the cell. Black, MSNs; gray, TANs.

MSNs in the different striatal subregions display similar spiking parameters. a, Distribution of average MSN spontaneous (ITI) firing rates by striatal subregions. Abscissa shows the firing rate in Hz. The firing rate was calculated for each unit as the total number of spikes divided by the duration of the full-time segment used for analysis. The firing rate is displayed in logarithmic scale for clarity due to the low firing rates and wide range (0.01–7.8 Hz) of MSN discharge rates. Ordinate shows the ratio of cells. First row are MSNs recorded in the putamen (n = 344); second row, MSNs recorded in the caudate (n = 265); and third row, MSNs recorded in the VS (n = 287). b, Distribution of the coefficient of variation (CV) of the interspike intervals of MSNs in the striatal subregions. Abscissa shows the CV; ordinate, the fraction of cells (same conventions as in a). c, Distribution of average MSN waveform length by striatal subregions. Abscissa shows the spike waveform length calculated as the duration from the first negative peak to the next positive peak of the extracellular recorded action potential; the ordinate shows the fraction of cells (same conventions as in a).
MSNs in different striatal subregions display similar spontaneous spiking characteristics
We compared the spiking parameters of MSN spontaneous discharges (during the ITI period) across regions. The MSN average spontaneous firing rates (1.06 ± 0.06, 0.77 ± 0.04, and 1.31 ± 0.07 spikes/s ± SEM in the putamen, caudate, and VS, respectively) were similar but still significantly different across all three territories (p < 0.05 by one-way ANOVA; Fig. 2a). The coefficient of variation of the interspike interval (1.54 ± 0.49, 1.6 ± 0.5, and 1.53 ± 0.4 in the putamen, caudate, and VS, respectively), which is a measure of firing pattern, did not differ between the subregions (Fig. 2b). Finally, the length of the MSN spike waveforms, calculated as the duration from the first negative peak to the next positive peak of the extracellular recorded action potential (1.39 ± 0.04, 1.6 ± 0.09, and 1.39 ± 0.04 ms ± SEM in the putamen, caudate, and VS, respectively), was longer in the caudate than in the putamen and VS (p < 0.05 by one-way ANOVA; Fig. 2c). Therefore, although there were differences in the cells' spiking parameters, these were not consistent across the different measures of spontaneous activity and therefore did not indicate that the MSNs recorded in the different striatal subregions represented different types of cells. More importantly, they cannot explain our results below. In the next section, we describe and compare the encoding of the task events by the different striatal subregions, first at the level of firing rate modulations and then at the level of static and dynamic modulations in the correlations between pairs of simultaneously recorded neurons.
MSNs in striatal different subregions display similar response profiles
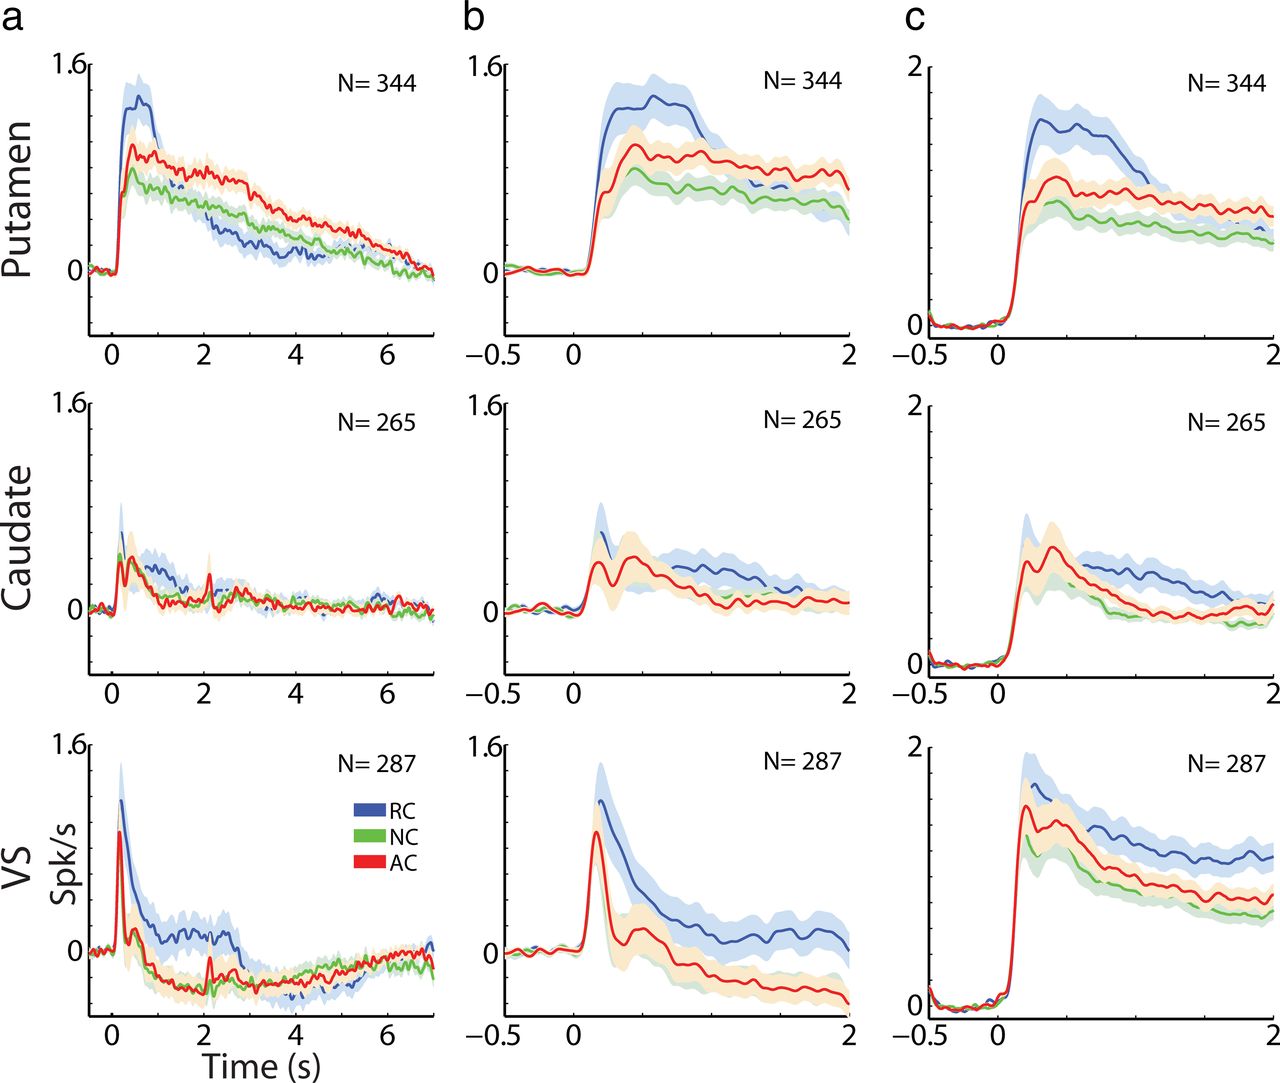
MSNs in all three striatal regions were highly modulated by the task (84.8% of putamen MSNs, 78.1% of caudate MSNs, and 77.7% of VS MSNs showed significant rate modulations) and displayed increases and/or decreases in discharge rates in response to the task events. When we compared the average response profile across regions, we found several differences (Fig. 3). However, as reported previously, MSNs display very diverse activity to significant behavioral events, which implies that the average population response is not the best estimate of neuronal activity (compare Fig. 3, column b, which displays the population average response and Fig. 3, column c, which displays the average over the absolute value of the responses). To better characterize the diverse modulations in MSN firing rate, we clustered the cells into groups with similar response profiles (Adler et al., 2012). Figure 4a displays the average response profiles of striatal MSNs to the three task events separately for each response cluster (columns) and for each subregion (rows). The MSNs in all three regions best fit three response groups (clusters) that were differentiated primarily by their temporal profile (Fig. 4a). Clusters one, two, and three could be characterized by “brief excitation,” “intermediate excitation,” and “delayed prolonged excitation,” respectively. The profile of the average response of each cluster was similar across striatal subregions. We compared (p < 0.05 by one-way ANOVA) the MSN responses within each cluster across regions using two parameters: the spike count over the 2 s of cue presentation and the time of peak response (Fig. 4b,c). The only significant difference was between the VS and the putamen and caudate in the third response group (cluster 3). Conversely, the average spike count and time of peak response were significantly different across the three clusters when pooling over all MSNs (putamen, caudate, and VS). Overall, we found significant and similar modulations in firing rates to the task cue events in all striatal territories. The temporal modulations in firing rate in response to the behavioral cues in our classical conditioning task were similar for the putamen, caudate, and VS, and the three territories could not be differentiated solely on this basis.

MSN cell population average response. a, Average MSN cell population response (±SEM) to behavioral events. Each row is the average response of MSNs recorded in a single striatal subregion. The PSTHs were calculated in 1 ms bins and smoothed with a Gaussian window with a SD of 20 ms. The baseline firing rate, calculated by averaging the firing rate in the last 0.5 s of the ITI, was subtracted from the smoothed PSTH. Abscissa shows the time in seconds. Time 0 indicates the cue presentation followed by outcome delivery at time 2 s. The display is extended into the ITI to depict the return of the MSN discharge to baseline levels. Ordinate shows the firing rate in Hz. Blue indicates responses to all reward cues; green, responses to all neutral cues; and red, responses to all aversive cues. N indicates the number of neurons. b, Average MSN cell population response (±SEM) to behavioral cues alone. Cues were presented at time 0 (same conventions as in a). c, MSN cell population response to behavioral cues averaged over the absolute value of the PSTHs. The absolute PSTH was calculated for each neuron and then averaged over the entire population (same conventions as in b).

MSNs in different striatal subregions display similar response profiles. a, MSN responses (±SEM) to the behavioral events divided into response clusters. Abscissa shows the time in seconds. Time 0 indicates the cue presentation followed by outcome delivery at time 2 s. Ordinate shows the firing rate in Hz normalized by the ITI discharge rate. Blue RC, reward events; red AC, aversive events; green NC, neutral events. Rows are the striatal subregions: first row is the putamen; second row, the caudate; and third row, the VS. Columns show the average (±SEM, solid line and envelope) response clusters. In each subplot, N indicates the number of MSNs averaged and the percentage of these units of all the units in that subregion. b, Distributions of average MSN spike counts to cue presentation (time 0–2 s only). Each black dot represents an individual MSN. Red dots indicate population means. p, Putamen; c, caudate; v, VS. Asterisk marks statistically significant difference (p < 0.05 by one-way ANOVA). c, Distributions of time of peak response for all MSNs (same conventions as in b).
There were small differences in the outcome PSTHs of the different striatal regions (Fig. 4a). However, to avoid possible confounding effects triggered by motor components in this epoch, we targeted our analysis (PSTH and correlation analysis) on cue presentation epoch (time 0–2 s).
MSN pairs in the putamen, but not in the caudate or VS, exhibit positive signal and noise correlations
The synchronization of neural activity plays a major role in encoding and decoding information in the nervous system (Schneidman et al., 2003; Averbeck et al., 2006). The signal correlation measures the similarity between the average responses of a pair of neurons to behavioral events. Its values range from +1 to 0 to −1 for highly correlated to noncorrelated to anticorrelated response profiles, respectively. The noise correlation measures the correlation between the deviations of the trial-to-trial discharge rate from the average responses spanning the same range (1 to −1) as the signal correlation (Lee et al., 1998; Averbeck and Lee, 2004; Joshua et al., 2009).
Figure 5 shows the distributions of the signal and noise correlation (left and middle columns calculated over all behavioral events; i.e., cue presentation and outcome delivery) for all simultaneously recorded MSN pairs for each subregion (rows). We found that the distributions of the signal correlation for caudate and VS MSN pairs were symmetrical around zero (Fig. 5b,c). Indeed there was a similar ratio of pairs that had a significant (p < 0.05 by t test) positive and negative correlation (Fig. 5b,c, inset). Similarly, the distributions of the noise correlations for the caudate and VS MSN pairs were also symmetrical around zero and were very narrow, as evidenced by the smaller ratio of pairs with a significant correlation. Conversely, the distributions of both the signal and noise correlation of putamen MSN pairs (Fig. 5a) had a strong tail toward positive correlation values and a higher percentage of pairs displayed a significant positive correlation (compared with the negatively correlated putamen MSN pairs and the caudate and VS). The distributions of signal and noise correlations of putamen MSN pairs were significantly different from those of the caudate and VS pairs (p < 0.05 by one-way ANOVA for both signal and noise). To confirm that the differences between the putamen and caudate/VS could not be attributed to the higher number of putamen MSN pairs, we also compared the distributions (one-way ANOVA) when randomly selecting 150 putamen pairs. We repeated this process 1000 times and found that the signal and noise distributions of the partial sampling of putamen pairs were significantly different from those of the caudate and VS on almost all runs (97–100% of the runs, depending on the comparison for signal vs noise and caudate vs VS).

MSNs in the putamen, but not in the caudate or VS, display positive signal and noise correlations. a, Distributions of the signal (left) and noise (middle) correlations for putamen MSN pairs. Abscissa shows correlation coefficient values; ordinate, ratio of pairs. Inset shows the ratio of pairs that had a significant positive (gray) or negative (black) correlation. Right: Correlation between the signal (abscissa) and noise (ordinate) correlation. N indicates the number of MSN pairs. Lower right, R2 and a (slope) of the linear fit. b, Same as in a for the caudate MSN pairs. c, Same as in a for the VS MSN pairs.
Finally, Figure 5, right column, depicts the correlation between the two measures of neuronal synchrony (signal and noise correlation). There was a strong linear relationship (p < 0.05 by F test) between the signal and noise correlation of putamen MSN pairs: when a pair of putamen MSNs tended to have a high signal correlation, they also tended to have a high noise correlation and vice versa (similar results were obtained using type 2 regression, data not shown). Although there was also a linear relationship (p < 0.05 by F test) between the two measures for MSN pairs in the caudate and VS, it was not as strong, as shown by the differences in R2 values and the slope of the linear fit.
To further confirm that the increased correlation found solely in putamen MSN pairs was not a result of systematically recording closer cells in that subregion, we compared the vertical distance between all cell pairs. Only pairs recorded on different electrodes were included in this study. The vertical distance for cell pairs in the VS (0.38 ± 0.03 average ± SEM) was significantly shorter than the putamen (0.55 ± 0.03 average ± SEM, p < 0.05 by one-way ANOVA). The vertical distance for cell pairs in the caudate (0.42 ± 0.03 average ± SEM) did not differ from the other two regions. Although there was a difference in the vertical distance of the cell pairs, it was shorter in the VS, which would suggest an opposite bias in space.
We also calculated the noise correlation during the ITI period (using the last 1 s of the ITI). Although noise correlations during the ITI period were lower than noise correlations during task performance, a similar trend was observed: the noise correlation distribution of MSN pairs in the putamen was more positively skewed compared with the caudate or VS (p < 0.05 by one-way ANOVA) and a higher percentage of pairs displayed a significant positive correlation. Furthermore, we found a significant correlation between the noise correlation in the putamen MSN pairs during task performance and during the ITI period (R2 = 0.38, p < 0.05).
Last, we also calculated the signal correlations for pairs that were not simultaneously recorded (n = 20736, 11248, and 13741 pairs in the putamen, caudate, and VS, respectively) and found a similar distribution as the simultaneously recorded pairs alone (data not shown). Furthermore, there was no relationship between the correlation measures for a pair of neurons and their response profile (i.e., their cluster identity; data not shown).
Putamen MSN pairs display different noise correlation dynamics to different behavioral events
The noise correlation presented in Figure 5 was calculated on the entire trial epoch (cue presentation or outcome delivery) as a single bin (2 s each) and did not relate separately to the different behavioral events. We examined the time course of the correlation along the trial and compared the modulation in synchronized activity between the different behavioral events. We thus calculated the JPSTHs (Aertsen et al., 1989; Vaadia et al., 1995) corrected for rate modulations triggered by the behavioral events for all simultaneously recorded MSN pairs.
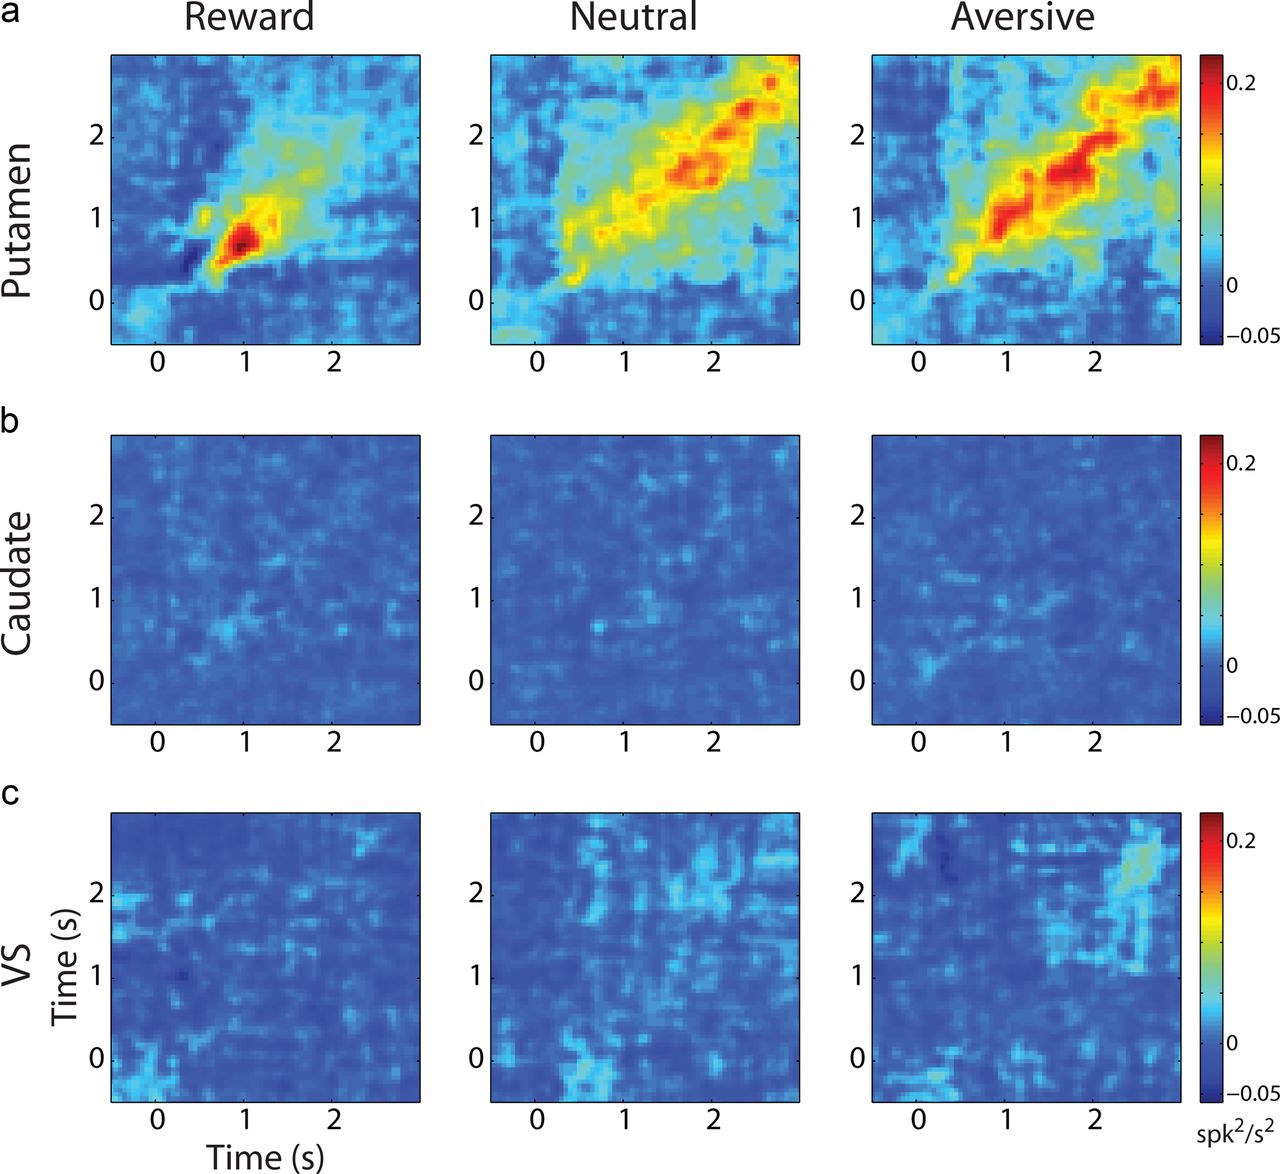
Figure 6 shows the JPSTH averaged over all MSN pairs for each striatal region (rows) and for each behavioral event (columns). The main diagonal of the JPSTH captures the time course of the modulation in correlations (with zero delay) beyond those predicted by the changes in firing rates (i.e., it depicts the dynamics of the noise correlation calculated in 50 ms bins). The data show a significant increase in correlation along the main diagonal of the JPSTH for putamen MSN pairs for all behavioral events (Fig. 6a, t test, p < 0.05). This result is consistent with the positive noise correlation between putamen MSN pairs (Fig. 5a). Second, the JPSTH analysis of putamen MSN pairs revealed different dynamics for the different behavioral events. Whereas the increase in correlation in the reward event was transient and occurred ∼1 s after cue presentation, the increase in correlation for the aversive and neutral events was more sustained and lasted throughout the remaining time of cue presentation. The modulations along the main diagonal were significantly different between the rewarding and aversive/neutral events (p < 0.05 by paired t test). To ascertain that these changes in correlation did not reflect only the discharge rate modulations, we examined the predictor matrix and found that it did not account for the differences found in the pattern of the JPSTH between the rewarding and aversive/neutral events (Fig. 7). Specifically, we found that although there was an immediate and sharp increase in discharge rate for all behavioral events, the increase in correlation for the reward event was steep and transient, whereas the increase in correlation for the aversive and neutral events was moderate and sustained. Finally, we did not find an oscillatory component in the synchronization between putamen MSN pairs.

Putamen MSN pairs display different dynamics of noise correlation in the different behavioral events. a, Population JPSTH of putamen MSN pairs (n = 337). Left column shows reward trials; middle column, neutral trials; and right column, aversive trials. Time 0 indicates the cue presentation followed by outcome delivery at time 2 s. The different JPSTHs have the same color scaling (color bar on the right) to enable comparison of the different behavioral events. b, Population JPSTH of caudate MSN pairs (n = 148). c, Population JPSTH of VS MSN pairs (n = 132). a, b, and c have the same color bar to enable comparison of striatal subregions.

Dynamics of noise correlation of putamen MSN pairs do not reflect rate modulations. a, Common rate modulation: diagonal of the PSTH predictor (±SEM, shaded envelope) for putamen MSN pairs (n = 337). Time 0 indicates the cue presentation followed by outcome delivery at time 2 s. Blue indicates reward cues; green, neutral cues; and red, aversive cues. b, Zero lag noise correlation: JPSTH diagonal (±SEM, shaded envelope) for putamen MSN pairs (n = 337; same conventions as in a).
Putamen TAN pairs display a stronger noise correlation
TANs in the different striatal subregions displayed very similar spontaneous spiking parameters (except for slower average discharge rates in the VS than in the putamen and caudate, p < 0.05 by one-way ANOVA, Fig. 8) and similar response profiles (Fig. 9). We therefore examined the correlations between simultaneously recorded TAN pairs as was done for the MSN pairs. Although we identified and recorded TANs in the VS, they were harder to detect in this subregion (especially compared with the DS). Therefore, our database included fewer single TANs from the VS (n = 39) and no pairs (Bernacer et al., 2007, for the differential distribution of cholinergic interneurons in the striatum). Our correlation analysis of TAN-to-TAN pairs thus only included the striatal putamen and caudate subregions.

TANs in the different striatal subregions display similar spiking parameters. a, Distribution of average TAN spontaneous firing rates by striatal subregions. Abscissa shows firing rate in Hz; ordinate, ratio of cells. First row shows TANs recorded in the putamen; second row, caudate; and third row, VS (same conventions as in Figure 2a). b, Distribution of coefficient of variation (CV) of the interspike intervals of TANs in the three striatal subregions. Abscissa shows CV; ordinate, fraction of cells (same conventions as in a). c, Distribution of average TAN waveform length by striatal subregions. Abscissa shows spike waveform length calculated as the duration from the first negative peak to the next positive peak of the extracellular recorded action potential; ordinate, fraction of cells (same conventions as in a).

TANs in different striatal subregions display similar response profiles. a, Average TAN population responses (±SEM) to behavioral events. Time 0 indicates the cue presentation followed by outcome delivery at time 2 s. Same conventions as in Figure 3a. b, Distributions of time of peak and minimum response and of average spike counts to cue presentation for all TANs. Each black/gray/blue dot represents an individual TAN. Red dots indicate population means. p, Putamen; c, caudate; v, VS. The distributions were not different across striatal subregions (one-way ANOVA). Black indicates time of minimum response; gray, time of peak response; and blue, average spike counts.
As we showed previously for putamen TAN pairs (Joshua et al., 2009) and extended here to caudate TAN pairs, the distributions of the signal and noise correlations were extremely skewed to the right (Fig. 10a), which is consistent with their stereotyped responses and synchronized activity (Graybiel et al., 1994;Joshua et al., 2008 and Fig. 9). However, as was the case for the MSN pairs, the TAN pairs displayed differences in synchrony between the putamen and the caudate. Specifically, more putamen TAN pairs had a significant positive noise correlation (Fig. 10a, inset), stronger correlation values for single pairs (Fig. 10a, histogram), and a stronger linear relationship between the signal and noise correlation measures (Fig. 10a, right column). Due to the difference in the number of pairs and to enable a better comparison between the putamen and the caudate, we also examined the signal and noise distributions when we relaxed our inclusion criterion (time of simultaneous recording reduced from 21 and 30 min in monkeys L and G, respectively, to 15 and 21 min, respectively), thus increasing the number of TAN pairs in the caudate to 61. Similar results (differences between regions) were obtained. The distributions (signal and noise) were significantly different between regions (p < 0.05 by t test).

Noise correlation between TAN pairs is stronger in the putamen than in the caudate. a, Distributions of signal (left) and noise (middle) correlations and the correlation between the two measures (right) for TAN pairs recorded in the putamen (first row, n = 72) and caudate (second row, n = 38). Same conventions as in Figure 5. b, Population JPSTH of TAN pairs. First row shows the putamen; second row, caudate (same pair numbers as in a, same conventions as in Figure 6).
The JPSTHs of TAN pairs did not reveal significant modulations along the main diagonal (except for the reward event, p < 0.05 by t test, Fig. 10b). However, the data supported the difference in the noise correlation distributions of TAN pairs described above, in which the diagonal of the JPSTH of putamen TAN pairs differed from that of caudate TAN pairs for all behavioral events (p < 0.05 by t test).
Discussion
In this study, we compared the encoding of well learned rewarding, aversive, and neutral cues across striatal subregions. We conducted two complementary analyses, modulations of firing rates as related to the behavioral events and the correlation structure of simultaneously recorded pairs of neurons. We found that most MSNs and TANs in all striatal territories displayed significant modulations in firing rates to the task. Furthermore, the response profiles of TANs and MSN clusters were similar across striatal territories. The most pronounced difference across regions was revealed in the correlation structure. MSN pairs in the putamen displayed a positive average signal and noise correlation, which contrasted with the (closer to zero) correlations in the caudate and VS. In the putamen, the signal and noise correlations were correlated. Furthermore, putamen MSN pairs displayed different dynamics in their discharge covariation (modulations of noise correlation) to the different behavioral events (reward vs aversive and neutral). The correlation structure of TAN pairs supported the results found for the MSN pairs, in that TAN pairs in the putamen displayed stronger noise correlations than those found in the caudate. Therefore, our results indicate that the increased neural correlations observed solely in the putamen enabled efficient information encoding and were suggestive of a more effective information transfer from the putamen to their downstream targets during the performance of a well practiced task.
Neural correlations reflect the different roles of striatal subregions
Previous studies have suggested that the differences in the anatomy and connectivity of striatal regions is reflected in their functionality (Alexander et al., 1986; Cardinal et al., 2002; Yin et al., 2004; Yin et al., 2006). This supposition assumes that the putamen is involved in habitual behavior, the caudate in goal directed behavior, and the VS in reward and motivation (Yin and Knowlton, 2006; Graybiel, 2008; Redgrave et al., 2010). Because these parallel functional systems can lead to a single behavioral outcome/response, they are likely to converge onto the same lower level motor structures (Redgrave et al., 2010). This therefore raises the question of what processing mechanism enables one striatal system to mediate behavior over the others.
Previous studies have compared the activity in striatal regions solely at the level of rate coding by examining single cell discharge (e.g., Yamada et al., 2004; Williams and Eskandar, 2006; Ding and Gold, 2012). These and other studies described a shift in activation of single cells, in which learning of new motor responses and the initial stages of learning activated the caudate, but well learned motor sequences and advanced stages in training activated the putamen (Miyachi et al., 2002; Yin et al., 2009).
We hypothesized that rate coding and neural synchronization as a means for encoding the behavioral events can occur separately or together (Eggermont, 1990; Abeles, 1991; Ginzburg and Sompolinsky, 1994; Ben-Yishai et al., 1995; Panzeri et al., 2002; Averbeck and Lee, 2004; Averbeck et al., 2006). We therefore compared the neuronal activity in striatal regions in the same overtrained behavioral task on both levels. We found that cells in all regions were highly modulated by the task and displayed similar response profiles. However, we found an increase in the neuronal correlations solely in the putamen region. Because overtraining promotes habit formation (Dickinson, 1985; Colwill and Rescorla, 1988; but also see Holland et al., 2008), our task involved a more habitual rather than goal-directed behavior. Therefore, the increase in neural correlations in the putamen may have reflected the differences in the functional roles of striatal territories. The increased synchronization found between putamen TAN-TAN and MSN-MSN pairs could have supported the efficient information flow from the putamen neuromodulators to the putamen projection neurons (Threlfell et al., 2012) and from the putamen to its downstream BG structures during an overtrained, possibly habitual task. We did not find evidence for increased correlation in the putamen during performance of a different learning task (data not shown). However, these data were restricted and future studies will need to ascertain whether the increase in correlation is indeed specific to the task or an innate property of the putamen. Finally, recent anatomical studies have revealed that the corticostriatal projections often display a dorsal-ventral gradient and do not simply obey the caudate/putamen/VS boundaries (Calzavara et al., 2007). Our results sustain a functional dorsolateral versus medioventral segregation of the striatum (Voorn et al., 2004); however, they are still consistent with the description of diffuse and integrative corticostriatal projections (Haber et al., 2011).
Differential synchronization level of MSNs in response to behavioral cues may enable efficient information transfer from the putamen
We found that putamen MSN pairs displayed positive signal and noise correlations. Moreover, there was a linear relationship between the two measures. A positive signal correlation is usually interpreted as originating from common input, whereas a positive noise correlation is usually interpreted as reflecting local synaptic connections (Gawne and Richmond, 1993; Lee et al., 1998). Positive noise correlations have been associated with decreased information coding (Zohary et al., 1994). However, once the network is not completely homogeneous in terms of the signal correlation (as in our case), the noise correlation should not necessarily limit information (Averbeck and Lee, 2004; Shamir and Sompolinsky, 2006).
Our finding of a strong linear relationship in the putamen between the two correlation measures suggests a model of functional interconnected subnetworks that share common inputs, a model that has been put forward for cortical networks (Yoshimura et al., 2005; Rothschild et al., 2010). According to this model, during overtrained behavior, the putamen network is organized such that interconnected neuronal assemblies convey synchronized input to their downstream target. The transfer of information can be more reliably propagated by synchronous neuronal activity rather than by single cell rate modulations (Bruno and Sakmann, 2006; Bruno, 2011), thus enabling the putamen to control behavior over the caudate and VS.
In addition, we examined the dynamics of the noise correlation with the different behavioral events using JPSTH analysis. JPSTH can be used to identify temporal modifications in the functional connectivity of a circuit as a result of behavioral stimuli and context (Espinosa and Gerstein, 1988; Aertsen et al., 1989; Ahissar et al., 1992; Vaadia et al., 1995; Cohen and Newsome, 2008). We found that putamen MSN pairs displayed increased correlations after cue presentation. Furthermore, the temporal profile of the modulation in the rewarding condition differed from that observed in the aversive and neutral conditions. This differential encoding suggests that the correlation structure of the network may be informative regarding the encoding of the task and is coherent with our previous observation of dopaminergic neuron pairs (Joshua et al., 2009). These JPSTH results, together with our other correlation measures, suggest dynamic changes in the strength of the input to putamen MSNs during overtrained behavior, both from a common source (dopaminergic, cortical, thalamic, etc.) and/or recurrent connections and based on the valence. It further suggests a more efficient information transfer from the putamen compared with the caudate and VS during a well practiced task.
Possible confounding factors in the correlation analysis
Several factors may limit the interpretation of correlation analysis, and specifically JPSTH analysis. One such factor is the common activation of the neurons by an unmeasured event such as the motor-related responses of BG neurons (Ben Shaul et al., 2001; Arkadir et al., 2002). We found that MSN pairs in the putamen alone, but not in the caudate or VS, displayed dynamics along the main diagonal of the JPSTH. However, the licking and blinking behavioral responses were similar when recordings were obtained from either region. Furthermore, although putamen MSNs may have a strong motor component in their response, MSNs in the caudate have also been shown to encode motor components, especially orofacial and oculomotor movements (Hikosaka, 2007). Finally, we obtained similar results for TAN pairs, which displayed higher correlations in the putamen than in the caudate, but, unlike the MSNs, the TANs do not have a motor component in their response (Kimura et al., 1984; Morris et al., 2004).
Another confounding factor is related to trial-to-trial variability along the recording session that results from latency covariation, state excitability changes, and changes in the monkey's arousal, motivation, and other factors (Brody, 1999; Cohen and Newsome, 2008; Joshua et al., 2009). We cannot control for all of the possible factors to which the cells might respond. However, we compared the results of the correlation analysis across the three territories and the behavioral context did not differ. Moreover, recording from the VS was done simultaneously with that from the putamen. Therefore, external causes for the observed changes should have affected both the putamen and the VS.
Concluding remarks
In this study, we examined the functional connectivity of the striatal network using correlation methods. The correlation structure revealed here suggests how the striatal multiple controller system determines which mode of control is used. We have shown that in a well practiced behavior, the striatal network is organized such that interconnected subnetworks in the putamen encode behavioral events. Therefore the synchronized activity solely in the putamen enables it to efficiently convey information to downstream BG structures during overtrained, and possibly habitual, behavior.
Footnotes
Funding support was from a Select and Act FP7 grant. A.A. is supported by the Adams Fellowship Program of the Israel Academy of Sciences and Humanities. We thank Mati Joshua for critical reading of earlier versions of this manuscript.
- Correspondence should be addressed to Avital Adler, Department of Medical Neuroscience, The Hebrew University, Hadassah Medical School, POB 12272, Jerusalem 91120, Israel. avital.adler{at}gmail.com


