

Article Figures & Data
Figures
- Figure 1.
DRN recording methods. A, Schematic of conditioned approach task, in this case for a rat trained with C→X in house-light-on context (white ovals) and C→R in house light-off context (gray ovals). Vertical ticks represent trials within each context block, with one from each block expanded to show trial details. Black bar represents the cue, arrow marks solenoid activation on C→R trials, arrowheads symbolize licking. Broken timelines indicate random intervals (variable reaction time and/or randomized intertrial interval). B, PSTH and raster show mean and individual trial licking recorded during a C→R session. The cue period is indicated by gray shading, reward at 1 s. Raster lines ordered by time of first lick after fluid release. Data for the C→X block are not shown because only 1 lick was emitted. C, Atlas section shows target region, histological section shows position of electrode tips in DRN (red square, enlarged in inset) and cannula track damage (arrows) in one rat. D, Waveforms show averages from two spikes recorded from one electrode separated by cluster analysis of waveform shape. Color density plot shows cluster analysis of waveform principal components identifying two clusters representing the two waveforms. E, Histogram shows firing rate for the larger spike cell in D before and after administration of 8-OHDPAT (arrow).
- Figure 2.
PSTH and dot rasters illustrating typical phasic excitatory DRN responses to cue onset. A, Responses of a neuron recorded in a rat trained with house-light off (dark) in no-reward blocks (C→X) and house-light on (yellow shading) in reward blocks (C→R). Each line in dot rasters shows one trial, histogram shows average firing rate over whole block. Gray ghost on C→R PSTH shows outline of bins from the corresponding C→X PSTH. Bin width is at 1 ms, cue onset at time 0. B, Cell recorded in a rat trained in the opposite context-reward relationship (C→X in light). C, High-firing-rate cell showing complete selectivity for C→X. D, High-firing-rate cell with early and late response components. In C→R, the earlier component is slightly smaller but the later component is absent.
- Figure 3.
DRN neurons are preferentially activated by a nonreward cue. A, Grand mean population PSTH shows the average (± SEM) responses to cue onset (time 0) in C→X (red) and C→R (blue) contexts (5-bin running average, 1 ms original bin width) calculated from the individual PSTH of all cells showing excitation in at least one context. B, Scatterplot (log–log scales) compares modulation index in each context for all cells with excitation in both contexts. Dashed lines show ±20% variation from line of equality (solid), dividing cells into those in which response modulation index was >20% larger in C→X than C→R (red) or vice versa (blue). C, Pie chart illustrating the proportions of cells showing either an excitation in only the C→X (orange) or C→R (cyan) context (completely selective) or responses in both contexts, but bigger modulation index in C→X (red) or C→R (blue) (partially selective). D, Quantification (mean + SEM) of responses in cells showing excitation in both contexts. Left, Modulation index. Right, Modulation duration. ***p < 0.001.
- Figure 4.
Putative DA neurons show opposite selectivity for cues than most other DRN neurons. A, Presumed DA neuron. Top and bottom histograms (bin width, 5 ms) and rasters show responses of the same cell to cue onset (time “0”) in reward (C→R) and nonreward (C→X) contexts, respectively. Lines in top raster are ordered by reaction time, in bottom raster in order of occurrence, bottom to top. Gray ghosts on lower C→X histograms show outline of bins from the upper C→R histogram. This cell showed an early phasic response component in C→R that was lost in C→X, but retained a later component. B, Another presumed DA cell in which the cue response was replaced by an inhibition. C, Presumed non-DA neuron recorded simultaneously with the cell shown in B. Note shorter time scale and narrower bin width (2.5 ms) required to capture earlier onset latency in this cell compared with the putative DA neurons. Gray ghost on upper C→R histogram shows outline of bins from the lower C→X histogram. D–F, Response to apomorphine (APO) of cells shown in A–C, respectively. Animal handling for drug administration occurred during the blank period in the histogram. Calibration: inset (average waveforms), 1 ms in all cases.
- Figure 5.
Lick-related activity. A, Lick-synchronized neuron. Top raster and PSTH raster show activity of the neuron centered on time of first lick after solenoid activation (green dashed line). Raster lines show spikes on each trial, with trials ordered by reaction time (i.e., time from activation of solenoid to first subsequent lick). Large black dots mark time of solenoid activation and gray dots the time of cue offset. Bottom raster and PSTH show licking data from the same block. Vertical dashed lines are aligned to the center of the peaks in the lick PSTH. B, Neuron with complex relation licking. Top raster and PSTH show neural activity. Red and black raster lines indicate trials in which conditioned anticipatory licking did or did not occur, respectively, assessed from the lick data shown below. Separate red and black PSTHs were calculated from the respective trials. Skyline plots show the two PSTH overlaid at the same vertical scale. Inset, PSTHs each have optimized vertical scales. Arrow on lick raster indicates transition between trials with and without anticipatory licking.
- Figure 6.
Electrophysiological and pharmacological characteristics of DRN cells. A, Scatterplot (log–log axes) of post-8-OHDPAT rate as a percentage of the predrug rate against the predrug rate (100% indicating no change). Red and blue points indicate cells with >20% reduction in rate after 8-OHDPAT from a baseline rate of less or >20 Hz, respectively. Green points show cells excited >20% by 8-OHDPAT with a baseline rate <20 Hz. Gray points are cells with <20% change after 8-OHDPAT and black points are fast-firing, excited cells. B, Histogram showing mean + SEM firing rates before (hashed bars) and after (black bars) 8-OHDPAT for Groups 1–3. C, Waveform shape. Bar chart shows proportions of cells in each group exhibiting the different types of waveform. D, Histogram showing the mean + SEM peak-to-peak (P–P) durations of cells in each group pooled across the waveform shape. *p < 0.05 compared with Group 1. E, CV of interspike intervals for all cells in each group. *p < 0.05. F, percentage spikes in bursts. *p < 0.05.
- Figure 7.
Auto- and cross-correlation features. A, Autocorrelation from a Group 2 neuron. Extended reduced activity period after reference spike time (0) indicates rhythmic single spike mode firing (bin width, 1 ms). SIB, Spikes in bursts. B, Autocorrelation from a Group 3 neuron. Early peak after the reference spike time indicates rhythmic burst firing in this cell. C, Top histogram shows cross-correlation of two Group 1 cells. Calibration: inset (waveforms), 1 ms. Histograms below show autocorrelation functions for each cell (bin width, 5 ms in all histograms).
- Figure 8.
Population average normalized modulation indices for different groups (separated on basis of firing rate and response to 8-OHDPAT) calculated from PSTHs in all cells, including excited, inhibited, and nonresponsive cells. Black and gray lines show responses in C→X and C→R blocks, respectively. Group 1, Baseline firing rate <20 Hz, inhibited >20% by 8-OHDPAT. Group 2, baseline firing rate >20 Hz, inhibited >20% by 8-OHDPAT. Group 3, Baseline firing rate <20 Hz, excited > 20% by 8-OHDPAT.
- Figure 9.
Tonic changes in firing rate. A, Single neuron example. Histogram shows firing rate of a neuron in C→X blocks. Gray shading indicates duration of cue. “X” indicates that no solenoid activation occurs at this time in this context. B, Histogram for the same cell as in A from the C→R context. Solenoid activation (“R,” arrow) occurred 0.5 s after cue offset. C, Red line shows population average normalized modulation index (initial bin width, 1 ms smoothed with 25 bin running average) calculated from all cells with tonic elevation in the C→X context. Vertical axis has been scaled to the tonic component, severely truncating the phasic response. Blue line shows the average calculated for the same cells in the C→R context. D, As for C, but for cells with tonic inhibition in C→X. E, As for C, but for cells with excitation in C→R context. F, As for E, but for inhibitions. G, Population average baseline-normalized lick rates averaged across all recording blocks from which neural data were obtained. Dark blue and red lines show lick data from C→R and C→X blocks in graph C, respectively, and light blue and red lines show data from blocks in E. Note that red lines from C→X blocks are barely visible because they run along baseline. H, Lick data associated with neural data in D and F (conventions as in G).
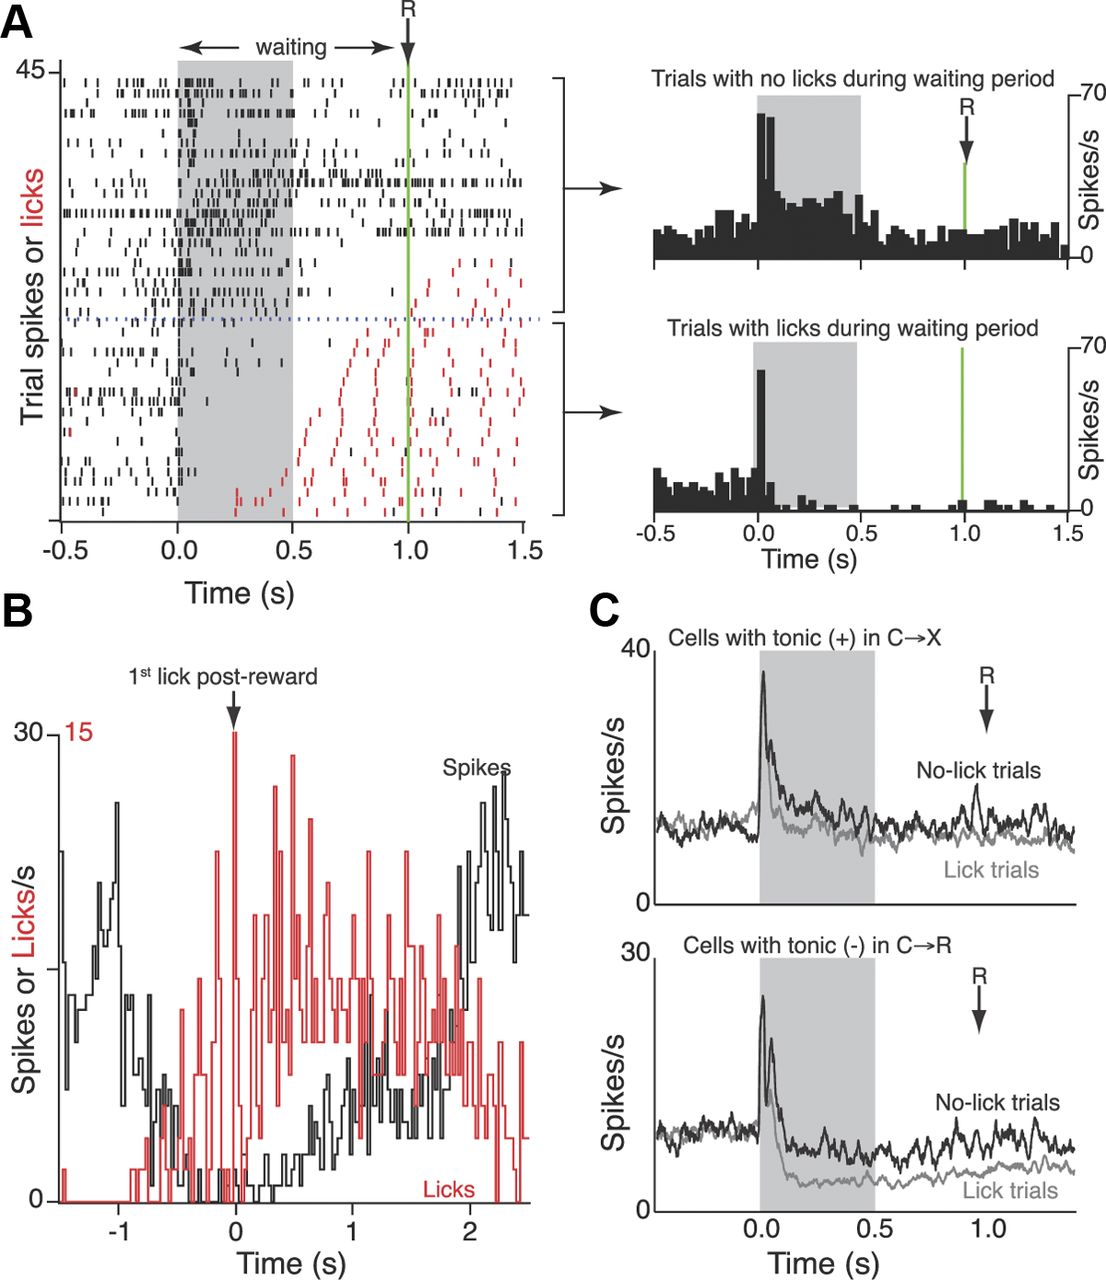
- Figure 10.
Within-block analysis of cells showing selective tonic modulation during the waiting period. A, Example cell. Dot raster shows all trials recorded from the C→R block. Black ticks show individual spikes on each trial, red ticks show lick events on the same trials. Trials ordered according to time of first lick after cue onset (time 0). Green line shows time of solenoid activation. Horizontal dashed blue line demarcates trials with licks (below) from trials with no licks during the waiting period (above). PSTH (25 ms bin) show average firing rate for the cell calculated from the respective subsets of trials. B, Skyline plots showing PSTH over all trials centered on the first lick after solenoid activation (time 0) for spike activity (black) and licking (red) from the same file as in A. Note that this alignment includes reward events that are beyond the x-axis range shown in A. C, Grand mean PSTH (25 ms running average, 1 ms original bin width) showing averages for C→R blocks calculated from trials with no licks (black) or licking (gray) during the waiting period, Top, Cells that overall (Fig. 9C) had a tonic excitation in C→X trials. Bottom, Cells (Fig. 9F) that overall had inhibition in C→R trials.


