

Abstract
Animals are thought to evaluate the desirability of action options using a unified scale that combines predicted benefits (“rewards”), costs, and the animal's internal motivational state. Midbrain dopamine neurons have long been associated with the reward part of this equation, but it is unclear whether these neurons also estimate the costs of taking an action. We studied the spiking activity of dopamine neurons in the substantia nigra pars compacta of monkeys (Macaca mulatta) during a reaching task in which the energetic costs incurred (friction loads) and the benefits gained (drops of food) were manipulated independently. Although the majority of dopamine neurons encoded the upcoming reward alone, a subset predicted net utility of a course of action by signaling the expected reward magnitude discounted by the invested cost in terms of physical effort. In addition, the tonic activity of some dopamine neurons was slowly reduced in conjunction with the accumulated trials, which is consistent with the hypothesized role for tonic dopamine in the invigoration or motivation of instrumental responding. The present results shed light on an often-hypothesized role for dopamine in the regulation of the balance in natural behaviors between the energy expended and the benefits gained, which could explain why dopamine disorders, such as Parkinson's disease, lead to a breakdown of that balance.
Introduction
An animal with foraging options weighs the costs and benefits predicted for each alternative and chooses the one that maximizes the net payoff (Hull, 1943; Bautista et al., 2001; Stevens et al., 2005). Behaviors like this suggest the presence of a brain mechanism that integrates information concerning predicted energetic costs and rewards, which allows for the evaluation of action options in a common utility space (Kording et al., 2004; Glimcher et al., 2005; Niv, 2007; Niv et al., 2007; Phillips et al., 2007). Although considerable evidence implicates midbrain dopamine neurons in valuation-related aspects of decision-making (Wise, 2004; Schultz, 2006) and in modulating the performance of reward-seeking behaviors (Salamone and Correa, 2002; Bromberg-Martin et al., 2010), emerging evidence suggests that dopamine is also a key component of the neural circuits that anticipate and regulate the effort required to obtain a reward (Salamone and Correa, 2002; Phillips et al., 2007; Salamone et al., 2007; Day et al., 2010). For example, dopamine depletion or antagonism causes animals to choose actions that require less effort but are also less rewarding (Cousins and Salamone, 1994; Denk et al., 2005). In addition, the loss of dopamine signaling differentially impairs instrumental responses that require large energy expenditures (Aberman and Salamone, 1999; Salamone et al., 2001). Thus, we hypothesized that the spiking activity of dopamine neurons integrates the expected rewards and the anticipated energetic demands of upcoming actions.
In economic behavior, the overall desirability of an option can be quantified and compared with others via a utility function (Glimcher et al., 2005; Phillips et al., 2007; Pine et al., 2009; Prevost et al., 2010). To characterize the nature of cost discounting on the value of future reward in a cost–benefit context, utility is typically estimated using a hyperbolic function (Kobayashi and Schultz, 2008; Prevost et al., 2010), which can be expressed as follows:
 where α is a discount factor that reflects an individual animal's sensitivity to the cost of effort. To test whether dopamine neurons encode this sort of utility signal, we conditioned two monkeys to perform a reaching task in which we independently manipulated both movement incentive and effort (Fig. 1). To test whether dopamine neurons encode information regarding task utility or effort, we first estimated the devaluing effect of effort on reward value (α) based on each animal's behavioral performance. We then recorded from presumptive dopamine neurons in the substantia nigra pars compacta (henceforth referred to as dopamine neurons). In a limited subset of dopamine neurons, we found that the phasic encoding of anticipated reward volume was attenuated in proportion to the anticipated energetic cost, which is consistent with an encoding of net utility. In addition, we found that the tonic activity of some dopamine neurons declined slowly across a recording session, possibly representing a signal related to the vigor of instrumental performance. Thus, these results elucidate the often-hypothesized role for midbrain dopamine neurons in regulating the balance in natural behaviors between the energy expended and the benefits gained.

The effort–benefit reaching task and localization of the substantia nigra. A, Torquable exoskeleton used to simulate kinetic friction loads opposing movement of the monkey's hand. Targets, cursor (reflecting hand position), and instruction cues were displayed on a computer monitor and made visible as virtual images in the workspace via a half-silvered mirror. B, The results from one parasagittal plane of electrophysiological mapping superimposed over the corresponding structural MRI from Monkey C. Neurons of the substantia nigra pars compacta (red) and other brain structures were localized along parallel recording tracks according to their neurophysiological characteristics and locations. Green represents caudate; blue, thalamus; purple, subthalamic nucleus; yellow, substantia nigra pars reticulata. C, A timeline of the standard instrumental paradigm. A visual instruction cue was presented briefly after the animal moved the hand-controlled cursor (+) to the start position (gray circle). After random delays, a target was presented (second gray circle), and then the start position was extinguished (Go signal), at which time the animal was required to move the cursor to the target position. To manipulate effort, friction loads opposed the movement of the hand to the target (yellow). Inset, Nine unique instruction cues were associated with different levels of effort (low, medium, or high) and reward.
Materials and Methods
Apparatus.
Procedures were approved by the Institutional Animal Care and Use Committee and complied with the Public Health Service Policy on the humane care and use of laboratory animals. Two rhesus monkeys (Monkey C, 8 kg, male; and Monkey H, 6 kg, female) were trained to execute reaching movements with the left arm using a 2D torquable exoskeleton (KINARM, BKIN Technologies; Fig. 1A). Visual targets and cursor feedback of hand position were presented in the horizontal plane of the task by a virtual-reality system. Distinct force levels were applied at the shoulder and elbow joints by two computer-controlled torque motors so as to simulate kinetic friction loads opposing movement of the hand. The force was constant for any hand movement above a low threshold velocity (0.5 cm/s) and directly opposed the direction of movement. After 6 or more months of training, both monkeys performed movements with consistent trajectories and velocity profiles under all load conditions. A plastic recording chamber (custom-machined PEEK, 28 × 20 mm) and head holder were fixed to the skull under general anesthesia and sterile conditions. The MRI-compatible chamber was positioned in the sagittal plane with an anterior-to-posterior angle of 20° (Fig. 1B).
Effort–benefit reaching task.
On each behavioral trial, the animal was required to align the cursor with two visual targets (radius, 1.8 cm) displayed in succession. A trial began when a target appeared at the start position, and the monkey made the appropriate joint movements to align the cursor with this target (Fig. 1C). The monkey maintained this position for a random-duration hold period (2.9–5.1 s) during which: (1) an instruction cue was displayed at the start position (0.7–1.3 s after hold period start, 0.5 s duration), and (2) the peripheral target was displayed (0.7–1.3 s after offset of the instruction cue, at the same location for all trials, 7.5 cm distal to the start position). At the end of the start position hold period, the start position target disappeared, thereby cueing the animal to move the cursor to the peripheral target (within <0.8 s) to obtain a food reward. Movement of the arm to capture the peripheral target required coordinated flexion at the shoulder and extension at the elbow in the horizontal plane. For the instruction cues, symbols indicated the level of upcoming force that the animal would encounter (0, 1.8, or 3.2 N) and cue colors indicated the size of reward (1, 2, and 3 drops of food; Fig. 1C). Cue colors were calibrated to have the same physical brightness (∼30 cd/m2). The nine unique cue types (3 force levels × 3 reward sizes) were presented in pseudo-random order across trials with equal probability. Each drop of reward (a puree of fresh fruits and protein biscuits) was delivered as a perceptibly independent bolus via a sipper tube attached to a computer-controlled peristaltic pump (1 drop = ∼0.5 ml, 0.5 s between successive drops). The trials were separated by 1.5–2.5 s intertrial intervals, during which the screen was black. In addition, free rewards were delivered during the intertrial interval after 5% of trials, selected at random.
Errors in task performance were categorized according to the specific task requirement not fulfilled: (1) the monkey had to maintain the cursor in the start position during the hold period (radius, 1.8 cm); (2) when the peripheral target was displayed, the animal was not allowed to move the cursor before go-signal; (3) only direct (approximately linear) movement trajectories were allowed between the start position and the peripheral target; (4) a response time (reaction time + movement duration) of <0.8 s was required; and (5) movement offset was required to be in the target zone (radius, 1.8 cm). When any one of these rules was broken, the error was followed by a blank screen (2 s), an intertrial interval, and the error trial was presented to the animal again as one of the next five trials (selected at random). Thus, this paradigm penalized animals for voluntarily abandoning trials (e.g., those promising high cost and low reward), and animals were obliged to complete high-cost low-reward trials successfully in order for the task to proceed to other trial types.
Decision task.
The overall structure of this task was similar to the reaching task except as follows. Two instruction cues were presented simultaneously immediately to the left and right of the start position target, thereby indicating two alternate force/reward combinations from which the animal can choose. The monkey was allowed to choose freely between the two propositions by moving the cursor laterally to one cue and then returning the cursor to the start position. Thereafter, a decision trial unfolded exactly like a single-cue trial, except that the friction force encountered during reaching and the size of the reward were governed by the chosen cue. The pair of cues presented on a single trial differed only along one dimension, presenting either an effort-based decision (different symbols but the same color) or a reward-based decision (different colors but the same symbol). The decision task used a total of 12 possible cue combinations (2 cue dimensions × 3 levels × 2 locations), which were presented in pseudo-random order across trials.
The animals were trained on both effort–benefit and choice tasks for ≥6 months (>1000 trials per day during ≥125 d) before the start of data collection. During the data collection period, monkeys were trained on the decision task approximately once per week. Regular training on this task reduced the likelihood of drifts in the animal's internal representation of cue values. Neuronal data were not collected during performance of the decision task.
Localization of the recording site.
The anatomical location of the substantia nigra and proper positioning of the recording chamber to access it were estimated from structural MRI scans (Siemens 3 T Allegra Scanner, voxel size of 0.6 mm). An interactive 3D software system (Cicerone) was used to visualize MRI images, define the target location, and predict trajectories for microelectrode penetrations (Miocinovic et al., 2007). By aligning microelectrode mapping results (electrophysiologically characterized x, y, z locations) with structural MRI images and high-resolution 3D templates of individual nuclei derived from an atlas (Martin and Bowden, 1996), we were able to gauge the accuracy of individual microelectrode penetrations and determine chamber coordinates for the substantia nigra pars compacta (Fig. 1B).
Recording and data acquisition.
During recording sessions, a glass-coated tungsten microelectrode (impedance, 0.7–1 MOhm measured at 1000 Hz) was advanced into the target nucleus using a hydraulic manipulator (MO-95, Narishige). Neuronal signals were amplified with a gain of 10K, bandpass filtered (0.3–10 kHz), and continuously sampled at 25 kHz (RZ2, Tucker-Davis Technologies). Individual spikes were sorted using Plexon off-line sorting software (Plexon). The timing of detected spikes and of relevant task events was sampled digitally at 1 kHz. Dopamine neurons were identified according to the following standard criteria: (1) location within the SNc (Fig. 1B), (2) polyphasic extracellular waveforms, (3) low tonic irregular spontaneous firing rates (0.5–8 spikes/s), (4) long duration of action potentials (>1.5 ms), and (5) phasic responses to unexpected events (Hollerman and Schultz, 1998).
Analysis of behavioral data.
Kinematic data (digitized at 1 kHz) derived from the exoskeleton were numerically filtered and combined to obtain position, and tangential velocity and acceleration. The time of movement onset was determined as the point at which tangential velocity crossed an empirically derived threshold (0.2 cm/s). Reaction times (RTs: interval between go signal and movement onset), movement durations (MDs: interval between movement onset and capture of the target), peak velocity (maximum tangential velocity), and initial acceleration (determined during the first 40 ms of the movement to avoid influences of the loads) were computed for each trial. Two-way ANOVAs were used to test these kinematic measures for interacting effects of incentive reward and effort. In the present study, the utility function was defined as a devaluation of reward magnitude by effort as follows:
 where α is a discount factor that reflects an individual animal's sensitivity to the cost of effort. We used a hyperbolic function to model the discounting effects of cost on reward values because it has been shown previously to offer the best account of cost discounting in both monkeys and humans (Kobayashi and Schultz, 2008; Prevost et al., 2010). In the present study, very similar results were obtained using an exponential-like utility model defined as follows: Utility(α) = Reward exp(−α Effort). The same levels of benefit (Reward = 1, 2, or 3) and cost (Effort = 0, 1.8, or 3.2) were used with both monkeys. In many situations, movement kinematics are modulated by a task's incentive value: higher motivational states elicit behavioral responses with shorter durations, exhibiting higher velocities (Niv et al., 2007; Shadmehr et al., 2010). We reasoned that an animal's performance in the behavioral task, as measured by RT, MD, velocity max, acceleration, and error rate, would be modulated monotonically according to the animal's judgment of the trial's net utility. Based on that logic, we estimated a discount factor (α) separately for each behavioral variable (averaged across all sessions) by finding a value for α that maximized linear relationships between performance (i.e., RT, MD, velocity, acceleration, and error rate) and utility. To be specific, the MATLAB function “fminsearch” (MathWorks) was used to find the best discount factor α that provided the maximum-likelihood fit between behavioral parameter and task utility (Eq. 1). Goodness of fit was evaluated by the coefficient of determination (R2).
To examine potential effects of time on task performance and neuronal activity, we developed a measure T that reflected the accumulated trials across a recording session. For this analysis, data from each session were divided and averaged into consecutive deciles relative to the total number of trials in a session. One or two recording sessions were performed per day, and the total number of trials (259 ± 7, mean ± SEM) differed between sessions. Thus, this method of time normalization allowed us to combine results across recording sessions and to test for slow changes in motor performance while minimizing the trial-by-trial influence of other task parameters (e.g., reward and effort levels). We used a one-way ANOVA to test for behavioral changes as a function of T.
Neuronal data analysis.
Neuronal recordings were accepted for analysis based on electrode location, recording quality (signal/noise ratio of ≥ 3 SD) and duration (>200 trials). The stability of single-unit isolation was quantified across the recording session by comparing (1) signal-to-noise ratios and (2) measures of action potential shape (duration and magnitude) for early (first 500 spikes) and late (last 500 spikes) recording epochs. In the calculation of signal-to-noise ratios, the noise was defined as the SD of voltages measured at 0.2 ms before the initial action potential inflection, and the signal corresponded to the mean magnitude of the sorted action potentials (difference between maxima and minima of the biphasic spike waveforms). The duration of action potential waveforms was calculated as the interval from the beginning of the first negative inflection (>2 SD) to the succeeding positive peak. Trials with errors were excluded from the analysis of neuronal data. For each cue presentation, continuous neuronal activation functions (spike density functions [SDFs]) were generated by convolving each discriminated action potential with a Gaussian kernel (20 ms variance). Mean peri-instruction SDFs (averaged across trials) for each of the nine instructions were constructed. The instruction control activity was computed as the mean firing rate during the 500 ms epoch preceding the cue. Responses to the instruction cue were detected in individual SDFs by comparing mean firing rates between the postinstruction epoch (100–400 ms) and the control period using a t test (p < 0.01).
For neurons that had a significant cue-evoked response, we first performed a single-neuron-based analysis. Mean SDFs for each of the nine trial types were searched independently, and the point of largest deviation across all trial types was taken as the time of the neuron's instruction-related response. Single trial spike counts (SCs) were extracted from a 100 ms window centered on the time of the maximal response. Two-way ANOVAs were used to test whether these cue-evoked SCs were influenced by: (1) reward, (2) effort, or (3) the additive effects of reward and effort. The ANOVA also identified any interacting effects of reward and effort. The threshold for significance (p < 0.05) was validated by calculating the likelihood of Type 1 (false-positive) errors in a parallel analysis of activity during 100 ms windows during the preinstruction control epoch (i.e., during a time period when there should be no neuronal encoding of reward or effort).
Then, to test whether a neuron that encoded reward and/or effort, according to the ANOVA, did so in a way that correlated with a utility model (as expressed by Eq. 1), we fit cue-evoked neuronal responses obtained for each of the nine trial types to the following hyperbolic formula:
 where Y is the mean discharge rate measured during the nine types of instruction-related responses (extracted from a 100 ms window in SDFs), Reward and Effort are the levels of benefit (1, 2, or 3) and cost (0, 1.8, or 3.2), C is a constant term that corresponds to baseline activity, and α is a discount factor that reflects the neuronal sensitivity to the cost of effort. The discount factor was estimated separately for each neuron by finding a value for α that maximized linear relationships between cue-evoked responses and the hyperbola-like function. Goodness of fit was evaluated by the coefficient of determination (R2) using the least-squares method. To estimate the significance of the best-fit discount factor, we performed a permutation test by shuffling trials across effort levels (1000 times) and compared the actual discount factor to the 99% confidence interval of factors yielded by shuffling.
In addition, to test whether a neuron's activity was modulated by the accumulated trials (T), a linear regression model was applied to the SC as follows:
 where SCi is the number of spikes for the ith time bin that is extracted from a 100 ms window centered either on the time of the maximal response for neurons with significant cue-evoked response, or 200 ms after cue presentation for cue nonresponding neurons. β0∼1 denotes the regression coefficients.
Second, we performed population-based analyses using mean peri-instruction SDFs. For neurons that were found to encode effort and/or reward (according to the ANOVA), we tested the relative efficiency of our utility model (as expressed by Eq. 2) by comparing the residual sum of squares obtained using the hyperbola-like formula (RSSutility) with residual sum of squares issued from another model dependent of reward values only (i.e., with a discount factor equal to 0 in Eq. 2; RSSrew). The model that yielded the smaller RSS value was taken as the preferred model. RSS differences (RSSrew − RSSutility) were compared between different subsets of neurons using a Wilcoxon test. For population-based figures, neural responses were standardized between neurons (Z-scored) by subtracting the mean activity and then dividing by the SD.
We then examined the timing of encoding of task-related information by neurons using a sliding window procedure. For each neuron, we counted spikes in a 200 ms test window that was stepped in 25 ms increments from −500 ms to +1500 ms relative to cue onset. For each step, a multiple linear regression was completed with SC as the dependent variable. We simultaneously tested whether the neuronal activity was modulated according to task parameters [reward (Rew), effort and interaction (reward × effort)], the accumulated trials (time), and detrended measures of performance (reaction time, maximum velocity, and initial acceleration) to control for possible relationships of SC with movement execution. The detrending procedure subtracted the best-fit linear trend as a function of time from each measure of performance. In this way, the multiple linear regression analysis tested for relationships of neural activity to the trial-to-trial variations in motor performance that were independent of slow changes in performance with the passage of time (T). To be specific, we used the equation as follows:
 where all variables for the ith trial were normalized to obtain standardized regression coefficients. To test whether individual regression coefficients (β0∼7) were significant, we shuffled SCs across trials repeatedly (1000 times) and compared actual regression coefficients to the 95% confidence interval of coefficients yielded by shuffling. An actual regression coefficient was deemed significant if its value fell outside of the shuffled coefficient's 95% confidence interval. To quantify how strongly neuronal activity was influenced by regressors, we used the coefficient of partial determination. The coefficient of partial determination for the nth regressor Xn is defined as the following:
 where SSE(X) referred to the sum of squared errors in the regression model that includes a set of regressors X, and X-n a set of all the regressors included in the model except regressor Xn. This regression analysis tested for linear relationships and interactions (e.g., for Rewi × Efforti), whereas the two-way ANOVA described earlier was model-free (i.e., it imposed no a priori assumptions about how the effects of reward and effort may be combined). Thus, results from the two analyses were not guaranteed to be identical.
Results
Behavioral performance
The nine conditioned stimuli presented during the reaching task effectively communicated nine different levels of motivational value as evidenced by consistent effects on the animals' task performance (Fig. 2). Reaction times, error rates, and kinematic measures were affected by both the expected reward magnitude (reaction times, F > 11.65, p < 0.001; error rates, F > 14.54, p < 0.001; movement durations, F > 11.04, p < 0.001; initial accelerations, F > 18.22, p < 0.001; maximum velocities, F > 22.05, p < 0.001) and effort (reaction times, F > 10.75, p < 0.001; error rates, F > 9.48, p < 0.001; movement durations, F > 40.44, p < 0.001; initial accelerations, F > 34.04, p < 0.001; maximum velocities, F > 83.62, p < 0.001). To summarize these results, movements were faster and more accurate for trials that promised large benefits and low efforts. Table 1 shows that both effort and reward task factors had a strong influence on task performance in the majority of individual recording sessions. Taking into account all behavioral measures (Table 1, last column), the task performance of Monkey H was influenced more consistently by different levels of anticipated effort than by rewards (χ2 = 8.09, p = 0.004, χ2 test), whereas performance of Monkey C was affected equally by both reward and force levels (χ2 = 3.24, p = 0.07).

Modulation of task performance according to effort/reward combinations. Measures of performance were averaged (mean ± SEM) separately for each effort/reward combination across all recorded sessions (81 and 26 sessions for Monkey C and Monkey H, respectively). Behavioral measures were affected by both expected reward value and force level. ***p < 0.001 (two-way ANOVA). β indicates the standardized regression coefficients obtained for each parameter across all recorded sessions. Separate lines indicate high (black), medium (dark gray), and low (light gray) force levels.
Sessions in which the task performance of an animal was influenced by effort/reward combinationsa
To confirm the ability of our animals to recognize and evaluate appropriately the different force/reward combinations signaled in the task, the animals also performed a variant of the task that required decision making. In this variant, the monkey was allowed to choose freely between two alternate force/reward options. We observed appropriately strong preferences for the cues that predicted large rewards and low forces. Monkeys selected the more advantageous option in terms of reward when the effort levels were equal (Monkey C, 99%, t(16) = 30.55, p < 0.001; Monkey H, 97%, t(14) = 26.99, p < 0.001) and the more advantageous effort option when reward sizes were held constant (Monkey C, 78%; t(16) = 9.75, p < 0.001; Monkey H, 72%, t(14) = 8.59, p < 0.001).
Estimation of task utility
Under the assumption that behavioral performance is modulated monotonically according to an animal's judgment of a trial's net utility (Kording et al., 2004; Niv, 2007; Niv et al., 2007; Shadmehr et al., 2010), we estimated utility (as expressed by Eq. 1) by finding the value for α that was most effective at linearizing the performance–utility relationship. To be more specific, we estimated the effort discount factor (α) by finding the value for α that maximized the linear fit between task performance and utility (Fig. 3). This procedure was performed separately for each measure of performance averaged across sessions (81 sessions for Monkey C and 26 sessions for Monkey H). As expected, the hyperbola-like utility model approximated the animals' task performance well for the majority of behavioral measures (p < 0.05 and R2 > 0.5, linear regression), with the exception of maximum velocities in Monkey C (p = 0.49 and R2 = 0.16). Notably, the resulting discount factors (α) were larger for the smaller and weaker of the two animals (i.e., Monkey H), reflecting a higher sensitivity to the cost of effort.

Modulation of task performance according to net utility. For each behavioral measure, an effort discount factor (α) was found that yielded the best linear fit between measures of task performance averaged across sessions (mean ± SEM) and the utility scale. Goodness of fit is furnished for each variable (R2 and p value). The colors of individual symbols indicate the reward size and effort levels in accordance with the color scheme used in Figure 2.
Responses of dopamine neurons to conditioned stimuli
While the monkeys performed the cost–benefit reaching task, we recorded single-unit activity from 107 putative dopamine neurons in the substantia nigra pars compacta (Fig. 1B). Similar to previous studies (Hollerman and Schultz, 1998; Fiorillo et al., 2003; Tobler et al., 2005), dopamine neurons were identified based on location, standard electrophysiological criteria, and responsiveness to unexpected events. After the presentation of informative cues, most dopamine neurons (78%, 83 of 107; Fig. 4) emitted a phasic increase in discharge above the baseline firing rate (p < 0.01, t test). No neurons showed a significant decrease in mean firing rate during this period. In 50% (53 of 107) of the dopamine neurons, the magnitude of the cue-evoked responses varied according to the cue type (p < 0.05, two-way ANOVA; Fig. 4A). In Figure 5, we show the spiking activity of two dopamine neurons for different cue types. The response magnitudes scaled monotonically with reward quantity (F > 31.03, p < 0.01) such that cue-evoked responses were maximal for the stimuli that predicted a high level of reward (Tukey–Kramer post hoc comparison; Fig. 5A). Consistent with the basic predictions of reinforcement theory (Sutton and Barto, 1998) and previous observations (Schultz et al., 1997), dopamine neurons coded the value of future rewards in their responses to conditioned reward-predicting stimuli. Further examination revealed that the responses illustrated in Figure 5E were also influenced by the level of effort that was predicted by a cue (F(2,30) = 3.87, p = 0.019). Notably, response magnitudes decreased with the prediction that an increased expenditure of effort would be necessary to obtain the same amount of reward, which suggests that this modulation of neuronal activity reflects a valuation signal. Potentially confounding factors, such as arousal, attentional engagement, and motor planning, would be reflected by increased firing rates for higher effort levels (Roesch and Olson, 2007). Paralleling predictions of the utility concept, the dopamine neuron responses illustrated in Figure 5E were influenced in opposite directions by the predicted reward value and the energetic cost required to obtain the reward.

Different subgroups of dopamine neurons. A, Distribution of neurons after their type of cue-evoked response. Task-dependent responses could be modified by the reward value, the effort level, or both parameters (reward/effort-encoding). B, Topography of recordings in the substantia nigra. Two- and three-dimensional plots of cell distribution (coordinates are based on recording chamber). The light red ellipsoid volumes represent the central 95% of the cell distribution for reward/effort-encoding neurons (i.e., utility-encoding neurons). No significant differences were found in the locations of different neuronal subtypes.

Responses of dopamine neurons to instructional cues. A, E, The activity of two exemplar neurons that were classified as (A) reward encoding and (E) utility encoding. Spike density functions and rasters were constructed separately around the presentation of the instruction cues that indicated three different reward sizes (left to right: 1, 2, and 3 drops) and three different effort levels (top to bottom: 3.2-N, 1.8-N, and 0-N). B, F, The population-averaged activities of the neurons that (B) only encoded reward value or (F) net utility. Spike density functions are grouped according to the predicted reward size (green represents low; blue, medium; red, high), and the predicted effort level is indicated by color saturation (dark, 3.2-N; intermediate, 1.8-N; light, 0-N). C, G, The magnitudes of the cue-evoked responses (the mean firing rates across a 100 ms after instruction window normalized by subtracting the baseline firing rate). ***p < 0.001 between the reward sizes. #p < 0.05 between the load sizes. D, H, Normalized mean ± SEM response magnitudes plotted as a function of an instruction cue's net utility as defined separately for each neuron (Eq. 2). To standardize data between neurons, Z-score was calculated by subtracting the mean firing rates across a 100 ms after instruction window and dividing by the SD. Insets, Distributions of differences of residual sum of squares obtained for neurons by fitting cue-evoked responses with the utility-like model (RSSutility) and a reward-alone model (i.e., with a effort discount factor equals to zero; RSSrew).
Coding of expected reward and net utility
We used two-way ANOVAs to identify dopamine cue-evoked responses that encoded the predicted reward, effort, or both parameters additively (p < 0.05; Table 2). For each neuron sensitive to reward and/or effort, we then investigated whether our utility model (see Eq. 2) fit those responses well. Although most studies have characterized dopamine neurons as a functionally homogeneous group (Schultz, 2006), we identified distinct anatomically intermixed classes of neurons (Fig. 4B). No difference was observed in the locations of the different subtypes of neurons in either animal (95% of the cell distributions overlapped).
Subgroups of encoding neuronsa
The first population encoded reward value alone (n = 39, Fig. 5B–D) such that the phasic cue-evoked activations scaled monotonically with reward quantity (population-level analysis: F(2,39) = 69.03, p < 0.001) but showed no effect of anticipated effort (F(2,39) = 0.12, p = 0.94). Notably, the value of anticipated reward was not encoded linearly (Fig. 5C). Responses to cues predicting large- versus intermediate-sized rewards differed in magnitude by a factor of 2.5 relative to the difference in magnitude for cues predicting intermediate- versus small-sized rewards, thus indicating an increased estimation of the best possible reward value available in the task. A small subset of dopamine neurons (n = 2 of 107) encoded effort levels alone (p < 0.05, two-way ANOVA), although this rate of incidence was not significantly >0 (i.e., than no neurons encoded effort; χ2 = 0.27, p = 0.6, χ2 test). Thus, expected task effort, by itself, had a negligible influence on the cue-evoked responses of DA neurons.
A third subset of neurons (n = 12) encoded both reward and effort (p < 0.05, two-way ANOVA, Table 2; Figs. 5F–H). Notably, all of the significant reward-by-effort interactions detected by the ANOVA (n = 8, Table 2) were found within this reward and effort encoding subset of neurons. The number of cells in this subset (11% of 107) was significantly greater than chance (χ2 = 9.16, p = 0.002, χ2 test). In this population, the positive scaling of response magnitude with reward (F(2,12) = 25.7, p < 0.001; Fig. 5G) was discounted by the predicted physical effort (F(2,12) = 7.39, p = 0.041). Inspection of population means for these neurons (Fig. 5G) suggested that the discounting effect of effort was greater for larger expected rewards than for smaller rewards, although this interaction was not significant according to the population-level analysis (F(4,12) = 1.52, p = 0.62).
To explore this combined encoding of reward and effort further, we tested the fit of each neuron's cue-evoked responses to our utility model in which the discount factor (i.e., the neuronal sensitivity to the cost of effort) was estimated by finding a value for α that maximized the linear relationships between response magnitude and the hyperbola-like function (Eq. 2). Every neuron identified by ANOVA to encode both reward and effort (n = 12 of 12) also showed a significant effort discount factor (α = 0.13 ± 0.02; p < 0.01, permutation test across trials with distinct effort levels). The cue-evoked responses of this population of “utility-encoding” neurons were well explained by the utility model (R2 > 0.71 and p < 0.005, linear regression; Fig. 5H). This result for the utility-encoding population contrasted sharply with the subset of neurons that encoded reward alone (Fig. 5D) for which the residual sum of squares were not different between models (i.e., between RSSutility yielded by the utility model versus RSSrew from a model of reward alone; p = 0.53, Wilcoxon test). The difference in residual sum of squares (RSSrew − RSSutility) was significantly larger for the utility-encoding population of neurons than the reward-encoding population (p = 0.003, Wilcoxon test; compare histograms inset in Fig. 5D,H), further suggesting the presence of distinct classes of dopamine cells.
Controls for potential confounds
We considered the possibility that the apparent discounting effects of effort on dopamine activity described above could be attributed to an altered motivational state within those specific recording sessions. To address this point, we compared behavioral measures (i.e., RT, MD, velocity, acceleration, and error rate) between the sessions in which we identified utility- and reward-encoding dopamine neurons. To be specific, regression coefficients (βreward and βeffort for each of the five behavioral measures vs different levels of reward and effort) were first calculated independently for each recording session and then compared between sessions for each animal (for Monkey C: 9 utility sessions vs 27 reward sessions; for Monkey H: 3 utility sessions vs 12 reward sessions). None of the coefficients differed significantly between sessions in which utility-encoding neurons and reward-encoding neurons was identified (p > 0.05, Wilcoxon test), thus failing to support the concept that the different types of neural encoding could be explained by session-by-session variability in the animals' motivational state.
We know from previous work that the dopamine response to a sensory cue is modulated by any information signaled by the cue about the temporal delay to reward (Roesch et al., 2007; Fiorillo et al., 2008; Kobayashi and Schultz, 2008) or the probability of reward (Fiorillo et al., 2003; Morris et al., 2006). Thus, it was important for us to consider the possibility that the apparent discounting effects of effort described above arose from underlying biases across conditions in temporal delays or reward probabilities. Although our behavioral task was designed to minimize such between-condition differences, it was still possible that condition-related variations in an animal's behavior (i.e., in reaction times, movement durations, or error rates) introduced systematic biases. To address this possibility, we first compared across task conditions the actual delays that the animals experienced over the many-month period of data collection (Fig. 6A). Temporal delays to reward did not differ significantly between the three levels of effort for either animal (F < 2.23, p > 0.11, two-way ANOVA). Therefore, systematic variations in the delay to reward cannot account for the observed correlation of dopamine neuron activity with movement effort (Fig. 5G). In Monkey C, there was a small (45 ms) but consistent variation in temporal delay to reward across the different reward sizes (F(2,81) = 13.46, p < 0.001), but that effect was irrelevant to the question of neuronal encoding of movement costs.
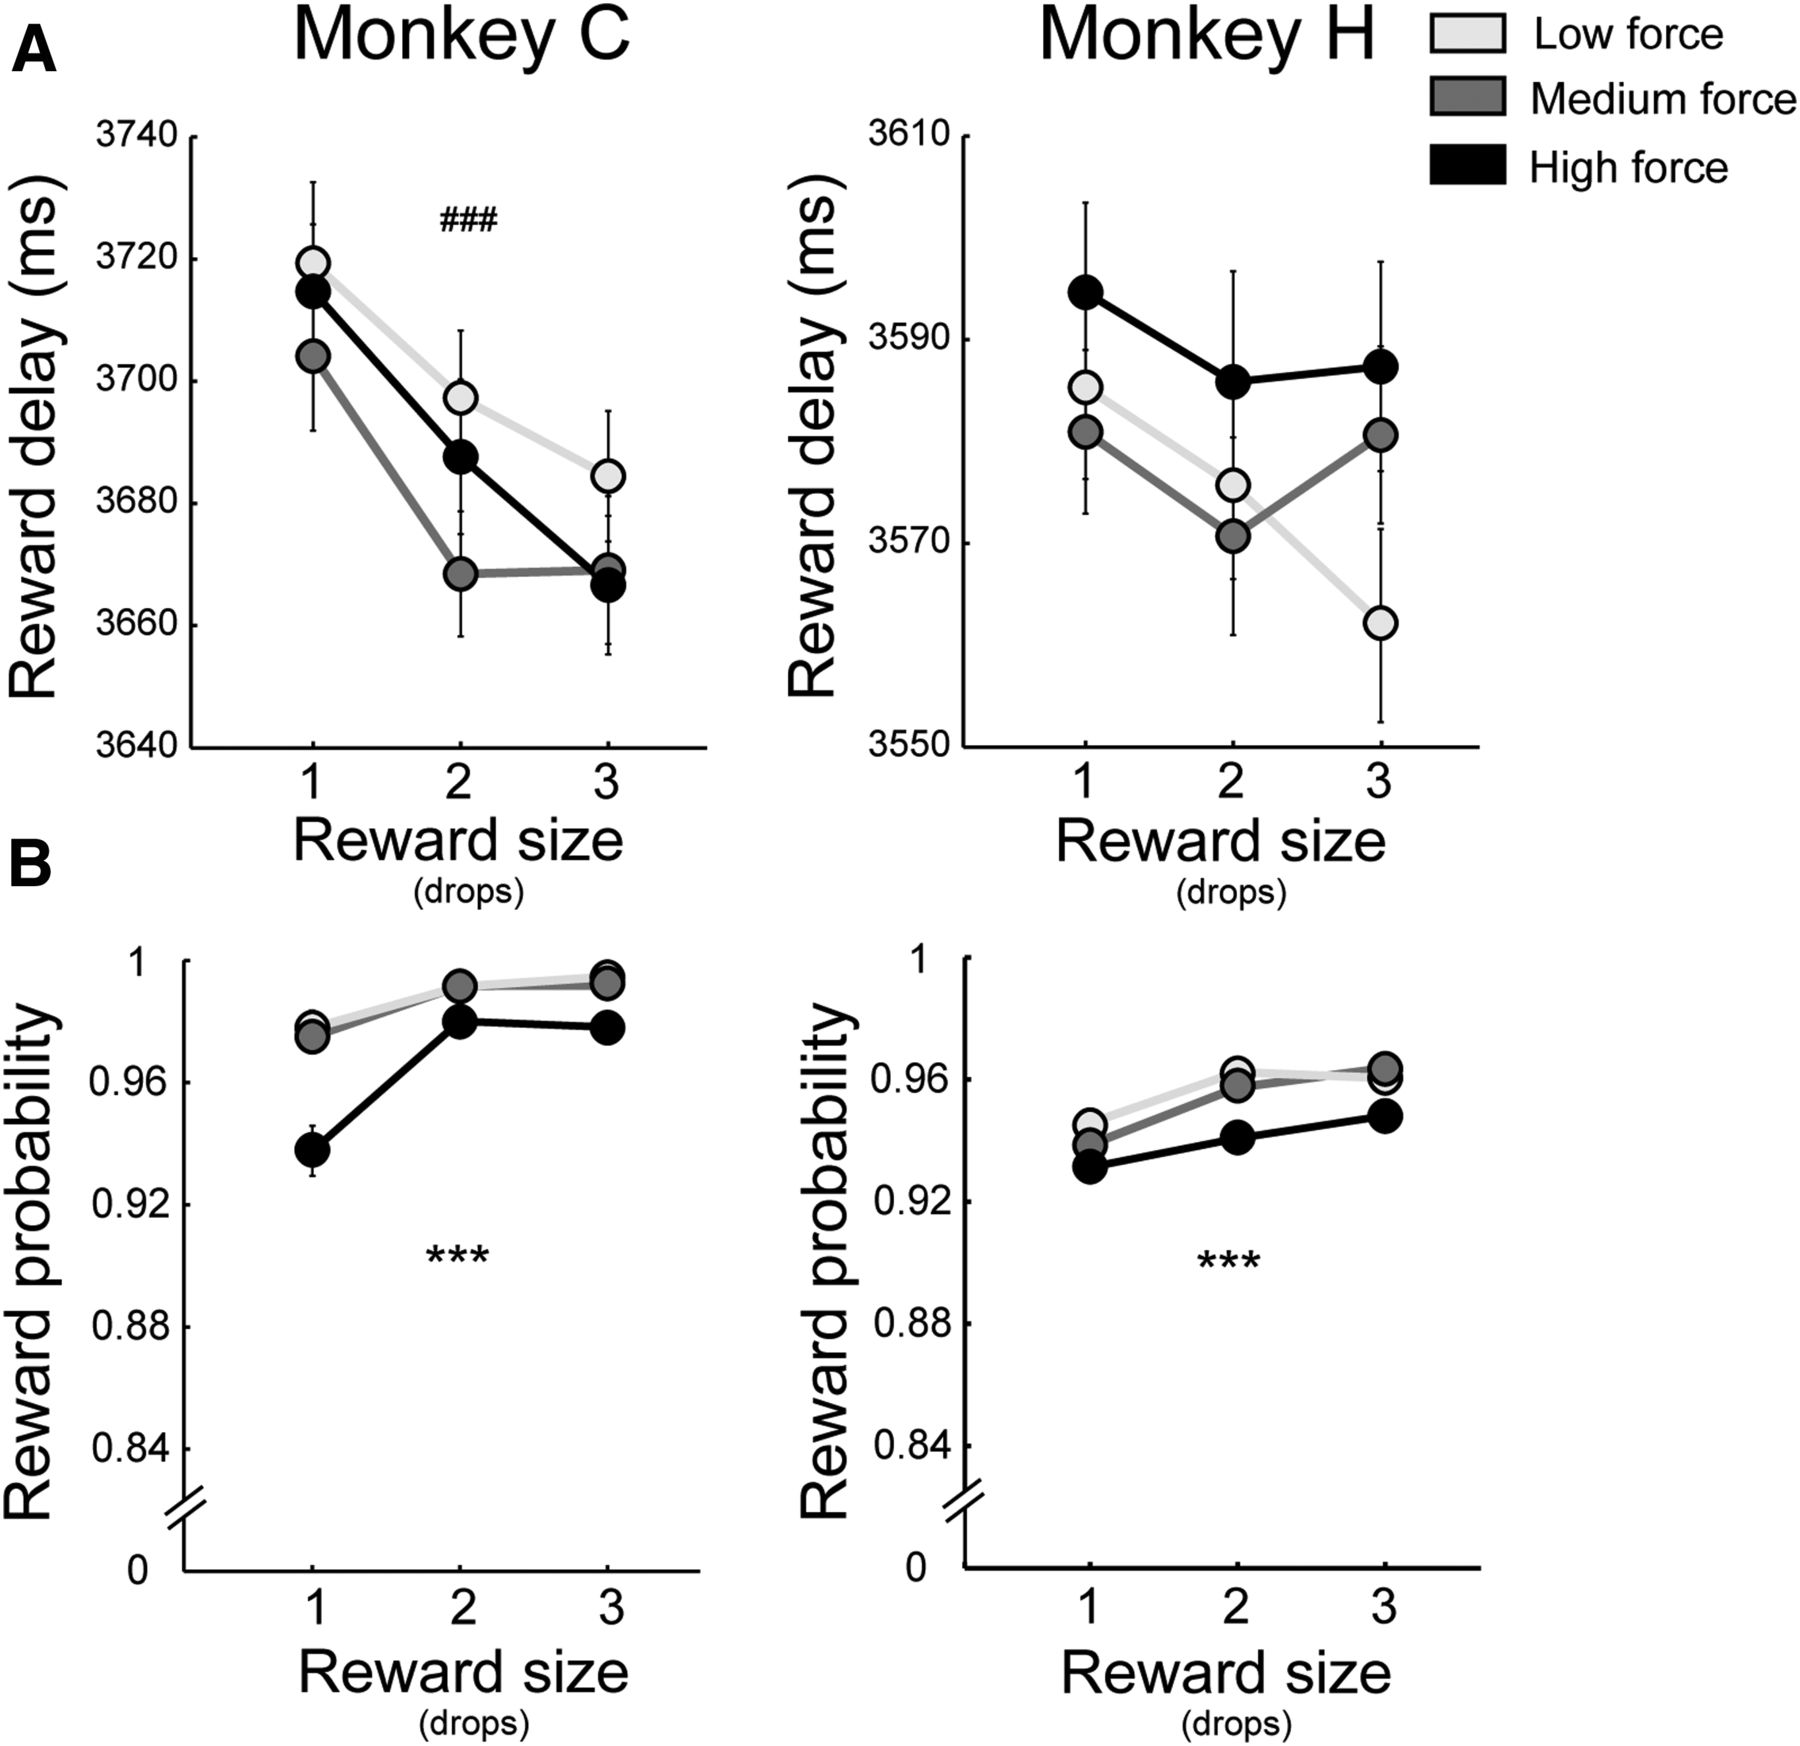
Modulation of task parameters according to task effort and reward combinations. A, Temporal delays from instruction cue to reward delivery. Delay to reward did not vary across effort levels for either monkey (F < 2.23; p > 0.11). For Monkey C, delays were affected by reward quantity: ###F(2,81) = 13.46; p < 0.001 (two-way ANOVA). B, Reward probability was affected by both expected effort and reward size: ***p < 0.001 (see error rates for details). Separate lines denote high (dark), medium (intermediate), and low (light) effort levels.
Next, we compared the mean probabilities of an animal receiving a reward (i.e., of avoiding errors so as to complete a trial successfully) for the different effort/reward conditions (Fig. 6B). The probability of receiving a reward was affected significantly by both effort and reward levels (F > 9.48, p < 0.001), but reward probabilities were always high (>92% across all conditions) and the variation in probability was small (3–4%). The between-condition variation in reward probability was kept small by requiring animals to perform all trial types, even high-effort/low-reward trials. Animals were penalized for abandoning a trial by way of a blank screen time-out (2 s) and representation of any error trial as one of the subsequent five trials (selected at random). When errors did occur, they seldom happened at the beginning of a trial, soon after cue presentation (i.e., during the period of time when an animal would naturally exhibit “opt-out” behavior). A similar distribution of error rates across a trial was found when the analysis was restricted to recording sessions in which utility-encoding neurons were found (χ2 = 0.23, p = 0.63, χ2 test). Therefore, it is unlikely that the neuronal encoding of utility can be attributed to increased error rates (and thus, reduced reward probabilities) on individual recording sessions.
As an additional control, we examined the activity of utility-encoding neurons around the time of reward delivery (SCs in a 500 ms window after reward) motivated by the published evidence that dopamine responses to reward delivery are elevated after stimuli that predict longer temporal delays and smaller reward probabilities (Fiorillo et al., 2003; Fiorillo et al., 2008). Thus, in our experiments, if delay to reward or reward probability varied across effort levels to a degree that was behaviorally significant, then the dopamine responses to reward delivery should also vary across effort levels. No significant effects of movement effort were found in that analysis, however (F(2,12) = 0.8, p = 0.63). We conclude, therefore, that the discounting effect of anticipated movement effort on dopamine responses could not be attributed to systematic biases across conditions in temporal delays or reward probabilities.
Accumulated trials affect vigor and dopamine activity
The spiking activity of dopamine neurons has also been implicated in a slowly varying process that regulates the overall frequency and speed of responses (i.e., response “vigor”) in accordance with an action's energetic costs and an animal's internal motivational state (Niv et al., 2007). We observed that an animal's reach performance decreased gradually across experimental sessions (Fig. 7A; reaction times: F > 7.67, p < 0.001; and movement durations: F > 3.88, p < 0.001), which most likely reflected a slow decline in the animal's motivational state (e.g., resulting from mounting fatigue and satiation). For each dopamine neuron, we tested for similar slow shifts in firing rate (p < 0.05, linear regression, Eq. 3) and found that a subset of neurons (n = 11) slowly reduced their mean firing rate across the trials of a recording session (population-level analysis: F(9,11) = 9.24, p < 0.001; Fig. 7B). The size of this subset of neurons (10% of 107) was significantly greater than chance (χ2 = 5.6, p = 0.01, χ2 test). No neurons showed a gradual increase in firing rate, and the same encoding was detected in the two separate time epochs examined (i.e., around the time of instruction cue presentation and during the intertrial interval). The subset of neurons that showed a slow decrease of activity across trials appeared to be independent of and cut across the previously defined categories of reward, effort, and utility encoding [i.e., slow decreases were observed in utility-encoding (n = 1), reward-encoding (n = 7), and task-independent (n = 3) neuronal subsets], although the small numbers of neurons in these subsets make this last observation less than reliable. To test whether this slow reduction in tonic rate was correlated more strongly with elapsed time than motor variables (RT, MD, PKVel, and Acc), we compared standardized regression coefficients (β) from linear regressions against the slowly varying components of each behavioral parameter. (Behavioral data from each session were divided and averaged into consecutive deciles relative to the total number of trials in a session.) Although the slow reduction of activity observed in this subset of neurons was related to elapsed time more closely than to between-decile changes in motor performance (βTime = −0.54 ± 0.43, βRT = −0.38 ± 0.46, βMD = −0.13 ± 0.39, βPKVel = 0.39 ± 0.50, βAcc = 0.36 ± 0.47), the regression coefficients did not differ significantly (p > 0.05, Wilcoxon test). This observation is consistent with the view that slow changes in the spiking activity of dopamine neurons are related, more or less directly, to the slowly changing motivation factors that regulate response vigor (Niv et al., 2007).

Accumulated trials affected response vigor and dopamine neuron firing rates. A, Mean reaction times and movement durations increase as a function of time across trials (mean ± SEM). N indicates the number of collection sessions for each animal. ***Significant change in behavioral performance across accumulated time (p < 0.001, one-way ANOVA). B, The population-averaged activity of neurons in which the firing rate changed as a function of accumulated time: ***F(9,11) = 9.24; p < 0.001. To test for this slow change in firing rate (Eq. 3), neural activity was extracted from a 100 ms window cue instruction. Data from individual trials were then averaged into consecutive deciles of a recording session, normalized in Z-score by subtracting the mean and dividing the SD, averaged across neurons, and fitted with a linear function.
The gradual reduction in firing rate could not be explained by changes in the discriminability of action potential waveforms. First, good action potential isolation (signal/noise ratio ≥3 SD) was one of the initial criteria for accepting a neuronal recording into the analysis dataset. Second, we quantified for each neuron the quality and stability of single-unit isolation across the recording session (Fig. 8). The signal-to-noise ratios and metrics of sorted spike waveforms were compared between early (first 500 spikes) and late (last 500 spikes) epochs of each recording session. Figure 8A shows an example of a slow decrease of neuronal firing rate across a data collection session (Fig. 8B) accompanied by no detectable change in action potential isolation (Fig. 8C). Together, for both early and late recording epochs, signal-to-noise ratios were distributed similarly for the subpopulation of neurons that showed a slow decrease in firing rate and for the remainder of neurons (p > 0.42, two-sample KS test, Fig. 8D). A similar result was obtained from a parallel comparison of the stability of spike waveform metrics (delay, p = 0.42; magnitude, p = 0.96; two-sample KS test; Fig. 8E). Thus, our observation of a gradual reduction in mean firing rate across trials could not be explained by changes in action potential isolation in those 11 neurons.

Slow decrease of firing rate and recording stability. A, Raster representation of single-unit activity around the time of the instruction cue presentation. B, Mean firing rates (2 s windows) declined slowly across trials (red line; p < 0.05, Eq. 3). C, The decline in firing rate was not attributable to an alteration in action potential isolation. D, E, Single-unit isolation was compared between the early (blue) and late (orange) epochs of individual recording sessions (500 action potentials sampled from each epoch). Neurons that had a slow change in firing rate across a recording session (filled circles) did not differ from other neurons with respect to: (D) differences in signal-to-noise ratio between early and late epochs or (E) variability in action potential waveforms (magnitude or delay). D, E, Insets, Measurement approach in example action potential waveforms (±SD).
Phasic versus tonic encoding during the pericue period
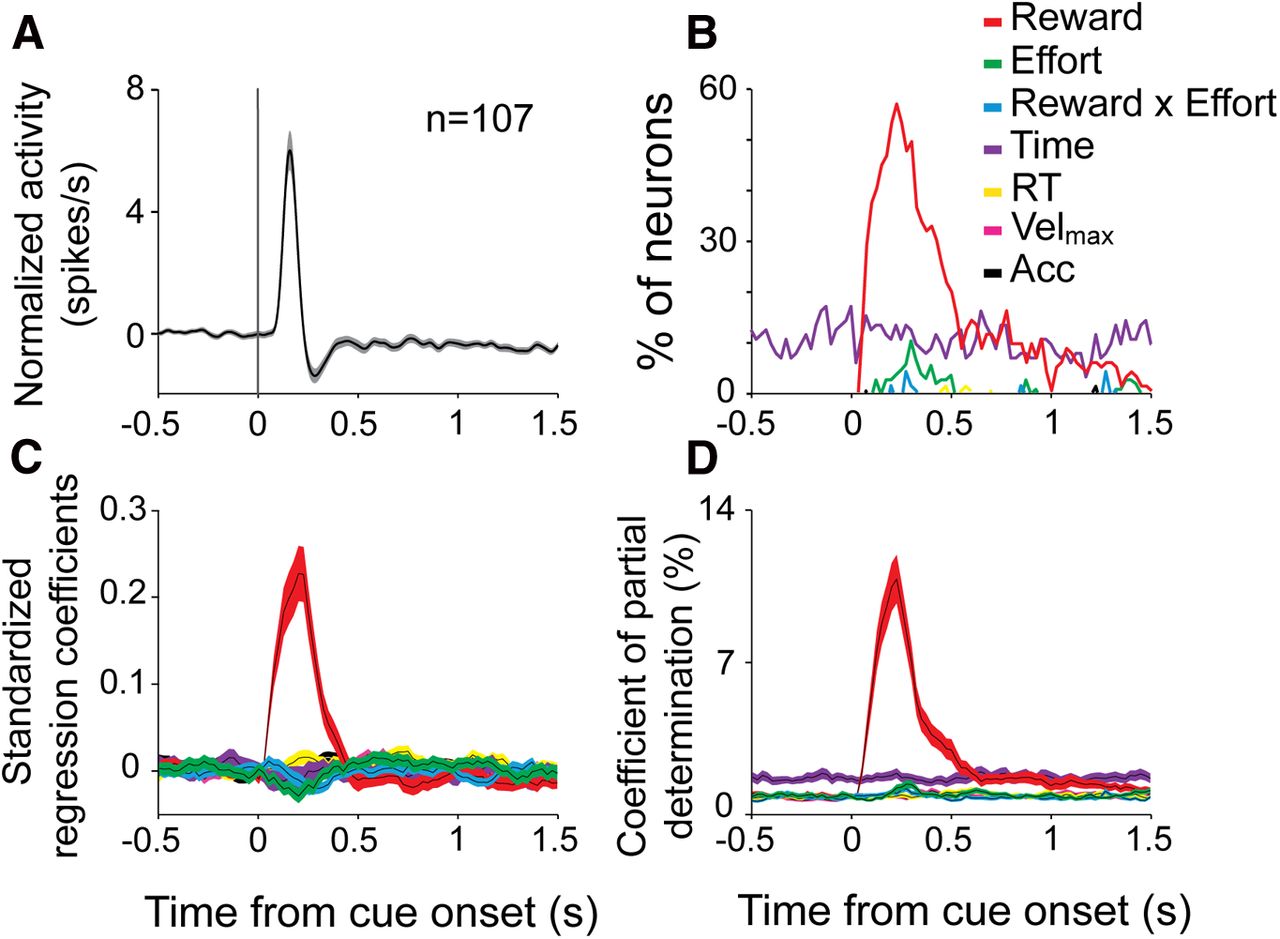
To clarify how dopamine neurons encode information about reward, effort, and motivational state around the time of instruction cue presentation, we performed time-resolved multiple linear regressions with neural activity as the dependent variable (see Eq. 4). For each recorded cell (n = 107, Fig. 9A), we tested whether the firing rate was modulated according to the task parameters [any effect of reward, effort or the interaction of the two (reward × effort)] and accumulated trials (Fig. 9B–D). Other regressors (i.e., detrended measures of reaction time, peak velocity, and initial acceleration of the reaching movement; see Materials and Methods) were included in the model as nuisance variables. The predicted reward value (Fig. 9B–D, red trace). was encoded during cue-evoked phasic responses (primarily within the 500 ms interval immediately following cue presentation), as evidenced by the fraction of neurons showing significant effects (p < 0.05; Fig. 9B), the standardized regression coefficients (Fig. 9C), and the proportion of variance accounted for (coefficient of partial determination, Fig. 9D). Notably, reward was encoded during both the initial increase and the subsequent small decrease in firing rate (Fig. 9A). The predicted effort level (Fig. 9B–D, green trace) and its interaction with the reward value (Fig. 9B–D, blue trace) were also encoded during the cue-evoked phasic responses but for a relatively small fraction of neurons, suggesting a similar time course for these cost–benefit encodings (within the 500 ms immediately after cue presentation). Reward-by-effort interactions were less common here than reported earlier for the two-way ANOVA (Table 2) because the regression analysis tested only for linear interactions whereas the ANOVA used a less rigid model-free approach.

The time course of neuronal encoding. A, The population-averaged spike density function was aligned on the instruction cue onset (mean across all nine cue types) for all of the dopamine neurons that were studied. B, The fraction of neurons that modulated their activity (p < 0.05; Eq. 4) according to reward, effort, interaction reward × effort, accumulated trials (Time), and detrended reaction time (RT), maximum velocity (Velmax), and acceleration (Acc). C, D, The population averages of (C) the standardized regression coefficients and (D) the coefficient of partial determination for the same regressors. The shaded areas represent the SEM.
The neuronal encoding of accumulated trials (time, purple) was present at a constant level throughout the pericue epoch. Even during evoked responses, neither the fraction of neurons encoding accumulated trials (∼10%, Fig. 9B) nor the proportion of variance accounted for changed (Fig. 9D). As a population, dopamine neurons encoded both reward and accumulated trials with no evidence of an interaction between the two encodings. Consistent with previous reports (Schultz et al., 1997), no dopamine neurons encoded the trial-to-trial variations in motor performance (i.e., detrended reaction time, velocity, or acceleration).
Discussion
The present results reveal new relationships between the phasic and tonic activities of midbrain dopamine neurons and distinct aspects of the effort–benefit trade-off in instrumental responding. Although the majority of phasic dopaminergic responses encoded the magnitude of the upcoming reward alone, we show, for the first time, that a subset of neurons predicted net utility of each action by signaling the expected reward magnitude discounted by the invested cost in terms of physical effort.
There is considerable evidence that phasic dopamine responses to a sensory cue encode the reward value predicted by the cue (Schultz et al., 1997; Fiorillo et al., 2003; Tobler et al., 2005; Morris et al., 2006; Roesch et al., 2007; Fiorillo et al., 2008; Kobayashi and Schultz, 2008). Accordingly, midbrain dopamine neurons are thought to play a major role in motivating behaviors toward desired goals (Salamone and Correa, 2002; Wise, 2004; Schultz, 2006; Bromberg-Martin et al., 2010). Although dopamine has also been associated with the ability to overcome costs when high levels of effort are necessary to obtain a desired goal (Cousins and Salamone, 1994; Salamone et al., 2007), the exact involvement of this neurotransmitter in effort/benefit integration has remained unclear. Indeed, contradictory findings have come from recent attempts to study effort-related dopamine release using voltammetry in the ventral striatum of rats. Depending on the study, dopamine release evoked by an informative cue is either not influenced by the amount of operant effort predicted (Gan et al., 2010; Wanat et al., 2010) or is smaller when higher effort is predicted (Day et al., 2010). In the present study, we found distinct subpopulations of dopamine neurons that were anatomically intermixed (Fig. 4). A majority of cue-responding neurons specifically encoded the predicted reward value, whereas others integrated cost and benefit in a utility-like encoding (Fig. 5). This relatively small fraction of dopamine neurons (11%) responded to cue instructions according to a utility function in which the cost of effort discounted the value of future reward following a hyperbolic discount function. This finding revealed that dopamine neurons devalue rewards associated with physical effort in a fashion that is strikingly similar to the discounting effects of temporal delays (Kobayashi and Schultz, 2008).
Consistent with previous reports (Morris et al., 2006; Joshua et al., 2008; Matsumoto and Hikosaka, 2009), a significant fraction of the DA neurons (22%) did not respond to cue instructions, and another fraction (28%) responded to instruction cues, but those responses were not modulated by task parameters (Fig. 4). This last observation is in agreement with recent findings that suggest that dopamine neurons also transmit signals related to the salience of sensory cues independent of their reward value (Matsumoto and Hikosaka, 2009).
We used several methodological refinements to control potential confounds of the task effort parameter. First, most previous studies manipulated task effort by changing the number of lever presses required to earn a reward (Day et al., 2010; Gan et al., 2010; Wanat et al., 2010). However, increasing the required number of actions will invariably also increase the temporal delay to reward and robust evidence indicates that dopamine responses to conditioned stimuli are attenuated in proportion to the temporal delay to reward (Fiorillo et al., 2008; Kobayashi and Schultz, 2008). Indeed, one study that used lever presses showed that dopamine depletions in the ventral striatum made animals more sensitive to the temporal component of multiple lever presses than to the different force requirements (Ishiwari et al., 2004). This finding highlighted the link between temporal costs and dopaminergic function (Fiorillo et al., 2008; Kobayashi and Schultz, 2008) and left open to question the relation between physical effort and dopamine. In the present study, we manipulated task effort while controlling for time effects by using friction loads that opposed the direction of movement. This approach led to minimal differences in temporal delays between cost conditions (Fig. 6A). Our results thus confirm that effort constitutes a restricted but significant component of dopamine value signaling independent of the influence of reward delay. Second, we controlled differences in the probability of receiving a reward across force conditions (Fig. 6B), so as to avoid the well-known and potentially confounding effect of reward history on dopamine responses (Fiorillo et al., 2003; Morris et al., 2006). Differences in reward history between conditions were constrained by requiring animals to perform all types of trials (even high-cost/low-reward trials) and penalizing animals for voluntarily abandoning a trial. With this approach, most errors appeared to be committed involuntarily between-condition variations in reward probability were kept to a minimum. Third, by requiring one inflexible motor response, narrowly constrained movement trajectories and short intertrial intervals (1.5–2.5 s), we controlled an animal's reengagement and approach to the behavioral task. Thus, neural encoding of effort-related information in our study could not be explained by a differential presence of “flexible approaches” as defined in the framework proposed recently by Nicola (2010).
An important avenue for future research will be to determine whether utility-like signals, such as those described here, are present in the activity of other dopamine neuron populations (i.e., aside from the SNc studied here). For example, effort-related signaling may be an important component of the activity of dopamine neurons in the ventral tegmental area, and by extension, the function of their mesolimbic and mesocortical targets. It will also be important to determine how dopaminergic encoding of effort is altered by the behavioral context in which it is tested. Given the fact that dopamine sensory responses are attenuated (in prevalence and magnitude) as an animal becomes increasingly familiar with a certain task context (Schultz et al., 1997), it is possible that dopaminergic encoding of effort would be enhanced from what we found here if studied in animals that were still learning a task's cost–benefit structure.
We found that the cue-evoked responses of a subset of dopamine neurons (11% of all cells sampled) reflected the relative value of rewards in a manner that closely matches the discounting effects of effort on task performance (Fig. 3). This finding fits with previous observations that subsets of dopamine neurons encode the relative value of rewards, integrating multiple attributes of reward (e.g., kind and magnitude) (Tobler et al., 2005; Schultz, 2006) devalued by costs, such as reward uncertainty (Fiorillo et al., 2003; Morris et al., 2006) and delay (Roesch et al., 2007; Fiorillo et al., 2008; Kobayashi and Schultz, 2008). A comparison of the actual rates of incidence of the different subtypes of cost-encoding dopamine neurons is not possible because of differences between studies in methodology and reporting. Stimulus-driven dopamine responses are thought to drive efficient learning of reward prediction and action selection (Schultz et al., 1997; Sutton and Barto, 1998). Previous studies have shown that the cue-related responses of dopamine neurons closely match the action value signal predicted in models of reinforcement learning (Schultz et al., 1997; Bayer and Glimcher, 2005; Tobler et al., 2005; Morris et al., 2006). Furthermore, these models suggest that dopaminergic signaling may facilitate learning that maximizes gains while minimizing energy expenditure (Todorov and Jordan, 2002; Kording et al., 2004; Shadmehr et al., 2010; Parush et al., 2011). Although we did find a population of dopamine neurons whose utility-encoding activity fit those predictions, the preponderance of neurons were insensitive to the energy costs of action. The question remains open whether the activity of the relatively small population of effort-sensitive dopamine neurons is adequate to serve as a teaching signal for learning choices among foraging options and in optimal control policy for motor execution.
Notably, our observation of a slow decline in dopamine neuron firing rate with increasing trial number adds to existing evidence that tonic dopamine level is related to response vigor and enables high-effort behaviors (Salamone and Correa, 2002; Niv, 2007; Niv et al., 2007; Phillips et al., 2007). Increases in dopaminergic tone (e.g., using amphetamine or genetic models) energize goal-seeking behaviors (Taylor and Robbins, 1984; Cagniard et al., 2006), whereas dopamine antagonism or depletion reduces an animal's willingness to work for rewards, especially if the required behavior entails significant energetic costs (Salamone et al., 2001, 2007; Salamone and Correa, 2002). Thus, the tonic activity of dopamine neurons may mediate the influence of fatigue or satiety on instrumental performance (Dickinson et al., 2000). Indeed, previous studies have shown that dopamine antagonists are more effective at suppressing performance in hungry than in sated animals (Dickinson et al., 2000) and appear to mimic the effects of a fatigue–satiety tradeoff on instrumental performance (Willner et al., 1988). Our experimental design did not allow us to determine whether the slow decline in activity correlated better with fatigue or satiety. Critically, the animals' performance of the reaching task also degraded slowly across the duration of a recording session (Fig. 7A) in a manner that was consistent with the effects of mounting fatigue and satiety. The slow changes in dopamine activity correlated not only with elapsed time but also with this slowly changing component of motor performance. This is in contrast to the fast trial-to-trial variations in motor performance (e.g., resulting from trial-to-trial changes in the level of reward and force presented by the task) to which the spiking activity of dopamine neurons was not related (Fig. 9). Overall, these results are consistent with the concept proposed by others that the tonic activity of dopaminergic neurons plays a permissive role in keeping motor systems engaged and ready to generate effortful responses (Salamone and Correa, 2002; Niv, 2007; Niv et al., 2007; Phillips et al., 2007).
An inadequate scaling of movement speed (bradykinesia) and amplitude are characteristic features of dopamine insufficiency (e.g., in Parkinson's disease) (Berardelli et al., 2001). These impairments cannot be explained by intrinsic limitations in motor execution but rather result from a problem in scaling movement vigor resulting from a defective valuation of actions in terms of their energetic cost–benefit trade-off (Hallett and Khoshbin, 1980; Berardelli et al., 2001; Baraduc et al., 2013). Although comprising a relatively small fraction of the general population of dopamine neurons, degeneration of the utility-encoding neurons described here (cells whose encoding of reward was discounted by predicted energetic expenditures) may contribute to such a defective valuation. This inference is in agreement with clinical findings that parkinsonian bradykinesia reflects an exaggerated sensitivity to a movement's energetic cost (Mazzoni et al., 2007; Baraduc et al., 2013).
Footnotes
This work was supported by the National Institute of Neurological Disorders and Stroke at the National Institutes of Health Grant NS044393 to R.S.T. We thank Steve Sargent for excellent assistance with animal care.
The authors declare no competing financial interests.
- Correspondence should be addressed to Dr. Robert S. Turner, Department of Neurobiology, University of Pittsburgh, 4047 BST-3, 3501 Fifth Avenue, Pittsburgh, PA 15261. rturner{at}pitt.edu


