

Article Figures & Data
Figures
- Figure 2.
5-HT5A antagonists attenuate the M-cell synaptic sound response. A, Exemplar traces (KAc electrodes) showing sound-evoked PSPs recorded in the M-cell before (black) and after (gray) treatment with the 5-HT5A antagonist SB-699551. Bottom trace indicates sound stimuli (200 Hz, pips at 147 dB relative to 1 μPa in water). B, Plots of mean ± SEM peak amplitudes of sound-evoked PSPs (n = 14) for control and SB-699551 treatment. Paired t test, **p = 0.0011. C, Exemplar traces, as in A (KAc electrodes), but here subjects were treated with the 5-HT5A antagonist A-843277 (10 mg/kg body weight). Black trace shows control conditions, and gray trace shows sound responses after treatment with A-843277. D, Plots of mean ± SEM peak amplitudes of sound-evoked PSPs (n = 7) for control and A-843277 treatment conditions. Paired t test, *p = 0.03. Note that both antagonists produced similar effects.
- Figure 3.
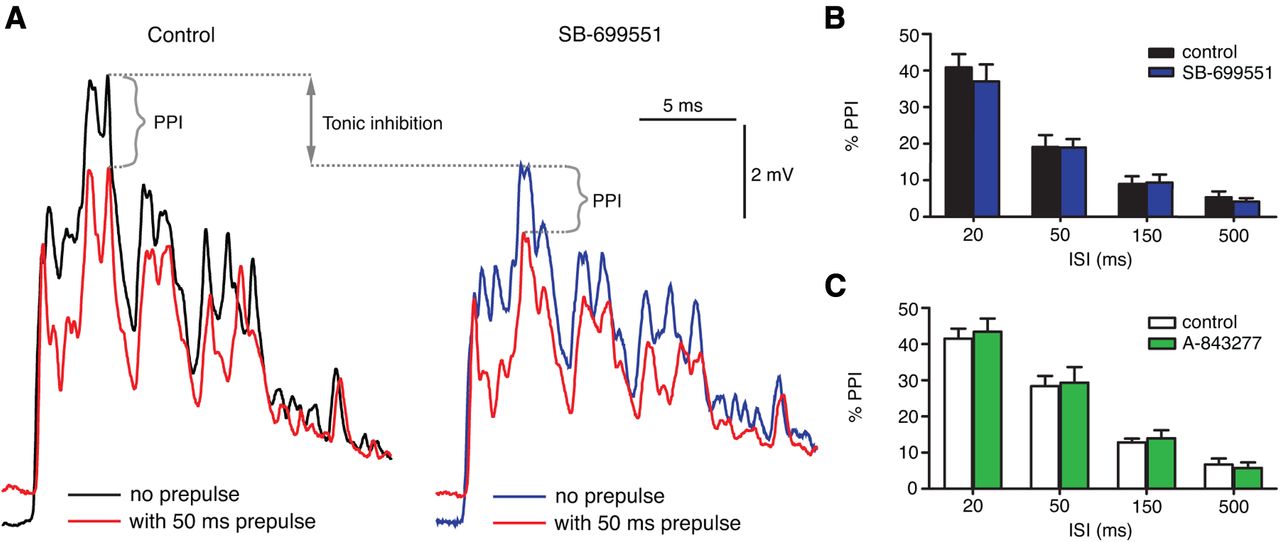
Convergence of discrete inhibitory mechanisms. A, Exemplar traces (KAc electrodes) showing the sound-evoked PSPs with no prepulse (black) and with prepulse (ISI50 ms, red) in drug control (left traces) and SB-699551 conditions (right traces). The sound stimulus was identical in all traces (200 Hz, pips at 147 dB relative to 1 μPa in water). Note that prepulse-evoked inhibition (indicated in brackets) is similar in control and drug conditions but is superimposed (indicated by double-arrowed line) on a tonic inhibition after treatment with SB-699551. B, Plots of mean ± SEM synaptic PPI effect (n = 9) (see A) at varying ISIs in control (black bars) and SB-699551 (blue bars) treatment conditions. ISI is a significant determinant of PPI intensity (2-way repeated-measures ANOVA, p < 0.0001), but SB-699551 caused no significant change in the PPI effect itself (p = 0.3367), nor was there any interaction between drug and ISI conditions (p = 0.6270). C, Plots of mean ± SEM synaptic PPI effect (n = 7), as in B, at varying ISIs in control (white bars) and A-843277 (green bars) treatment conditions. As in B, ISI is a significant determinant of PPI intensity (2-way repeated-measures ANOVA, p < 0.0001), but there was no significant change in PPI intensity attributable to drug treatment (p = 0.6224) or the interaction of ISI and drug treatment (p = 0.9208).
- Figure 4.
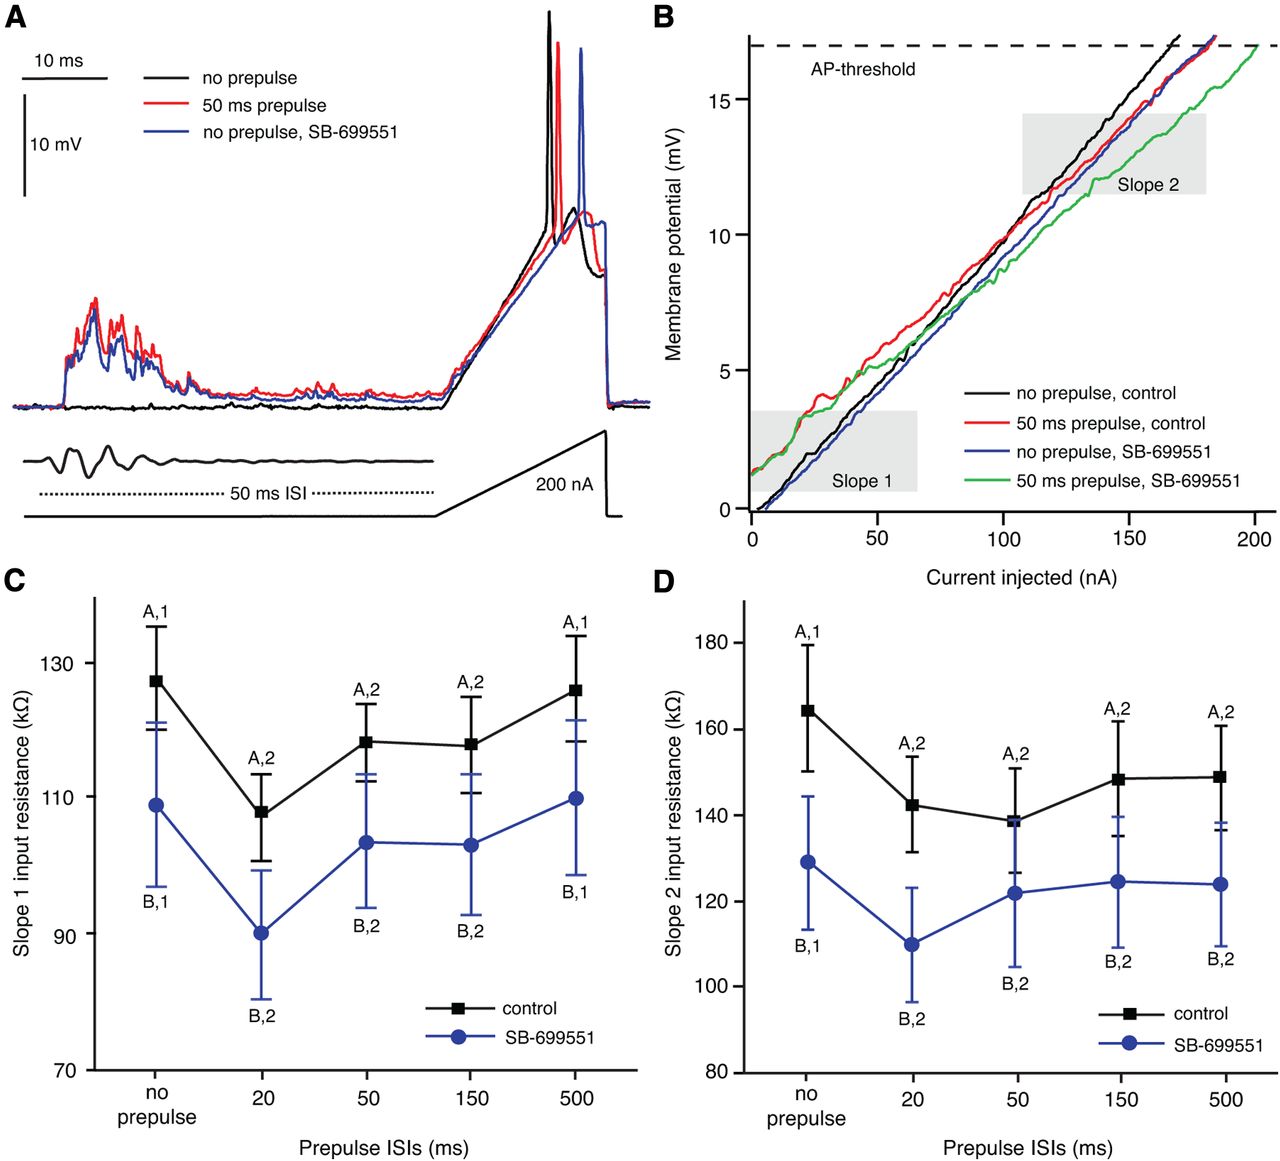
5-HT5A antagonist evokes postsynaptic reduction in M-cell input resistance. A, At top, voltage traces recorded during current injection experiments in control conditions with no prepulse (black), with 50 ms prepulse (red), and with 50 ms prepulse after treatment with SB-699551 (blue). Middle trace shows sound stimulus used for prepulse. Bottom trace shows time course of current injection. B, I/V traces show M-cell depolarization during current injection with no prepulse (black) and 50 ms prepulse (red) in control conditions and no prepulse (blue) and with 50 ms prepulse (green) after SB-699551 treatment. The depicted range shows depolarization from RMP to AP threshold (dashed line). Slope 1 and slope 2 (gray boxes) indicate where linear fits were applied to I/V plots to quantify slope (input resistance). C, Plots of mean ± SEM input resistance for the initial state (slope 1) of M-cell depolarization (control, n = 12, black line; SB-699551, n = 9, blue line) with no prepulse and prepulses at varying ISIs in drug control and SB-699551 treatment conditions. Letters and numbers indicate significant differences (GLMM, post hoc, α = 0.05) between stimulus conditions (numbers) and drug treatment (letters), respectively. D, Plots of mean ± SEM input resistance for the depolarized-state M-cell (control, n = 12, black line; SB-699551, n = 9, blue line) during PPI and drug treatment conditions. Letters and numbers (e.g., A,1, B,2) indicate significant differences (post hoc, α = 0.05) between stimulus (numbers) and treatment (letters) conditions as in C.
- Figure 5.
5-HT5A antagonists reduce the amplitude of M-cell APs. A, Traces show an antidromically evoked AP recorded in the soma in control (black trace) and SB-699551 (gray trace) treatment conditions. Recordings were made with KAc electrodes. Note that the recording electrode was not moved before/after drug application. B, Plots of mean ± SEM peak depolarization of APs in control and SB-699551 treatment conditions (n = 6, paired t test, **p = 0.0154). C, Traces show antidromically evoked APs in control conditions (black trace) and after treatment with A-843277 (gray trace). Recordings made with KAc electrodes. Note that the recording electrode was not moved before/after drug application. D, Plots of mean ± SEM peak depolarization of APs in control and A-843277 treatment conditions (n = 5, paired t test, **p = 0.0015). Recordings made with KAc electrodes.
- Figure 6.
5-HT5A antagonist increases Cl− conductance. A, Sample traces showing M-cell sound responses recorded with KCl− (5 m) electrodes. Note that an enhancement of depolarization in these conditions reflects an increase in outward Cl− conductance attributable to Cl− loading of the cell (see Results). Black trace shows a recording in control conditions, whereas the gray trace shows a recording after treatment with SB-699551. Dotted line indicates 5 ms latency after stimulus onset; to the left, the sound response can be interpreted as a pure EPSP (i.e., only excitatory components), whereas to the right of the line the response is a mixed EPSP/IPSP. B, Plots of mean ± SEM peak depolarization (n = 9) (KCl electrodes) of the EPSP; that is, the sound response within <5 ms of stimulus onset. Black bar plots control conditions and gray bar indicates measures after treatment with SB-699551. C, Plots of mean ± SEM peak depolarization (n = 9) (KCl electrodes) of the sound-evoked PSP >5 ms after stimulus onset. Black bar plots control conditions and gray bar indicates measures after treatment with SB-699551. D, Plots of mean ± SEM percentage change (n = 9) in sound-evoked depolarization (KCl electrodes) during the initial (EPSP) and latter (PSP) components of the sound response after treatment with SB-699551. Note that there was no significant difference in the effect of the drug across the time course of the response (paired t test, p = 0.3825).


