

Article Figures & Data
Figures
- Figure 1.
SEBI imaging paradigm, image reconstruction technique, and normalization. A, SEBI imaging paradigm to obtain optimal image quality of intact tissue: tissue of interest (depicted by a brown cube) is end-block imaged, sectioned, and serially reconstructed by overlaying high-quality signal within the superficial layers on top of the lower quality signal within deep regions. B, A schematic diagram of SEBI procedure. C, Tissue chamber with conical holes (filled arrows) and slots (open arrows) that mates with imaging and sectioning stages for reproducible positioning. D, Image reconstruction technique (from left to right): end-block imaging yields an imaged tissue slab array of 10%-overlapping tiled cubes. Cubes in adjacent slabs are used to determine x, y, z-offset values. Offsets are then propagated to all cubes within the dataset to allow for complete volume stitching and seamless reconstruction. E, Sample X-Z projection image of unprocessed reconstructed adult hippocampus with high signal intensity variation (red circle, left image), and subsequent uniform signal intensity after quantile normalization (red circle, right image). Scale bar, 300 μm. F, Plot of intensity change versus z-depth of reconstructed hippocampus subregion in E before (black line) and after (red line) normalization. Note that before normalization, intensity variability existed within a tissue slab (a) and between imaging sessions (b).
- Figure 2.
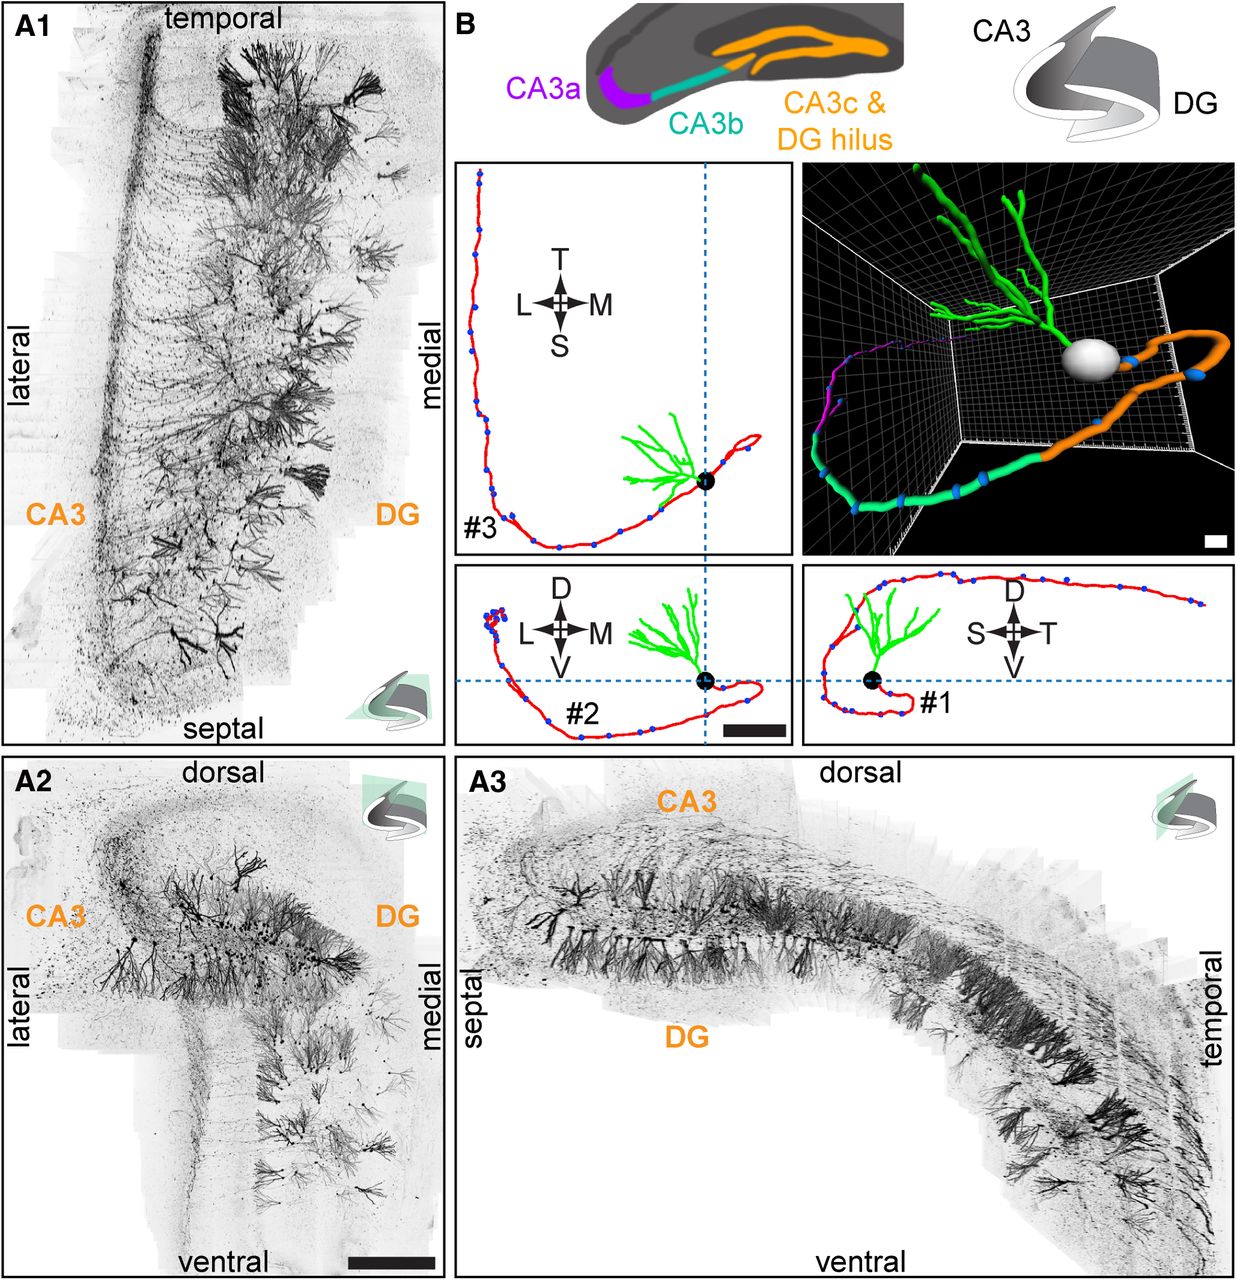
Complete reconstruction of intact adult mouse hippocampus with SEBI. A, Complete reconstruction of retrovirally labeled GFP+ newborn granule neurons (at 77 dpi) in the adult mouse hippocampus projected onto horizontal (A1), coronal (A2), and sagittal (A3) planes, with respect to the hippocampal axis as indicated. See also Movie 1. DG, dentate gyrus. Scale bar, 500 μm. B, Sample tracing of a single adult-born granule cell at 56 dpi shown in the same orientations as in A, with CA3 subregions color-coded for CA3c (orange), CA3b (green), and CA3a (purple), as defined by Lorente de Nó (1934). Primary axon projections of adult-born granule cells make as many as three distinct turns: (#1) up to 180° within the hilus, (#2) a ventral to dorsal turn within CA3b, and (#3) a longitudinal turn toward the temporal pole within CA3a. T, temporal; S, septal; L, lateral; M, medial; D, dorsal; V, ventral. Scale bar, 150 μm.
- Figure 3.
Axonal development, targeting, and organization of newborn granule cells in the adult mouse hippocampus. A, Horizontal view of sample traced axons from 10, 17, 21, 35, 56, and 77 dpi. Scale bar, 100 μm. B, Primary axon length of newborn granule neurons at different times after labeling. Open orange circles represent data from individual GFP+ neurons examined. Numbers associated with open circles indicate total number of GFP+ neurons examined for each condition. Values representing mean ± SEM are also shown (●; *p < 0.01; #p = 0.12; one-way ANOVA, F(5,70) = 61.92, p ≈ 0). C, Representative tracings of three adult-born granule cells with temporal (a), center (b), and septal (c) relative positions. Arrows highlight sharp turn of more laterally positioned granule cells. D, Coronal view and illustration of axon organization among adult-born granule cells in C along the septo-temporal axis: (i) horizontal view illustrating axon stacking and staggering of termination points; (ii) coronal view illustrating graded axon hilar turns. T, temporal; S, septal; D, dorsal; V, ventral.
- Figure 4.
Axon bouton development of newborn granule cells in the adult mouse hippocampus. A, Sample confocal images of axon segments within the CA3b (2 μm depth). Arrows denote axon boutons. Scale bar, 10 μm. B, Axonal mossy fiber bouton density of newborn granule neurons at different times after labeling. Open orange circles represent data from individual GFP+ neurons examined (the same set of neurons as in Fig. 3). Values representing mean ± SEM are also shown (●; *p < 0.01; #p = 0.98; one-way ANOVA, F(5,70) = 44.01, p ≈ 0). C, Relationship between total number of axon boutons and primary axon length for individual adult-born granule cells at different developmental stages. Top graph, Scatter plot of data from individual neurons (same set as in B). Bottom graphs, Individual plots for 10, 17–35, and 56–77 dpi with linear fit and Pearson's correlation R2 (p value from Student's t test).
- Figure 5.
Dendritic development of newborn granule cells in the adult mouse hippocampus. A, Sample 2D-projection tracings of complete dendritic processes of adult-born granule cells at different times after labeling. Scale, 30 μm. B, C, Total dendritic length (B) and branch number (C) of newborn granule neurons at different stages during adult hippocampal neurogenesis (same set of GFP+ neurons as in Figs. 3, 4). Open orange circles represent data from individual GFP+ neurons examined. Values representing mean ± SEM are also shown (●; *p < 0.01; **p < 0.05; #p = 0.76; ##p ≈ 1; one-way ANOVA, (B) F(5,70) = 62.60, p ≈ 0, (C) F(5,70) = 39.29, p ≈ 0). D, Sholl analysis of dendritic complexity (the same set of neurons as in B and C). Values represent mean ± SEM (*p < 0.05; #p = 0.68; two-sample Kolmogorov–Smirnov test).
- Figure 6.
Relationship between axonal and dendritic development of individual newborn granule cells during adult hippocampal neurogenesis. A, Scatter plot of primary axon and total dendritic length of individual adult-born granule cells examined for all time points (the same set of GFP+ neurons as in Fig. 3). Also shown is a linear fit of data from 10 to 77 dpi (y = 1068x + 235.7) with Pearson's correlation R2 (p value from Student's t test). B, Ratio of primary axonal and total dendritic length of individual adult-born granule cells at different developmental stages (same set of neurons as in A). Open orange circles represent data from individual GFP+ neurons examined. Values representing mean ± SD are also shown (●; *p < 0.01; #p = 0.98; one-way ANOVA, F(5,70) = 12.47, p = 1.16 × 10⁻⁸). C, Mean neurite length (primary axon or total dendrite length) of adult-born granule cells at different times after labeling. The same data from Figs. 3B and 5B were replotted in the same graph for direct comparison of growth rates. Values represent mean ± SEM, a1, First phase axon growth rate linear fit (10–21 dpi): y = 96.8x−458 (p = 3.5 × 10⁻¹⁵; 95% confidence interval: 84.1 to 113.5 and −728 to −228 for slope and y-intercept, respectively). a2, Second phase axon growth rate linear fit: y = 4.1x + 1591 (p = 0.01; 95% confidence interval: 0.99 to 7.29 and 1428 to 1753 for slope and y-intercept, respectively). d1, First phase dendrite growth rate linear fit (10–21 dpi): y = 111x − 896, (p = 1.6 × 10⁻¹⁴; 95% confidence interval: 92.4 to 126.8 and −1177 to −592 for slope and y-intercept, respectively). d2, Second phase dendrite growth rate linear fit: y = 3.2x + 1262 (p = 0.03; 95% confidence interval: 0.32 to 5.98 and 1120 to 1412 for slope and y-intercept, respectively).
- Figure 7.
Summary of newborn granule cell axonal and dendritic morphological characteristics and development milestones during young adult mouse hippocampal neurogenesis. A, Overview of adult dentate gyrus and CA3 regions (subregions CAa–c colored in purple, green, and orange, respectively) of the hippocampus with representative axon primary projection patterns overlaid. Boxed regions highlight important axon trajectory features and patterns: (1) characteristic 0–180° hilar axon turn, as viewed in the transverse plane; (2) characteristic 90° ventral to dorsal CA3 turn, as viewed in the transverse plane; (3) characteristic 90° septal to temporal CA3 turn, as viewed in the horizontal (longitudinal) plane; (4) characteristic dorsal stacking of axons originating from more septal dentate gyrus and staggering of axon termination points, as viewed in a sagittal plane with respect to the hippocampal axis. B, Schematic depiction of axon and dendrite development of adult-born granule neurons. Representative granule cells are color-coded according to their phase of structural development. Development is divided into two phases. Phase 1 is further subdivided on the basis of key morphological changes: 1a corresponds to rapid axon, but limited dendrite growth; 1b corresponds to rapid dendrite growth and axon targeting through all CA3 subregions; and 1c corresponds to complete axo-dendritic targeting. Phase 2 is characterized by minimal growth of existing axonal and dendritic structures. C, Time course of axonal and dendritic development of adult-born granule neurons. Most growth and changes occur during phase 1 when axon and dendrite growth is maximal; axon to dendrite length ratio starts high and then rapidly decreases and stabilizes; and dendrite branching and axon bouton density rapidly increase. Very modest growth of axon primary projections and dendrites occurs during phase 2.


