

Article Figures & Data
Figures
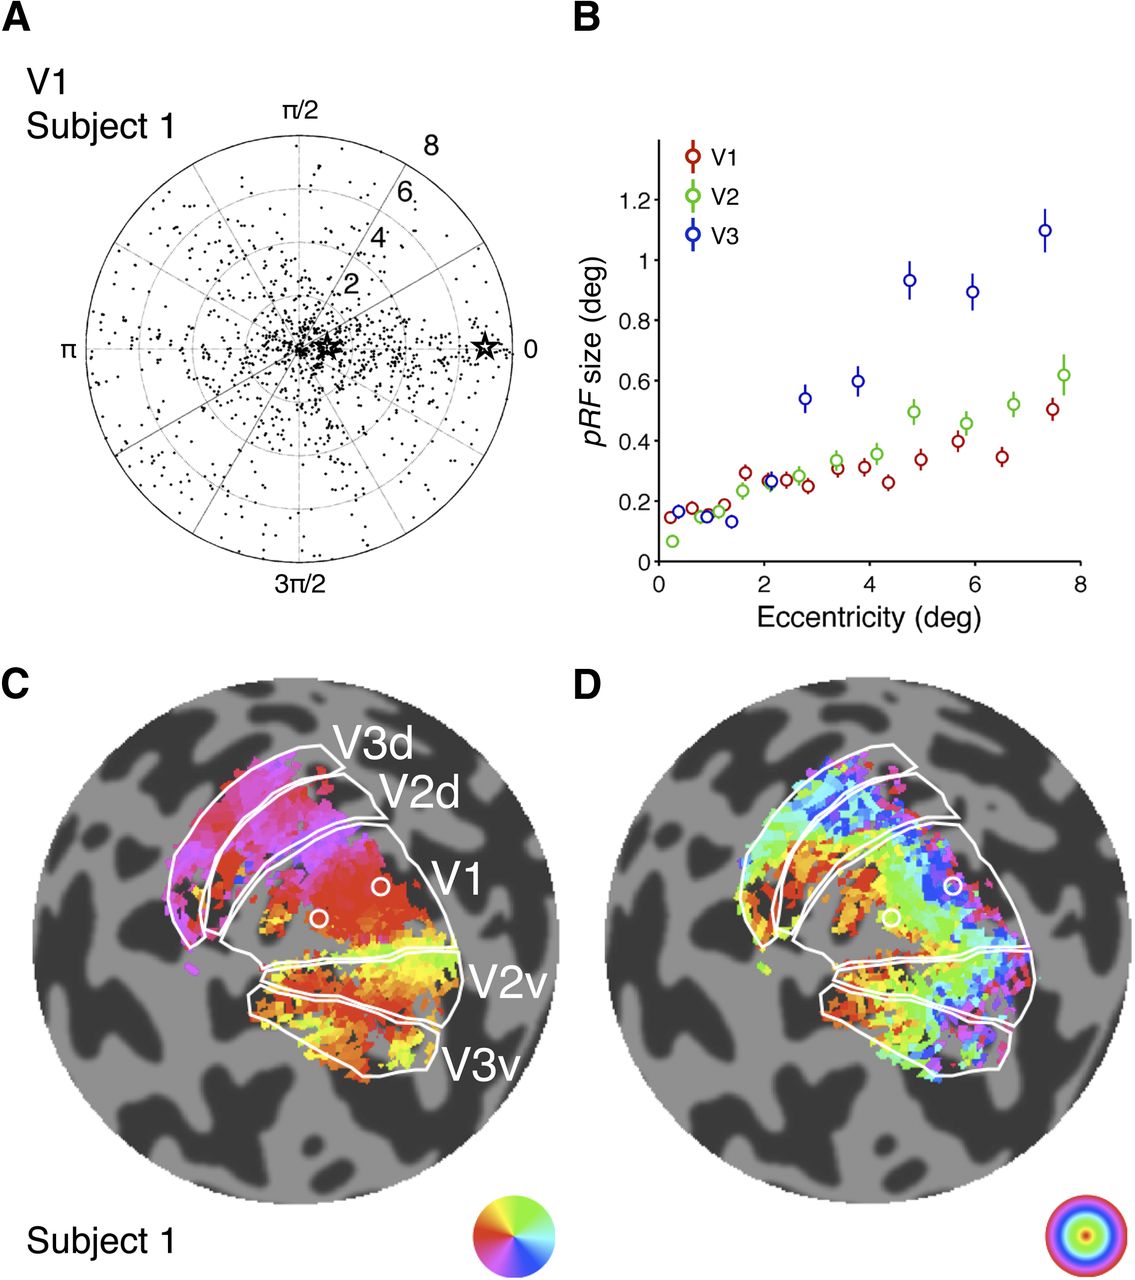
- Figure 1.
Population receptive fields of the individual voxels in V1, V2, and V3. A, Visual field coverage in the central 8° of the V1 of a representative subject. The dotted radial lines and concentric circles represent the polar angles and eccentricities, respectively, in visuotopic space. B, Relationship between eccentricity and pRF size (σ) in visuotopic maps of V1, V2, and V3. Each data point represents the mean size of pRFs, averaged across subjects (n = 8). Error bars indicate SEM. C, D, Cortical surface coverage in the left-hemisphere occipital lobe of the V1, V2, and V3 of the representative subject. The white solid lines indicate the area boundaries. The two small white circles show two example voxels with pRF centers that fall on the horizontal meridian. The corresponding pRF locations of these voxels are indicted by the black stars in A. The colors indicate the polar angles (C) and the eccentricities (D) of the pRFs of the voxels.
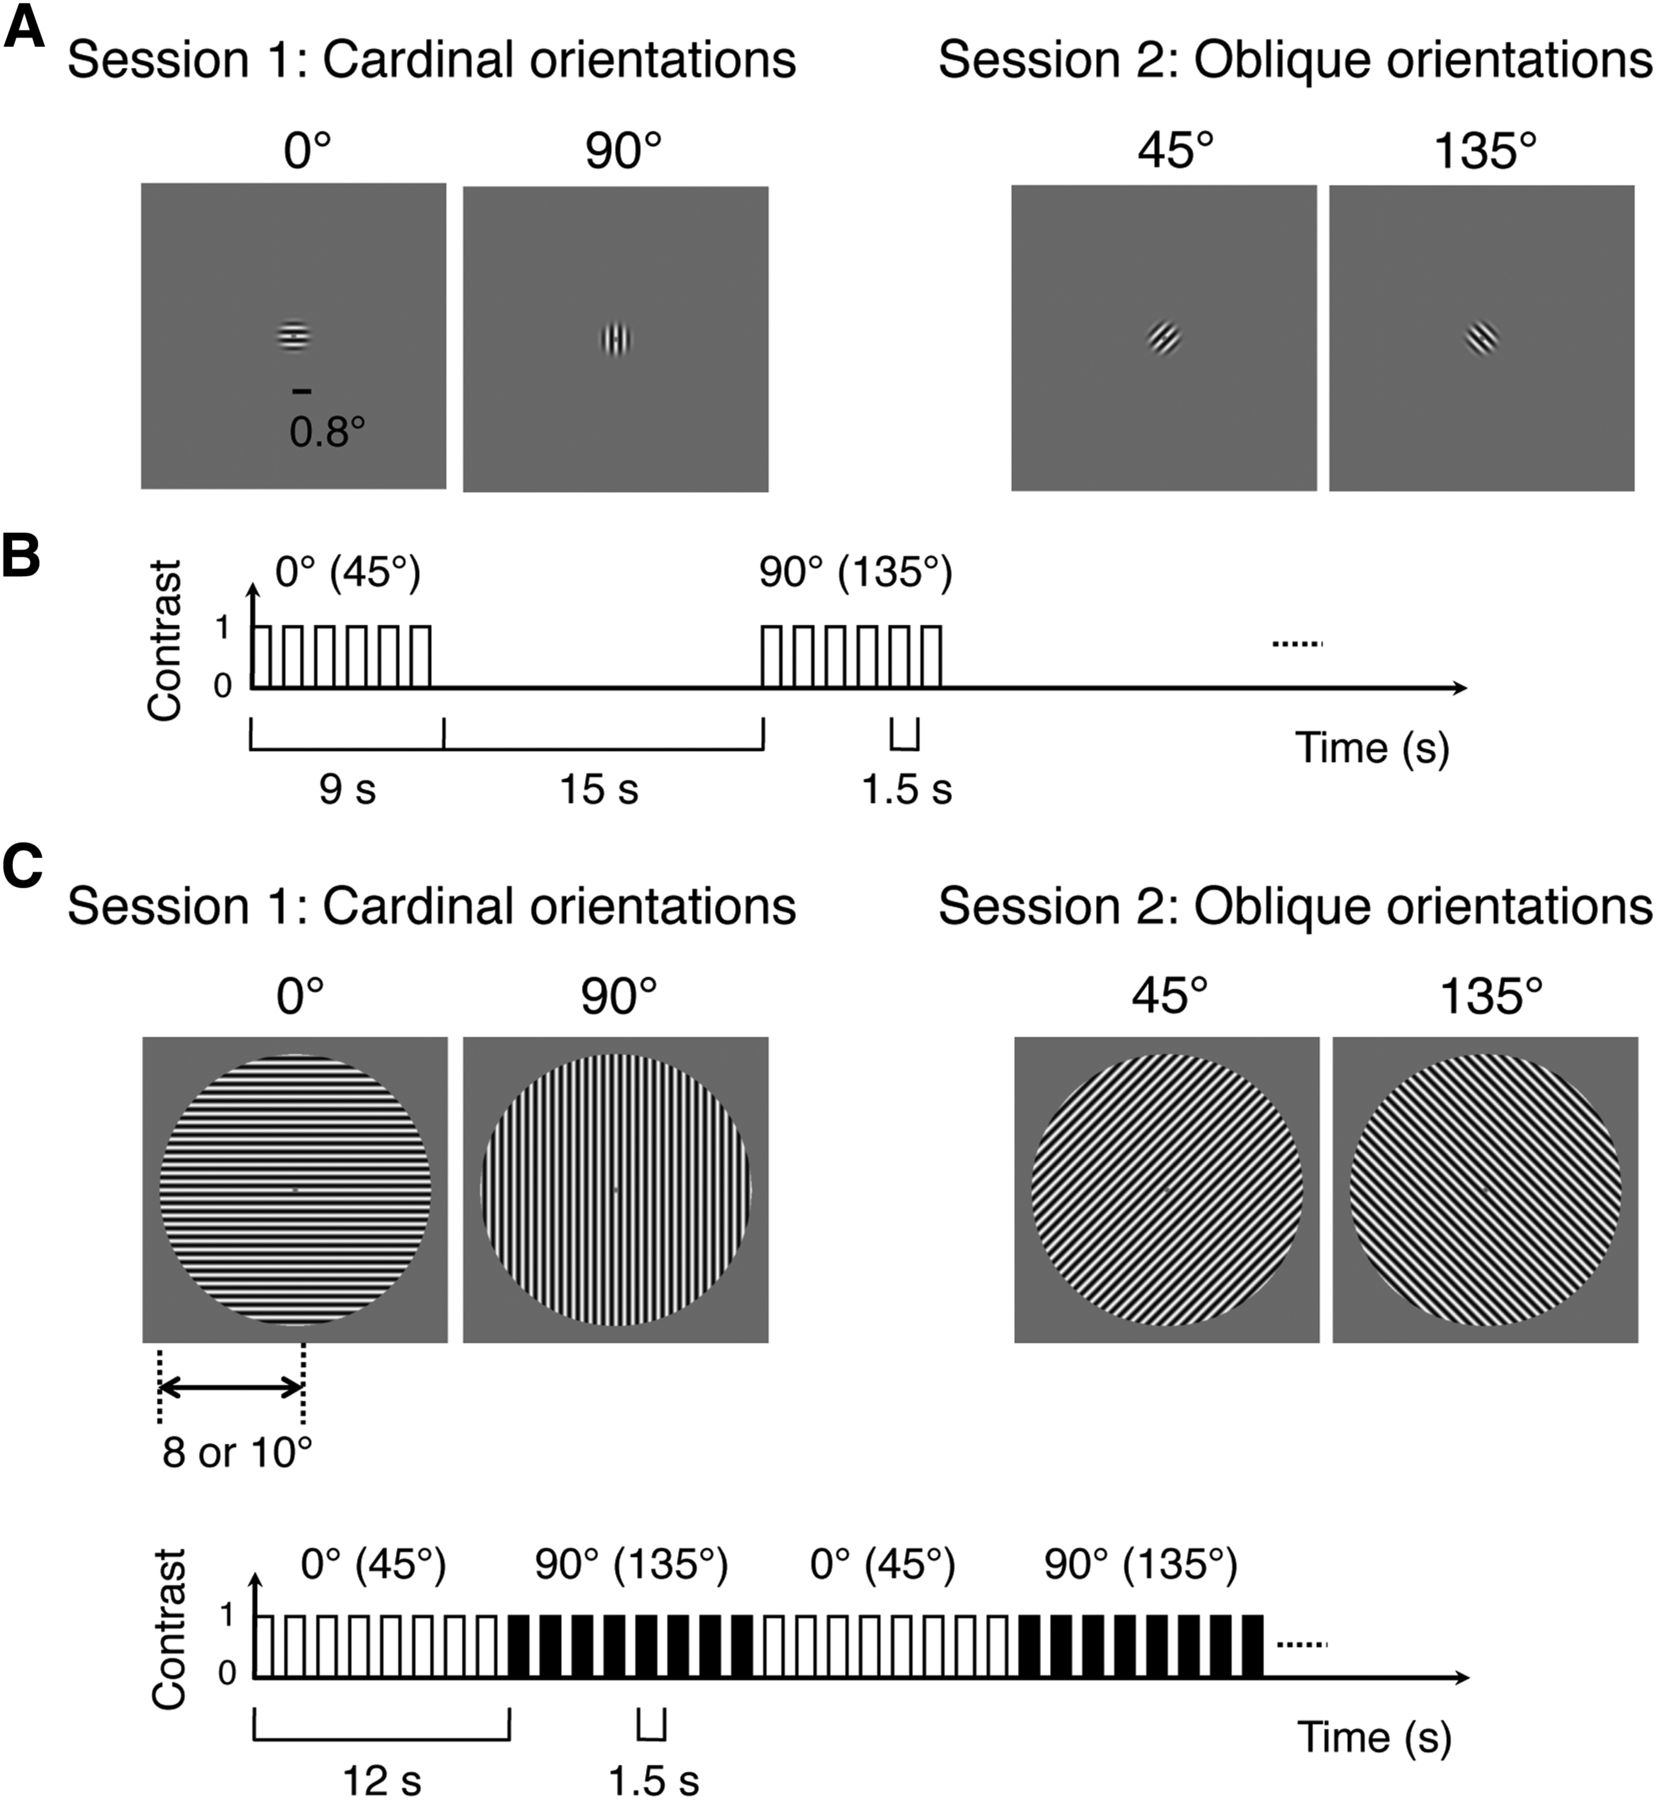
- Figure 2.
Stimuli and imaging paradigms for the static CPS experiment. A, Trigger stimuli in the CPS triggering runs. A pair of small (radius = 0.8°, indicated by the horizontal bar in the leftmost panel) gratings with cardinal angles was used in one session, and a pair of gratings with oblique angles was in the other session. B, Imaging paradigm for the CPS triggering runs. A trigger stimulus flickered at 0.67 Hz for 9 s and then turned off for 15 s before the next trigger stimulus began to flicker. C, Stimuli and fMRI paradigms for the orientation preference mapping runs. Sinusoidal gratings were presented within a large circular (radius = 8.0° or 10.0°) region around the fixation. The orientations of the gratings matched those of the small gratings used in the CPS triggering runs for a given session. The paired gratings alternated every 12 s. The gratings flickered at the same frequency as in the CPS triggering runs.
- Figure 3.
Axial anisotropy in CPS. A, B, Example time courses and fPSFs from area V1 of a single subject. A, Pairs of averaged time courses of fMRI responses, including one from the coaxial (black) condition and one from the ortho-axial (gray) condition, shown as sample eccentricity bins. The gray vertical bars indicate the peak zones of frames (see Materials and Methods for definition). From the trial-by-trial distribution of fMRI responses in this zone for each eccentricity bin, the mean amplitudes (the circle symbols), and 95% confidence intervals (the lines behind the circle symbols) were estimated. The black horizontal bars at the bottom of each panel demarcate the 9 s stimulus-on period. B, Comparison of the coaxial and ortho-axial fPSFs. The thin jagged lines are the fPSFs, which consisted of sliding-window averages of response amplitudes within eccentricity bins. The translucent patches represent the bootstrap 95% confidence interval of those averages. The small circles are the average response amplitudes for the eccentricity bins that were sampled in A. The thick smooth curves are the DoG models fit to the observed fPSFs. The hyphenated lines indicate the spatial extents of the positive portions of the model fPSFs. The two different brightness levels of the lines, symbols, and patches indicate the axiality conditions (black for the coaxial condition and gray for the ortho-axial condition). C, D, Population analysis of axial anisotropy. Symbols and brightness levels represent subjects and visual areas, respectively. C, Scatter plot of the spatial extent estimates from the ortho-axial condition (Eo) relative to estimates from the coaxial condition (Ec). The error bars are bootstrap 95% confidence intervals. D, A stacked histogram of axial anisotropy indexes (AIAXs). The downward triangles of different brightness levels mark the median AIAX values for different visual areas and the white arrow on the x-axis marks the grand median AIAX across three visual areas. The asterisk above the arrow indicates that the AIAX values are significantly different (p < 0.05) than zero.
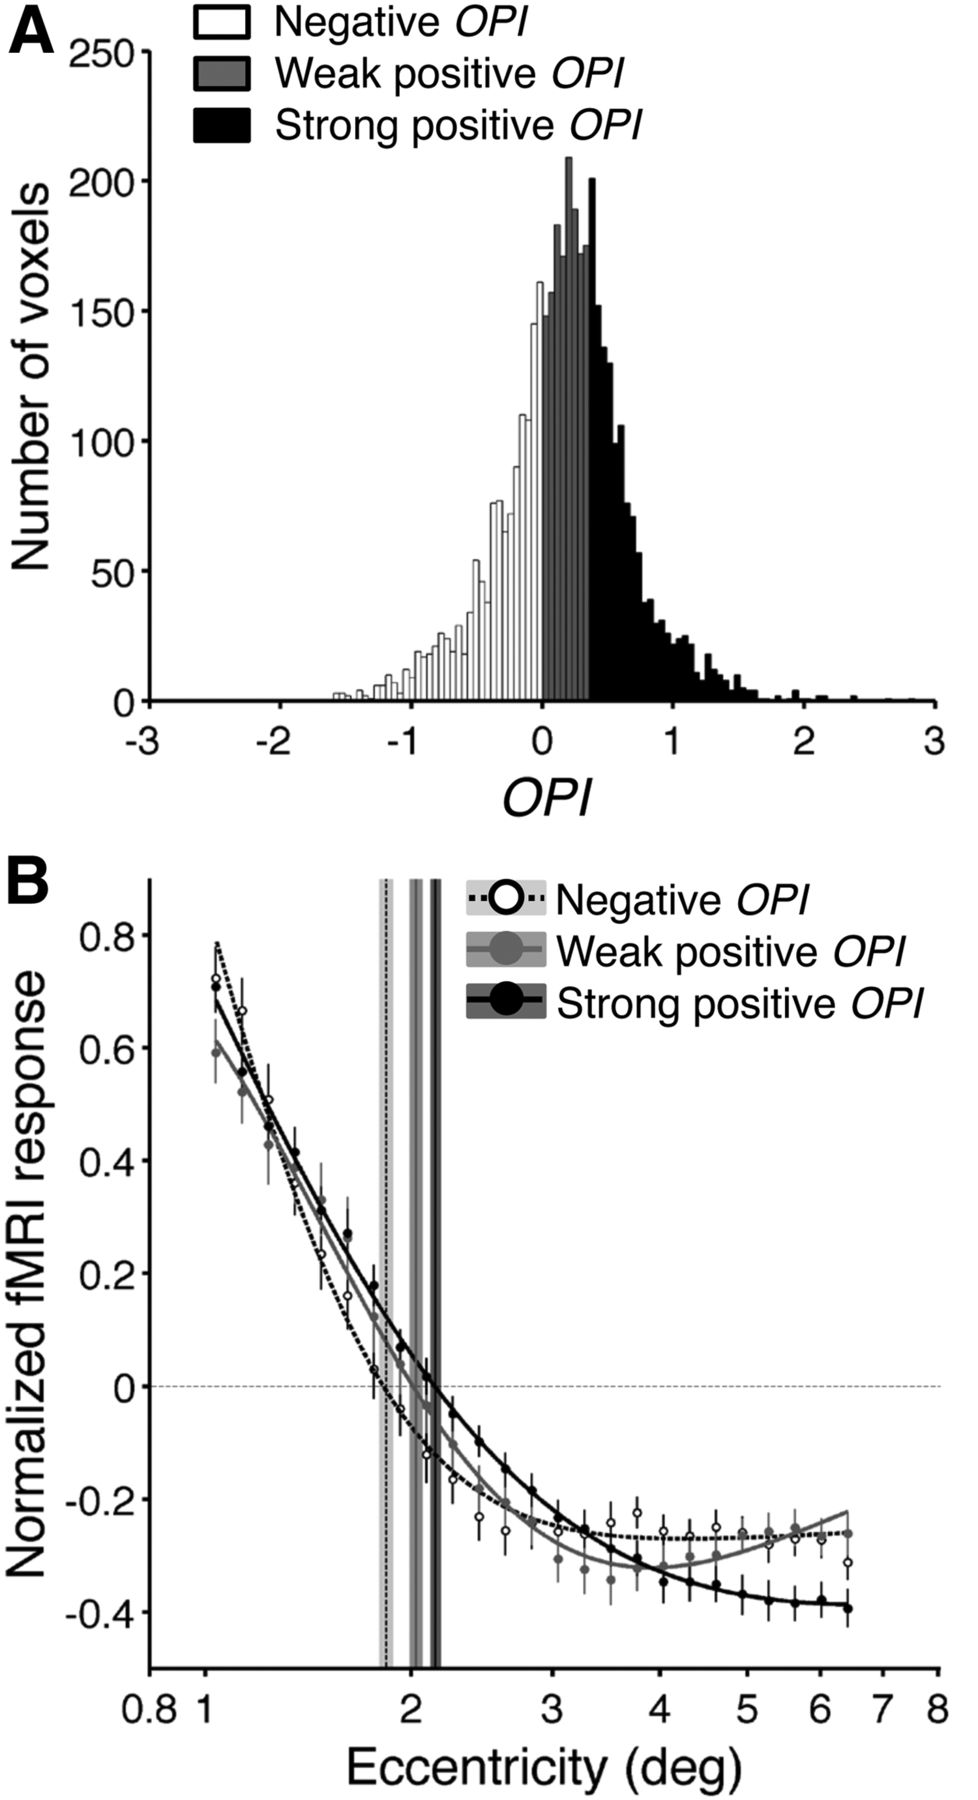
- Figure 4.
Axial anisotropy dependence on orientation preference of CPS carriers. A, Distribution of the OPIs of entire V1 voxels in the coaxial trials from all subjects. Positive and negative OPI values denote relative preference to orientation (same as and orthogonal to the trigger orientation, respectively). The brightness levels of the bars represent the three groups of voxels with different orientation preferences. B, Comparison of fPSFs from the three orientation preference groups. The symbols and error bars around them are the average response amplitudes and the bootstrap 95% confidence intervals, respectively, at given eccentricity bins. The smooth curves are the DoG models fit to the observed fPSFs. The vertical lines of different colors and styles indicate the spatial extents of those model curves for the three different orientation preference conditions. The widths of shadings around the vertical lines represent bootstrap 95% confidence intervals.
- Figure 5.
Stimulation conditions and example results of the traveling CPS experiment. A, Trial sorting based on the shifting axis and the orientation of triggers. The snapshots of traveling triggers are shown for the four different stimulation conditions, which were the combinations of the two shifting axes (horizontal for the top row and vertical for the bottom row) and the two orientations (horizontal for the left column and vertical for the right column). The black arrows represent a shifting direction of an entire stripe of triggers. The four trigger types were sorted into the coaxial condition (boxed by the black solid lines) or the ortho-axial condition (boxed by the black broken lines) based on whether the shifting axis and the orientation of triggers matched. The small white dot is the fixation point. The white dotted lines and circles in the top right panel are the boundaries for the angular position groups and the eccentricity bins. The right side of the figure panels shows how the “radiality” conditions are defined based on the shifting axis of stimuli and the angular position of a given voxel. B, An example of aggregated time series of fMRI responses from many voxels aligned to their own time-to-peaks. The black and gray dots are the cycle-averaged fMRI responses in the coaxial and the ortho-axial conditions, respectively, at one eccentricity bin of a single subject's V1. C, Estimation of spatial extent (σ) and peak amplitude (α) of pCPS. The line curves are the Gaussian functions fitted to the data labeled in the corresponding conditions in B. To illustrate the goodness of fit between the model and the data, the means and their SEs for 10 individual time bins with equal numbers of data points depicted in B are plotted along with the model curves. The axes, symbols, and color labels are the same as in B. The inset table in the upper right corner compares the model-fit parameters between the two axial conditions and axial anisotropy indices based on spatial extent and peak amplitude.
- Figure 6.
Population analysis of axial anisotropy in the traveling CPS experiment. A, Significant coaxial anisotropy in spatial extent of pCPS. The spatial extent estimates in the coaxial condition (σcs) are plotted against those in the ortho-axial conditions (σos) across different eccentricity bins, visual areas, and individuals. Inset (at top), The stacked histograms of σ-based axial anisotropy indices (AIσAX), which were computed from the data points below using Eq. 11, separately for different visual areas. The short vertical bars in the inset indicate the averaged AIσAXs for different areas. B, Absence of coaxial anisotropy in peak amplitude of pCPS. B contains the symbol legends; the format and symbols are the same as in A, except that the peak amplitude estimates (αcs and αos) are plotted against each other, and α-based axial anisotropy indices (AIαAX) were used for the histograms. C, Analysis of eccentricity dependency of axial anisotropy. The σ-based (circles) and α-based (squares) axial anisotropy indices are plotted as a function of eccentricity for different visual areas (black for V1, gray for V2, and white for V3). The large open circles and squares (with error bars) are the averaged AIσAX and AIαAX values, respectively, across different individuals and areas (and the corresponding SEs) at given eccentricity bins. Significance values: *p < 0.05; **p < 0.01; ***p < 0.001. D, Analysis of radiality dependency of axial anisotropy. The format and symbols are the same as in C, except that the anisotropy indices are plotted against the radiality conditions.


