

Article Figures & Data
Figures
- Figure 1.
Characterizing the computation in single neurons with an LN model. A, A neuron is driven to fire action potentials (in voltage V(t)) by stimulating with Gaussian noise input current i(t). Increasing the SD, σ, of the input from σ1 (top, black) to σ2 (bottom, red) results in higher frequency firing. B, The optimal single input feature correlated with spiking is the STA stimulus, the mean current preceding a spike. The feature is normalized such that STA · STA = 1. In this example, STAσ1 (black) and STAσ2 (red dashed) are identical. C, The computation is characterized by the spike-triggered, scaled, filtered stimulus distribution, pσ[ŝ | sp] (ŝ ≡ s/σ). This neuron shows large error in gain scaling as the distribution changes shape significantly with changes in Pσ1, [ŝ | sp]≠pσ2[ŝ | sp]; this change is quantified by Dσ (see Materials and Methods). The prior stimulus distribution, p[ŝ], is a unit variance Gaussian (shaded). D, Scaled nonlinear input–output relations, R̂σ[ŝ]& #x2261; Rσ[ŝ]R̄σ, are calculated by dividing pσ[ŝ | sp] by p[ŝ] (see Materials and Methods); as in C, the two input–output relations do not overlap for different σ.
- Figure 2.
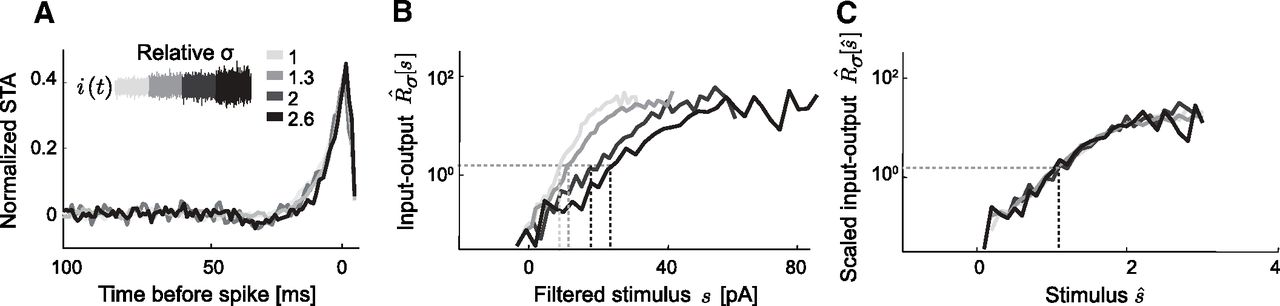
Gain scaling in single cortical neurons. A, Normalized STA current stimulus, P7 mouse cortical neuron. Separate STAs were calculated from four different stimulus SDs (relative σ = {1, 1.3, 2, 2.6}; firing rates R̄σ = {5.1, 6.9, 7.5, 10.0} Hz and spike counts n = {1900, 2600, 600, 800}). B, Unscaled input–output relations, Rσ[s]/R̄σ, for a P7 mouse cortical neuron calculated for different input σ. Shading is the same as in A. Dashed lines indicate the stimulus value at half-maximum. C, The same input–output relations as in B, scaled: x-axis ŝ ≡ s/σ, y-axis R̂σ[ŝ]. This neuron shows nearly perfect gain scaling.
- Figure 3.
Convergence to a common intrinsic computation parallels development of voltage-gated currents. A, Population STAs for immature and mature neurons. B, R̂σ[ŝ] for single σ conditions for immature (n = 15, blue) and mature (n = 26, red) groups. C, Distribution of pairwise DN for immature and mature neurons shown in A and B. Input–output relation shape is more consistent for mature (〈DN〉 = 0.15 ± 0.01 bits, n = 325) than for immature (〈DN〉 = 0.84 ± 0.08 bits, n = 120) neurons. D, Voltage-clamp protocol to measure maximal in vitro currents, INa and IK, in immature (top) and mature (bottom) neurons. Steps start at a holding potential of −70 mV and range from −90 to 40 mV. E, INa versus IK measured as in E. Warmer colors indicate increasing age (E14–P11, n = 169).
- Figure 4.
Block of spontaneous activity does not significantly affect intrinsic computation. Single input σ LN models were calculated for P7 neurons cultured with (red, n = 13) or without (black, n = 13) TTX block of spontaneous activity from E17 to P3. The amplitude of σ was adjusted according to passive input resistance and to achieve 5–10 Hz repetitive firing. A, Mean STA from TTX and control cells (mean across neurons, solid line; ± SEM, dashed line). The two conditions were nearly identical. B, Mean normalized input–output relations, R̂σ[ŝ], across TTX and control cells (mean across neurons, solid line; ± SEM, dashed line). As in A, there was no difference between the two conditions. C, Input–output relations similarity showed no significant change between conditions (Control 〈DN〉 = 0.19 ± 0.03 bits, n = 78; TTX: 〈DN〉 = 0.16 ± 0.05, n = 78; p = 0.094). D, Average potassium and sodium densities for TTX and control (gray) neurons. Current values are estimated using a voltage-clamp protocol (Fig. 3E; see Materials and Methods) and normalized by cell area to obtain current densities. (Control 〈IK〉 = 0.31 ± 0.10 pS/μm2, 〈INa〉 = 0.28 ± 0.11 pS/μm2; TTX: 〈IK〉 = 0.25 ± 0.05 pS/μm2, 〈INa〉 = 0.26 ± 0.05 pS/μm2.) Current densities and INa/IK ratios were not significantly different between conditions (IK: p = 0.58; INa: p = 0.88; control 〈INa/IK〉 = 0.90 ± 0.06; TTX 〈INa/IK〉 = 1.18 ± 0.20, p = 0.09).
- Figure 5.
Two pharmacological manipulations of INa/IK change gain-scaling behavior in agreement with model results. A, B, Reduction of transient K-current changes input–output relation shape and improves gain scaling (organotypic slices). A, Mean R̂σ[ŝ] across neurons before (black) and after the addition of 1 mm 4-AP (red), n = 11. Dashed lines show ± SEM. B, Mean Dσ values before (black) and after addition of 4-AP (red). Lines show control and 4-AP pairings for individual neurons (control: 〈Dσ〉 = 0.27 ± 0.03 bits; 4-AP: 〈Dσ〉 = 0.16 ± 0.01 bits, n = 11). A majority of neurons showed an improvement in gain scaling (9 of 11 neurons, p = 0.014, paired t test, mean improvement of 35 ± 8%). Treatment with 4-AP resulted in a small increase in input–output relation similarity, DN (p = 0.013). C, D, Partial block of sodium channels shifts the input–output relation shape to higher stimulus values and decreases gain-scaling behavior (acute slices). C, Mean R̂σ[ŝ] across neurons before (black) and after the addition of 5 nm TTX (blue), n = 19. Dashed lines show ± SEM. Stimulus SD were changed by a factor Δσ = 100(σ2 − σ1)/σ1. D, Mean Dσ values before (black) and after addition of 5 nm TTX (blue) for 30% Δσ (left) and 50% Δσ (right) switches. Note change in abscissa scale from B. Lines show control and TTX pairings for individual neurons; 30% Δσ (n = 7) (control: 〈Dσ〉 = 0.08 ± 0.02 bits; TTX: 〈Dσ〉 = 0.13 ± 0.03 bits). A majority (5 of 7 neurons) showed an increase in gain-scaling error, but this difference was not statistically significant (p = 0.1773, paired t test; mean increase in error of 99 ± 52%); 50% Δσ (n = 12) (control: 〈Dσ〉 = 0.21 ± 0.05 bits; TTX: 〈Dσ〉 = 1.09 ± 0.21 bits). For this Δσ, all neurons showed an increase in gain-scaling error (p = 0.0004, paired t test; mean increase in error of 550 ± 150%). Error bars indicate SEM.
- Figure 6.
Excitability and gain-scaling error in the GNa versus GK conductance plane. A, The biophysical model had three excitability regimes: silent, excitable, and spontaneously active (10,000 simulations, GNa and GK from 20 to 2000 pS/μm2, in increments of 20 pS/μm2). To test excitability for nonspontaneously active neurons, the SD σ of a 10 s Gaussian noise current was increased in 2 pA increments until noise-driven hyperpolarizing voltage excursions became negative to −100 mV (silent) or the neuron fired an action potential (excitable). For LN models (Fig. 7), we used a coarser grid of conductance parameters (100–2000 pS/μm2, in increments of 100 pS/μm2). B, Dσ was calculated for 148 model neurons with varying GNa and GK conductance values, stimulated with two stimulus SDs: σ1 = 1 and σ2 = 1.3 (Δσ = 30%). Warmer colors indicate larger gain-scaling error.
- Figure 7.
Conductance ratio changes input–output relation shape and gain-scaling ability. A, R̂σ[ŝ] for model neurons with a variety of conductance ratios (GNa/GK, see inset for color code), stimulated with a single stimulus σ (70 pA). B, R̂σ[ŝ] for a range of σ (50–100 pA) for two model neurons with high and low GNa/GK. C, Error in rescaling, Dσ, plotted against GNa/GK for models stimulated with a large range of σ. Dσ was calculated for conductance combinations, which responded to both σ1 and σ2, for Δσ from 5 to 50%. Lines indicate mean Dσ values for different levels of Δσ.
- Figure 8.
EIF models reproduce cortical recordings. All parts: mature (P7) cell (color: relative input SD, σv/vth−vo = {0.27, 0.35, 0.54, 0.70}), EIF model with fixed parameters across all input conditions (black). A, Scaled input–output relations (σv/vth−vo = 0.35 excluded for clarity). EIF model predicts input–output relations: D̄M = 0.18 ± 0.02 (sampling floor ≈ 0.1). EIF model predicts breakdown of gain scaling for small σ. Data and model show nearly perfect gain scaling for larger σ, as expected from analysis of the steady-state voltage distributions. B, Mean firing rate versus input SD: data (●), model (♦, black line); shown in physical units and intrinsic model units. Consistent with our theoretical understanding of gain scaling, the breakdown in perfect gain scaling occurs at small σ where the mean rate is not yet approximately linear in σ, indicating that the voltage distribution does not scale as required (Eq. 29). C, EIF model goodness of fit in mature population (P7, n = 6) is consistent with example shown. Mean rate model versus mean rate data (black line gives equality). Not shown: coincidence factor, 〈Γ〉 = 0.59 ± 0.07; 〈D̄M〉 = 0.36 ± 0.21. D–G, Voltage traces (color code as in A) for fixed mean input (μ = σ1/2 = 21 pA) for an example mature cell. Effective resting potential is vo = −45 mV and EIF model threshold is vth = −24 mV. Same input time series for D–G. Goodness of fit: coincidence factors Γ = {0.64, 0.71, 0.66, 0.60} ± 0.02 (Eq. 22; Kistler et al., 1997).
- Figure 9.
Gain-scaling properties of the EIF neuron. All parts correspond to the mean best-fit EIF neuron from Table 2; cool-to-warm color gradient corresponds to increasing input SD, σv from 2 to 24 mV. A, Steady-state voltage distributions (unscaled); the dashed line indicates constant vth; the dotted line intersects each distribution at its vspike, the voltage for which at least 95% of crossing events reach the peak spike height. With increasing input SD, the distributions broaden subthreshold and the density above threshold becomes increasingly insensitive to the input SD. B, Steady-state voltage distributions scaled in relation to vth, the intrinsic threshold voltage as the input strength goes to zero. As σ increases, the scaled distributions converge to a common form below threshold and the density at v = vth approximately approaches a constant value, independent of σ. A and B show that the EIF model exhibits the properties required for perfect gain scaling given in Equations 25 and 29. C, Steady-state voltage distributions scaled in relation to weakly σ-dependent vspike (see Materials and Methods). For finite input SD, labeling spikes by the crossing of vth overcounts aborted spikes—events that do not approach the peak spike voltage before returning subthreshold. The appropriate choice of vspike identified spikes with less ambiguity and slightly more accurately captured the gain-scaling property of the model, as was indicated by the slightly tighter convergence of the distributions at v = vspike. Example LN models are shown in Figure 8A. D, Mean firing rate versus input SD. As is consistent with the scaling of the voltage distribution for increasing input SD, the firing rate increases linearly as required by Equation 26. See also Figure 8B and C. E, Nonlinear functions for the same range of σ as in B, computed using spike times triggered on crossing of vth. F, Nonlinear functions as in E, computed using spike times triggered on vspike, have a slightly different shape but very similar gain-scaling properties.
- Figure 10.
EIF model distance-to-threshold changes input–output relation shape and rescaling ability in agreement with biophysical modeling. A, R̂σ[ŝ] for the EIF model over a range of relative activation parameters (0 ≤ Δ/vth−vo ≤ 1 in increments of 0.05; vr = vo), stimulated with a single stimulus σv/vth−vo = 0.65. The gain (slope) decreases with increasing Δ/vth−vo; i.e., with decreasing distance to threshold, corresponding to increasing GNa/GK (compare with Fig. 7A). B, R̂σ[ŝ] for a range of input strengths (0.65 ≤ σv/vth−vo ≤ 2) for two model neurons with different Δ/vth−vo (compare with Fig. 7B). C, Mean error in rescaling, 〈Dσ〉 (averaged over range of σv in B, normalized relative to the minimum value) plotted against the activation parameter (compare with Fig. 7C). For fixed Δ, gain scaling improved with decreasing vth − vo and was insensitive to the reset parameter.
- Figure 11.
Computing with a voltage-based neuron: gain scaling. A, Idealized example: perfect gain scaling is enacted by the transformation of the filtered stimulus into the voltage. Consider an example where a spike is triggered by a 2σ event in the filtered stimulus (top). To perform perfect gain scaling, in stimulus space, the threshold for firing a spike must increase with increasing σ so that the encoded event is determined by the relative size of the signal. The variable threshold in stimulus space maps to a fixed threshold in voltage space (middle) and so the mass of the voltage distribution must correspondingly shift to more hyperpolarized voltages to enact gain scaling. Gain scaling will be assured if the scaled, shifted voltage distribution, Equation 29, is identical for all input σ. B, Limiting dynamics: linear subthreshold integration with a voltage threshold very close to the resting potential. In this limit, all trajectories that start from rest and move to hyperpolarized voltages linearly integrate the input and so have typical displacement proportional to σv, while all depolarized trajectories are truncated by the occurrence of a spike (top; inaccessible region shaded). The voltage distribution is half-Gaussian except for the small region between rest and threshold (middle) and scales with σv (bottom). In this limit, the system approximates a linear stochastic process with a reflecting boundary at the threshold. C, Gain scaling in the EIF model. Example voltage trace (top); steady-state voltage distribution with intrinsic dynamics overlaid (middle); scaled voltage distribution (bottom). The subthreshold behavior occurs primarily where the dynamics are essentially linear. The intrinsic excitability facilitates spiking, speeding the transit through the region near vspike and allowing for nearly perfect gain scaling in the presence of a large nonlinearity and distance to threshold. D, Gain scaling in an example mature cortical neuron. Voltage trajectory (top): as in the EIF model, input integration occurs primarily below the effective resting potential; steady-state voltage distributions (middle); scaled voltage distributions (bottom). For larger input SDs, the voltage distribution approximately scales according to the properties (Eqs. 25 and 29), but does not scale correctly for small σv. Accordingly, we expect that the LN models will show nearly perfect gain scaling for larger input strengths, but that scaling will break down for small σv. This is confirmed in Figure 8A. Note that Equation 25 holds for a range of voltages that are part of the spike event: gain scaling is insensitive to the exact definition of vspike.


Tables
Variable Equation Ax [10−3] Vx [mV] Kx [mV] m αm 182 −35 9 βm 124 −35 9 h αh 24 −50 5 βh 9.1 −75 5 h∞ – −65 6.2 n αn 20 20 9 βn 2 20 9 Parameter Mean value ± STD resting potential (μ = 0) −68.5 ± 2.5 mV μ 39.9 ± 17.4 pA vo (μ ≠ 0) −48.2 ± 5.4 mV vth −25.3 ± 1.1 mV τv 18.0 ± 4.2 ms Δ 9.3 ± 2.3 mV vr −55.4 ± 7.1 mV vs 37.0 ± 3.5 mV r 150 ± 90 MΩ 
0.37 ± 0.05 −0.1 ± 0.2 P7; no DC input (μ = 0): n = 28; with DC input: n = 6.


