

Article Figures & Data
Figures
- Figure 1.
Social defeat-induced cFos expression predominated in GAD2-expressing GABAergic neurons in the DRN. A–I, Distribution of defeat-induced cFos in the DRN of GAD1-GFP mice with fluorescently tagged GAD67+ GABA neurons (A–C; pseudocolored red for consistency), GAD2-tdTomato mice with fluorescently tagged GAD65+ GABA neurons (D–F), or Pet1-tdTomato mice with fluorescently tagged 5-HT neurons (G–I). Note the striking overlap between cFos- and GAD2-labeled GABAergic neurons. Aq, aqueduct. Scale bar, 50 μm. High-magnification (63×) images depicting cFos colocalization with fluorescently labeled neurons can be found in the insets of C, F, and I. Examples of colocalized neurons are marked with a solid arrowhead. J, Lack of overall difference in total number of cFos+-labeled DRN neurons after social defeat among GAD2-tdTomato, Pet1-tdTomato, and GAD1-GFP mouse lines. Within strains, there was a significant increase in total cFos+ neurons after defeat compared with controls (two-way ANOVA, Fisher's post hoc; GAD2 ***p < 0.001; Pet1 ***p < 0.001; GAD1 ***p < 0.001; per genotype n = 3–5 for undefeated, n = 3–7 for defeated). K, Quantitation of cFos colocalization in GABA and 5-HT neurons of control and defeated mice. The defeated mice demonstrated significantly higher GABAergic cFos induction versus controls. Overall cFos induction in GAD2-labeled neurons was significantly greater than in Pet1- or GAD1-labeled neurons (two-way ANOVA, Fisher's post hoc; GAD2/defeat vs GAD1/defeat *p = 0.033; GAD2/defeat vs Pet1/defeat ***p < 0.001; GAD2/defeat vs GAD2/undefeated §p < 0.001; n = 3–7 per group). L, Confocal image depicting the distribution of vmPFC axon terminals in the DRN after anterograde tracing of excitatory vmPFC neurons using AAV-mediated expression of ChR2-YFP driven by the CaMKIIa promoter. Note the dense clustering of tagged terminals in the lateral portion of DRN corresponding to the areas rich in cFos expressing GABAergic neurons after social defeat (dashed circles).
- Figure 2.
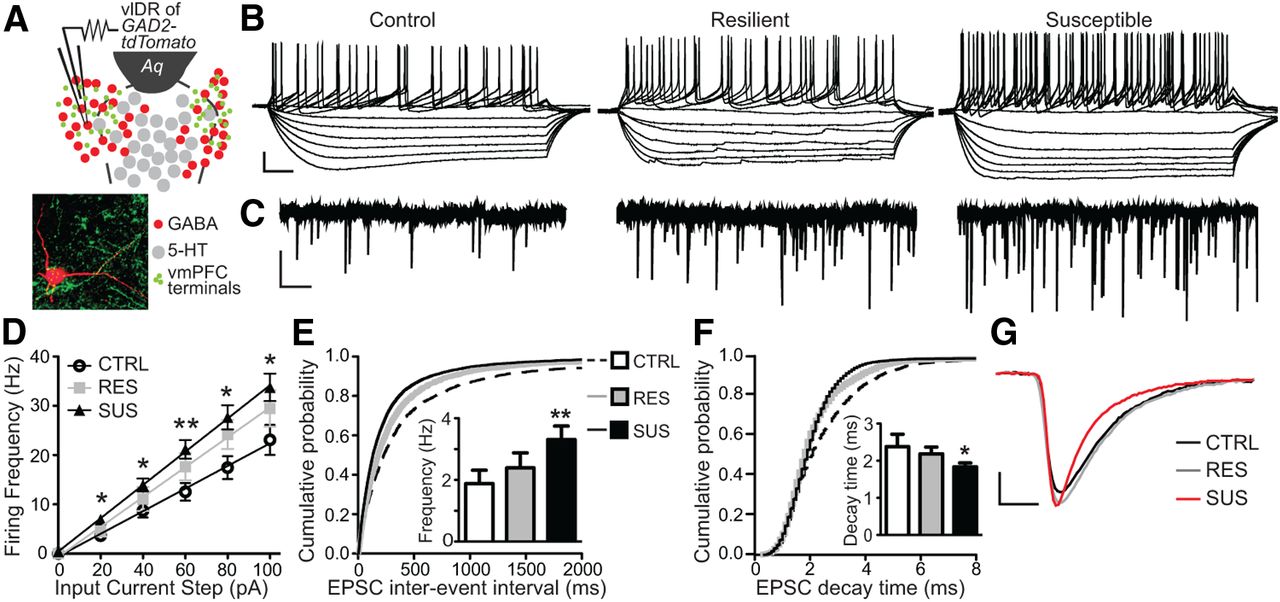
Social defeat sensitized excitatory input and excitability of vmPFC-innervated DRN GABAergic neurons in SUS mice but not in RES mice. A, Schematic of DRN topography in recorded slices from GAD2-tdTomato mice. vlDR, ventrolateral DRN; Aq, aqueduct. Recorded neurons were purposely selected in ventrolateral subregions of the DRN that are rich in afferents from the vmPFC. Inset depicts a high-magnification confocal image of a biocytin-filled recorded GAD2-tdTomato neuron (red) in close contact with axon terminals from vmPFC neurons (green) anterogradely traced using AAV-CaMKIIa-ChR2-YFP. B, Raw data traces of membrane potential changes recorded from DRN GABA neurons in response to hyperpolarizing and depolarizing injection of current in control, RES, and SUS mice. Scale bar, 20 mV, 50 ms. C, Representative voltage-clamp traces of mEPSC synaptic activity in DRN GABA neurons from control, RES, and SUS mice. Scale bar, 20 pA, 500 ms. D, Frequency-intensity plots showed increased excitability of DRN GABA neurons in SUS mice [repeated-measures ANOVA, Fisher's post hoc; SUS vs CTRL, 20 pA *p = 0.030, 40 pA *p = 0.034, 60 pA **p = 0.008, 80 pA *p = 0.012, 100 pA *p = 0.025; N(n) = 7(29) for control, 4(20) for RES, 10(37) for SUS]. E, Cumulative probability plot shows a shift to shorter interstimulus intervals of mEPSC synaptic activity in DRN GABA neurons of SUS mice versus control or RES mice (Kolmogorov–Smirnov test, Z = 7.1402, p < 0.001). Inset displays summary histogram showing significantly higher average mEPSC frequency in SUS mice (one-way ANOVA, Fisher's post hoc; SUS vs CTRL **p = 0.006). F, Cumulative probability plot of mEPSC decay time shows the shift to faster decay times in DRN GABA neurons of SUS mice (Kolmogorov–Smirnov test, Z = 6.4021, p < 0.001). Inset shows summary histogram depicting the significantly lower average mEPSC decay times in SUS mice versus control and RES mice (one-way ANOVA, Fisher's post hoc; SUS vs CTRL *p = 0.014). G, Enlarged depiction of averaged individual EPSC synaptic events in GABA neurons for each group. Scale bar, 4 pA, 2 ms.
- Figure 3.
Social defeat decreased excitability and enhanced inhibitory input of DRN 5-HT neurons of SUS mice. A, Raw data traces of membrane potential changes recorded from DRN 5-HT neurons in response to hyperpolarizing and depolarizing current injection in control, RES, and SUS mice. Scale bar, 20 mV, 50 ms. B, Representative traces of mIPSC activity in DRN 5-HT neurons from control, RES, and SUS mice. Scale bar, 20 pA, 2 s. C, Schematic of DRN topography in recorded slices from Pet1-tdTomato mice. dm/vmDR, dorsomedial/ventromedial DRN; Aq, aqueduct. D, Frequency-intensity plots show decreased excitability of DRN 5-HT neurons in SUS mice [repeated-measures ANOVA, Fisher's post hoc; SUS vs CTRL, 60 pA *p = 0.043, 80 pA *p = 0.024, 100 pA *p = 0.023, 120 pA *p = 0.033; N(n) = 3(15) for control, 3(16) for RES, 3(21) for SUS]. E, Cumulative probability plots show the shift to shorter interstimulus intervals of mIPSC activity in DRN 5-HT neurons of SUS mice versus control or RES mice (Kolmogorov–Smirnov test, Z = 8.652, p < 0.001). Inset displays summary histogram depicting the significantly higher average mIPSC frequency in SUS mice (one-way ANOVA, Fisher's post hoc; SUS vs CTRL *p = 0.035).
- Figure 4.
Archaerhodopsin-mediated photoinhibition of DRN GABAergic neurons silenced their spontaneous firing and decreased IPSC activity of neighboring 5-HT neurons. Ai–Aiv, Confocal image of Arch-GFP-expressing GABAergic neurons (green) and TPH labeled 5-HT neurons (red) in the DRN. Scale bar, 50 μm. Av, Example of a 5-HT neuron recorded in the DRN that was filled with biocytin and its neurochemical identity was confirmed a posteriori using TPH immunostaining. B, Current-clamp trace of a spontaneously firing, Arch-expressing GAD2+ GABA neuron. Exposure to 318 mW mm−2 of 593 nm light inhibited the tonic firing. Scale bar, 20 mV, 1 s. C, Voltage-clamp recording from a later identified 5-HT neuron. Illumination of the DRN with 318mW mm−2 of 593 nm light resulted in a reduction of IPSC frequency that returned upon cessation of laser stimulation. Scale bar, 10 pA, 1 s. D, Schematic of recording experiments. Whole-cell patch-clamp was performed on either GABA or 5-HT neurons while Arch-expressing GABA neurons were photoinhibited via laser stimulation. E, Summary histogram showing that laser illumination resulted in complete silencing of spontaneous firing of GAD2+ GABA neurons [N(n) = 3(18)] that was restored upon laser cessation (repeated-measures ANOVA, Fisher's post hoc; baseline vs laser, ***p < 0.001; laser vs post-stim ***p < 0.001; baseline vs post-stim *p = 0.030). F, Summary histogram showing that laser stimulation reduced IPSC frequency in 5-HT neurons [N(n) = 2(5)] that was restored after laser cessation (repeated-measures ANOVA, Fisher's post hoc; baseline vs laser ***p < 0.001; laser vs post-stim ***p < 0.001; baseline vs post-stim *p = 0.047).
- Figure 5.
Sensory contact was necessary for encoding of avoidance behavior. A, Experimental conditions used to evaluate the contribution of sensory contact to acquisition of social avoidance behavior. During social defeat, all groups received 5 min of physical contact with an aggressor, followed by variable durations of sensory exposure through a Plexiglas divider. The “Regular Defeat” group remained in sensory contact overnight with the aggressor, whereas the “Limited Sensory” group was maintained in sensory contact only for 20 min before being transferred into single housing overnight. In the “No Sensory” group, mice were individually housed immediately after physical contact. These conditions were repeated for 10 d, with exposure to a novel aggressor each day. Social avoidance was tested on day 11, 24 h after last physical defeat exposure. B, Compared with undefeated controls, mice from the Limited Sensory group displayed a level of social avoidance comparable to the Regular Defeat group. In contrast, mice from the No Sensory group did not display a significant decrease in interaction compared with undefeated controls (one-way ANOVA, Fisher's post hoc; limited vs no sensory **p = 0.005; limited vs control **p = 0.005; n = 8–13 per group). Without a novel target present, durations in the interaction zone did not differ between groups.
- Figure 6.
Photoinhibition of DRN GABA neurons prevented the acquisition but not the expression of social avoidance behavior. Two cohorts of GAD2-Cre mice were injected in the DRN with Cre-dependent AAV vectors, driving expression of Arch-GFP or a sham tdTomato protein selectively in DRN GABA neurons. The first cohort (A, top row: photoinhibition during training) received daily photoinhibition during 20 min of sensory contact after physical aggression. The second cohort (A, bottom row: photoinhibition during testing) received photoinhibition only during the social interaction task. Heat maps depict representative behavioral effects of DRN GABA photoinhibition. Corresponding group averages are shown for the time spent in the interaction zone in Control and Defeated mice receiving photoinhibition during the sensory contact period (B) or during the social interaction task (C). Light application during daily sensory contact period abrogated social avoidance in Arch-GFP-targeted but not in tdTomato-targeted mice (two-way ANOVA, Fisher's post hoc; defeated Arch/stim vs defeated Arch/no stim *p = 0.011; defeated Arch/stim vs defeated tdTomato ***p < 0.001; n = 6–8 per group). In contrast, no significant effects were observed when light was applied during the social interaction task (two-way ANOVA, Fisher's post hoc; Arch CTRL vs DEF ***p < 0.001). Note that GABA photoinhibition had no effect on the behaviors of mice tested in the absence of a social target and that laser illumination per se was devoid of effect in mice expressing tdTomato.


Tables
Time in center of arena (s) GAD2-Cre/Arch GAD2-Cre/tdTomato Stim (±) + − + − Defeated 28.94 ± 7.19*** 28.89 ± 6.61*** 25.56 ± 7.38*** 25.54 ± 9.34*** Control 56.09 ± 10.47 46.86 ± 8.59 50.50 ± 4.13 42.81 ± 8.79 Data are expressed as mean time in the center of arena ± SEM.
↵***Significant difference in defeated mice from undefeated controls of the same virus (GAD2-Cre/Arch or GAD2-Cre/tdTomato) and stimulation (+ or −) condition (p < 0.01, two-way ANOVA, Fisher's post hoc, control vs defeated).
Defeated mice GAD2-Cre/Arch GAD2-Cre/tdTomato Stim (±) + − + − Time in open arms (s) 6.30 ± 2.27 5.66 ± 3.77 4.69 ± 1.48 4.77 ± 2.94 Time in closed arms (s) 267 ± 6.5 254.50 ± 7.76 273.42 ± 6.86 271.65 ± 8.00 Open arm entries (no.) 6 ± 1 4 ± 1 5 ± 2 3 ± 1 Closed arm entries (no.) 15 ± 2 11 ± 2 13 ± 4 11 ± 3 Data are expressed as mean time spent in arms or the number of arm entries ± SEM. There were no significant differences between conditions.


