

Article Figures & Data
Figures
- Figure 1.
Schematic of FC analysis steps. A group temporal concatenation ICA was performed to find separable spatial components within each spherical searchlight. These components were then back projected to find a subject-specific time course for each searchlight component. Time courses were then simultaneously entered into a GLM voxelwise throughout the brain, resulting in a FC map for each component.
- Figure 2.
Surface rendering showing peak regions where the highest amount of overlap of signals from the canonical ICNs were detected. The 10 FC maps obtained from each searchlight were spatially correlated with ICNs from a WBICA of the same data and the median (top) and number of correlations above an arbitrary threshold of r > 0.3 (middle) were plotted on each searchlight. Median values were averaged at locations where the searchlights overlapped. Probability maps of searchlights that have significantly elevated median spatial correlations with ICNs (bottom). These were thresholded at p < 0.01, uncorrected, and using false discovery rate correction with q = 0.1 and q = 0.05.
- Figure 3.
Example FC maps obtained from five of the nine peak regions observed in Figure 2. Many of these FC maps resembled the whole-brain ICNs detected from a WBICA of the same data. Peak regions shown are the PCC and ACC, the right SMG (rSMG), left SMG (lSMG), and right MTG. RSNs are (left to right) the default mode, visual streams, right frontoparietal, motor and auditory/salience networks, which are displayed for illustrative purposes (labeled by spatial correlation to BrainMap data in Smith et al., 2009). Colorbar shows z-scores. FC maps are thresholded at z > 3.5. Correlation values for each peak region for each ICN map are displayed in Figure 4.
- Figure 4.
Correlation matrix between FC maps from the nine peak regions observed in Figure 2 (y-axis) and the resting state ICNs taken from Smith et al. (2009). ICN1 to ICN12 are shown on the x-axis. Each hub contained signals from distinct portfolios of the ICNs, suggesting they mediate the cross talk between different combinations of functional networks. The modulation of these multiple subregions during attentional engagement was assessed using a CRT task. Arrows indicate subregions where there was increased or decreased activity during attentive periods of the task compared with rest. Peak regions were (column from top to bottom, ordered by amount of spatial overlap with the default mode network); the right (R) precuneus (Precun), right PCC, right SMG, left (L) inferior TOPJ, left SMG, left superior lateral occipital cortex (Sup LatOcc), right middle temporal gyrus (MTG), right ACC, and left inferior precentral gyrus (Inf PreC). ICN numbers (rows) are: 1, default mode; 2, right frontoparietal; 3, left frontoparietal; 4–6, cognitive control; 7, visual streams; 8, sensorimotor; 9, salience plus auditory; 10, visual-1; 11, visual-2; and 12, visual-3 networks.
- Figure 5.
Correspondence between peak hub regions detected using ICNs obtained from different datasets. As with Figure 2, FC maps from each searchlight were correlated with ICNs from a WBICA of the same data and RSNs and grouped task-based data from BrainMap (BM) taken from Smith et al. (2009). Unthresholded (left) and thresholded (right) maps are included to illustrate the similarity in spatial distribution of the peak regions.
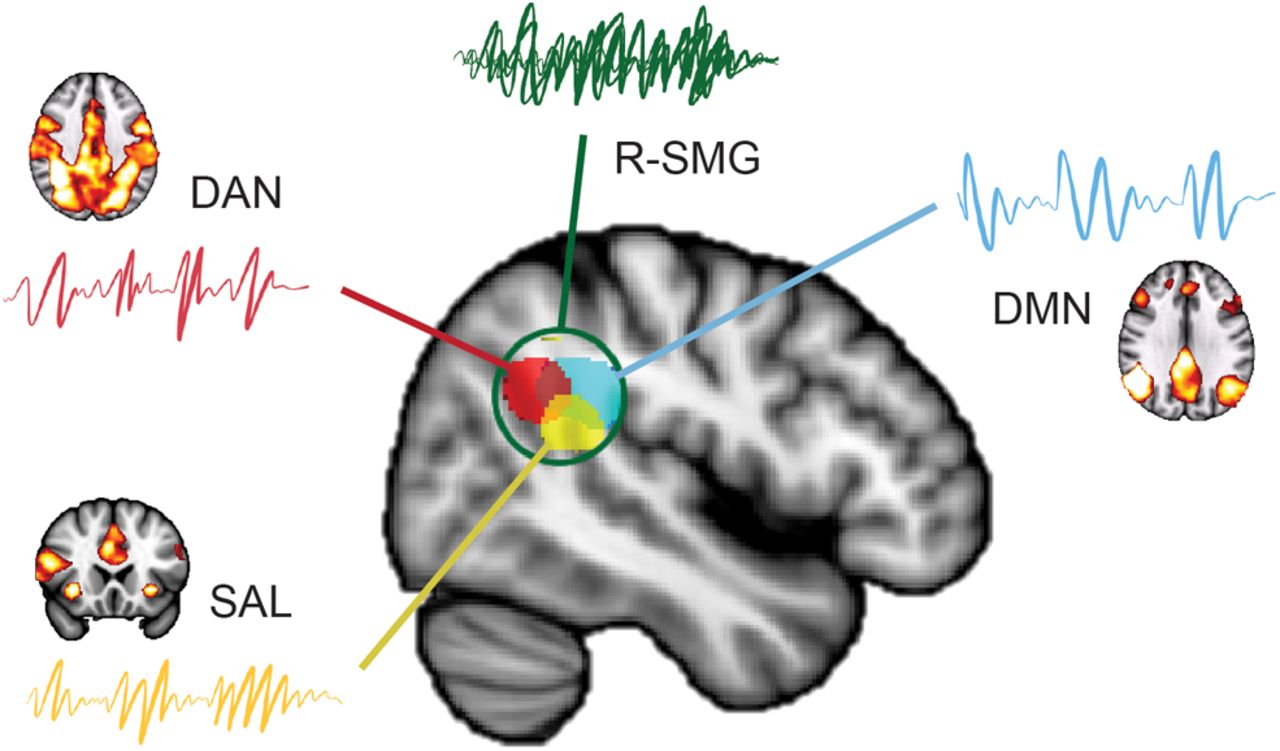
- Figure 6.
Echoes in the right SMG (R-SMG). Decomposition of the neural signal within the R-SMG revealed multiple functional signals. These signals were strongest within small, separable but adjacent subregions of the R-SMG (red, yellow, and blue areas). Whole-brain FC (activation maps) revealed that the decomposed signals were echoes of intrinsic connectivity networks such as the default mode (DMN), salience (SAL), and dorsal attention (DAN) networks. This suggests that the R-SMG is uniquely placed to be able to coordinate and integrate the activity of various functional networks. Time series plots are illustrative of the overall activity being a combination of different signals.
- Figure 7.
FC maps from decomposition of the PCC searchlight into overlapping and nonoverlapping subregions. Similar FC maps were obtained using both types of subregions. Nonoverlapping subregions were obtained by thresholding the independent components from within the searchlight at an arbitrary threshold of z > 3.5 and excluding voxels in which 2 or more components overlapped.


Tables
- Table 1.
Table showing coordinates of spheres containing significantly elevated median spatial correlations with ICNs as illustrated in Figure 2, bottom
Name Hemisphere x y z Confidence PCC R 10 −66 28 *** TPJ L −30 −86 28 *** Precun L −10 −86 28 *** TOPJ L −50 −66 8 *** pMTG R 50 −26 −12 ** Supp Latt Occ R 30 −86 28 ** Precun R 10 −86 28 ** TPJ R 70 −46 28 ** SPL L −30 −46 −48 * pSTG L −70 −26 8 * ACC L −10 14 48 * TOPJ R 50 −66 8 * ACC R 10 34 28 * PreC L −50 −6 28 * ↵Where multiple spheres overlapped in the same cortical area, only the highest level of confidence is displayed. *p < 0.01 (uncorrected), corrected using false discovery rate at **q = 0.1 and ***q = 0.05.
Precun, precuneus; pMTG, posterior MTG; Supp Latt Occ, superior lateral occipital cortex; SPL, superior parietal lobe; pSTG, posterior superior temporal gyrus; PreC, precentral gyrus.


